


Radeon™ GPU Profiler
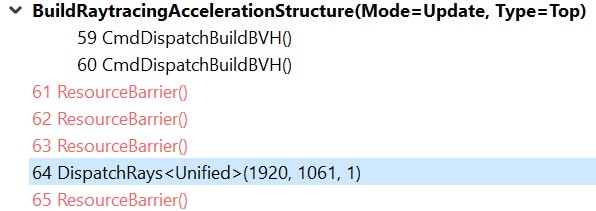
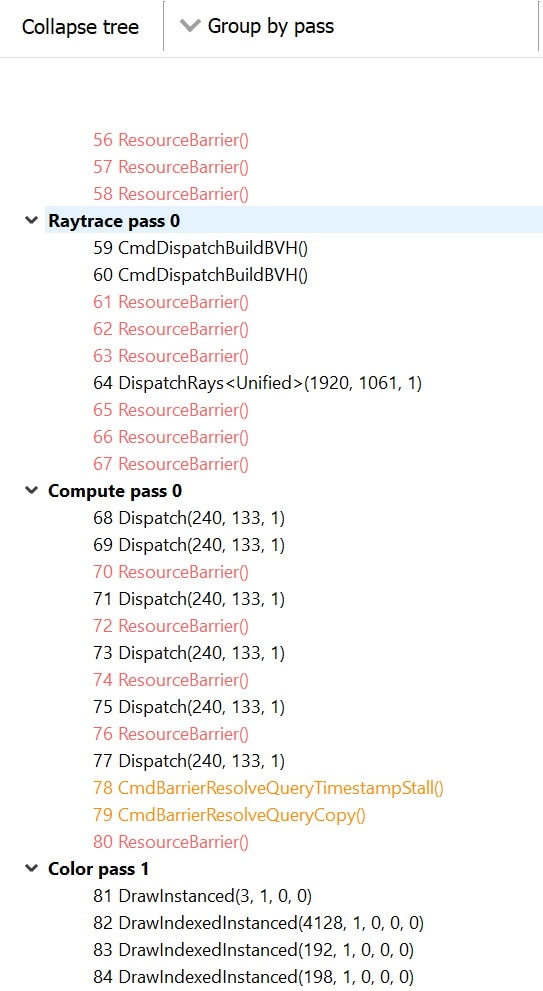
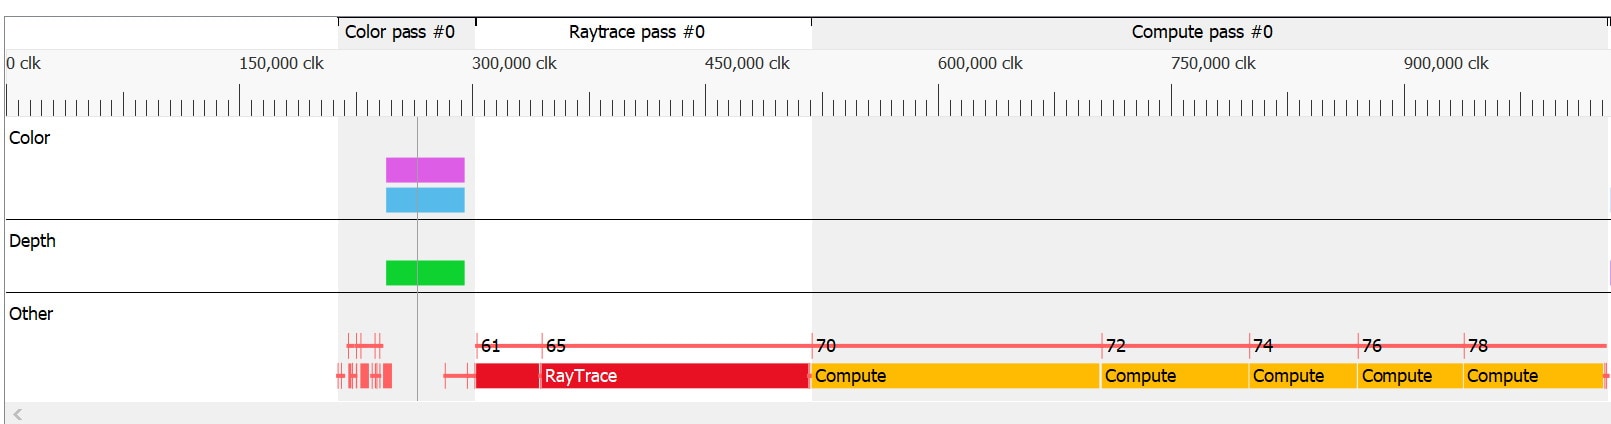
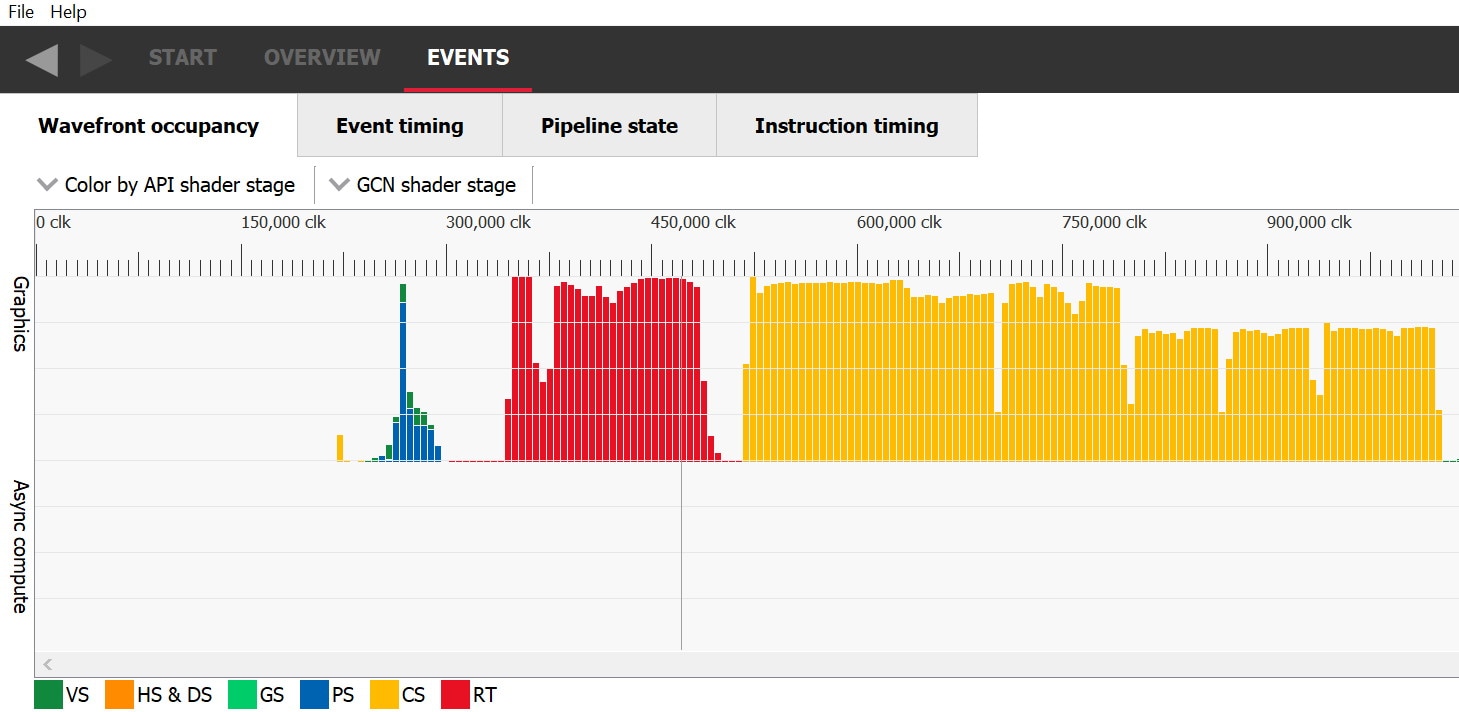
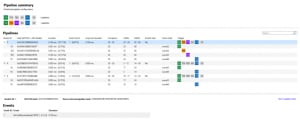
RGP gives you unprecedented, in-depth access to a GPU. Easily analyze graphics, async compute usage, event timing, pipeline stalls, barriers, bottlenecks, and other performance inefficiencies.
AMD RDNA™ 2 – Radeon™ GPU Profiler 1.10 – YouTube link
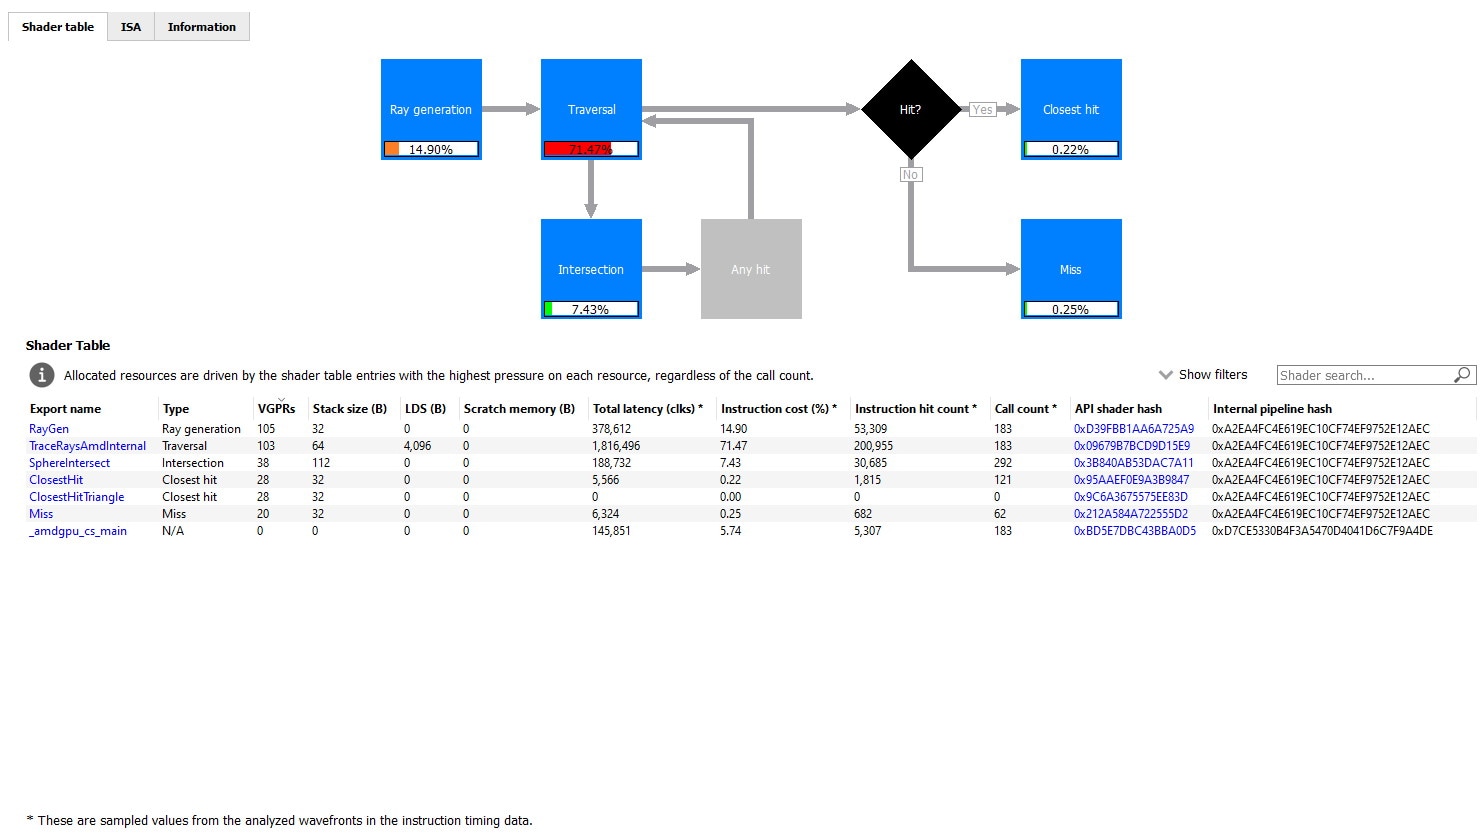
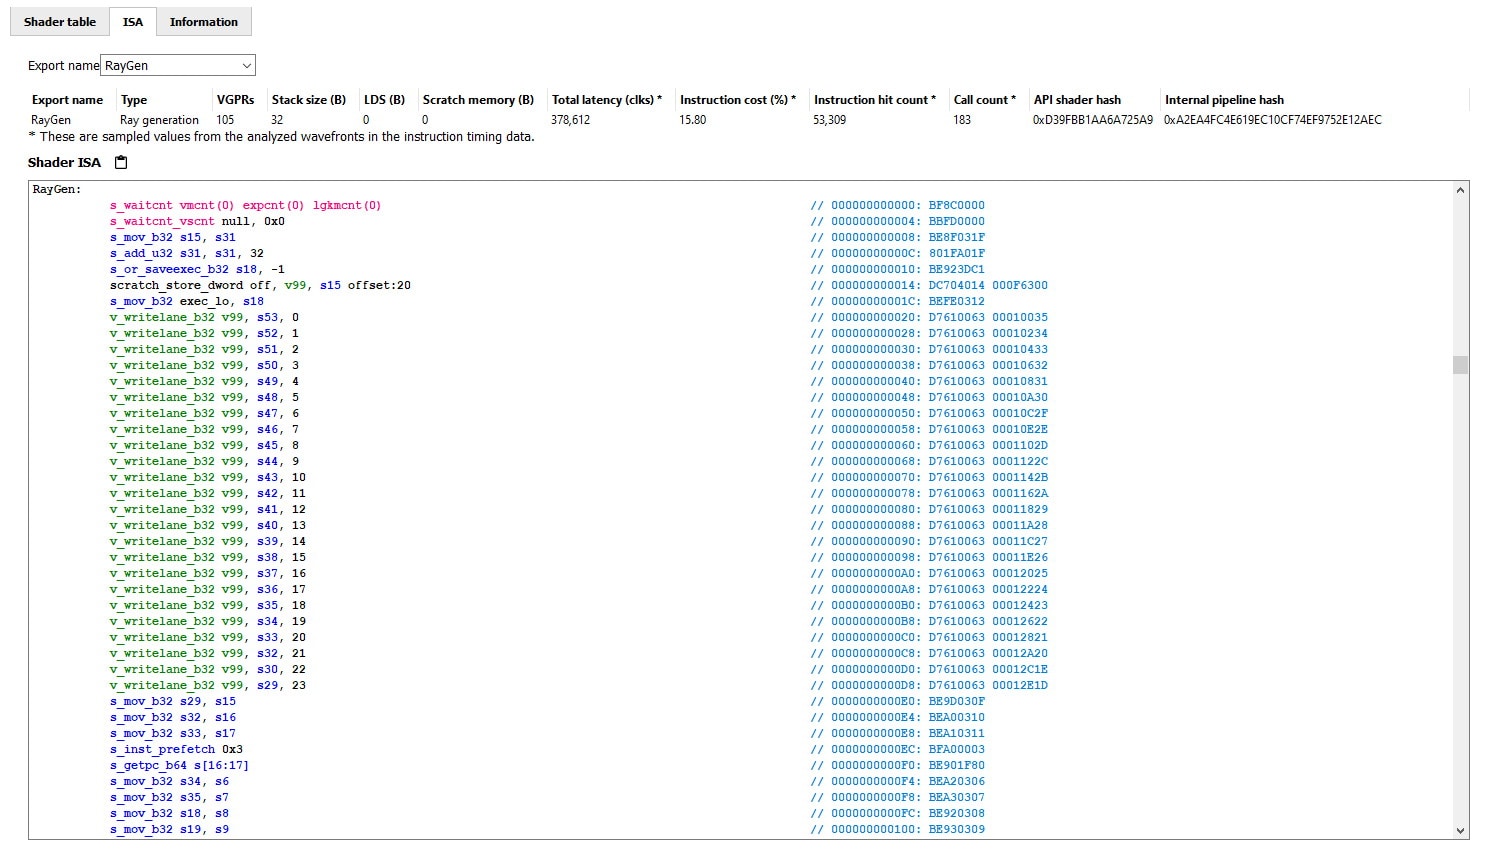
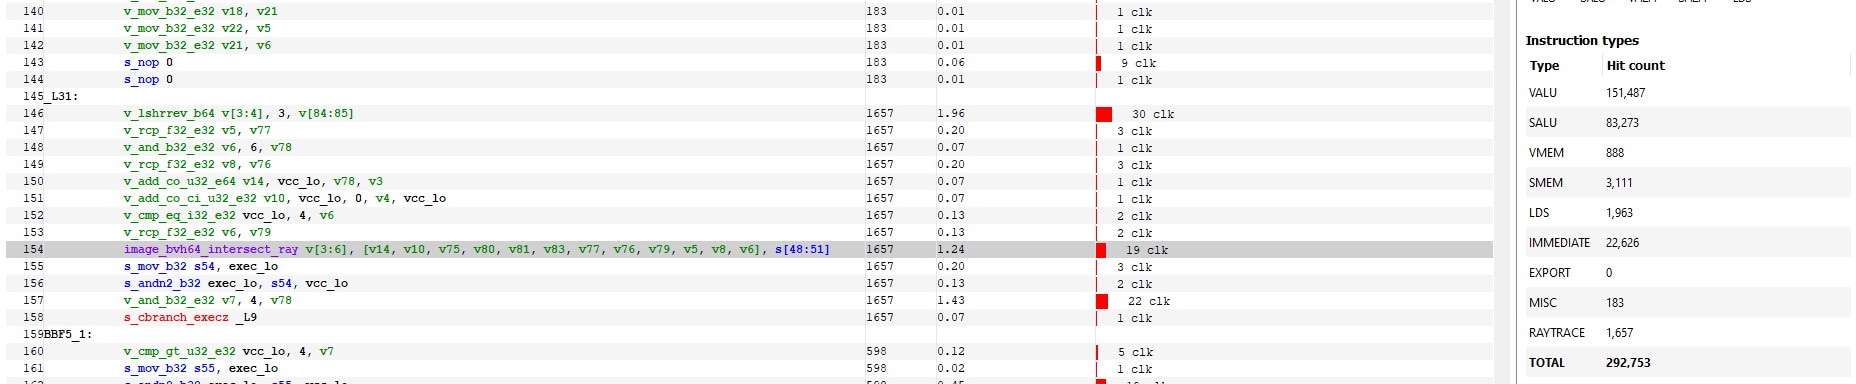
RGP 1.9 and 1.10 introduce support for AMD Radeon™ RX6000 series GPUs, a new memory cache counter feature, and support for DirectX® and Vulkan® ray tracing.
Radeon™ GPU Profiler 1.8 released
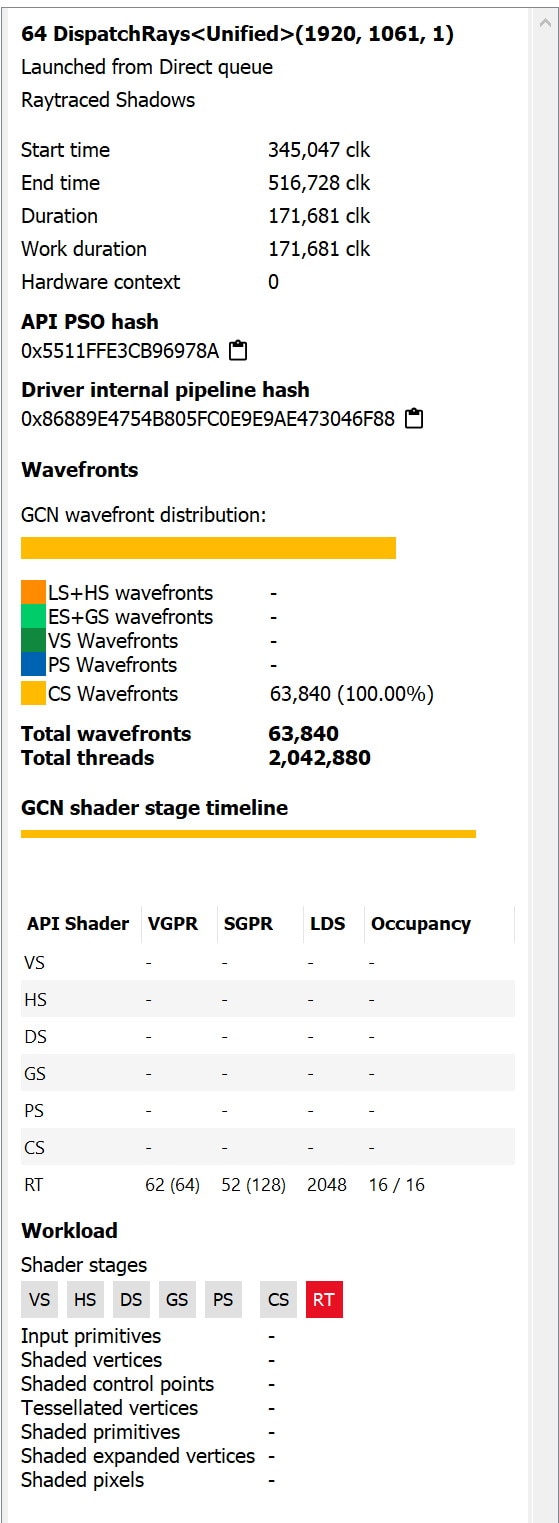
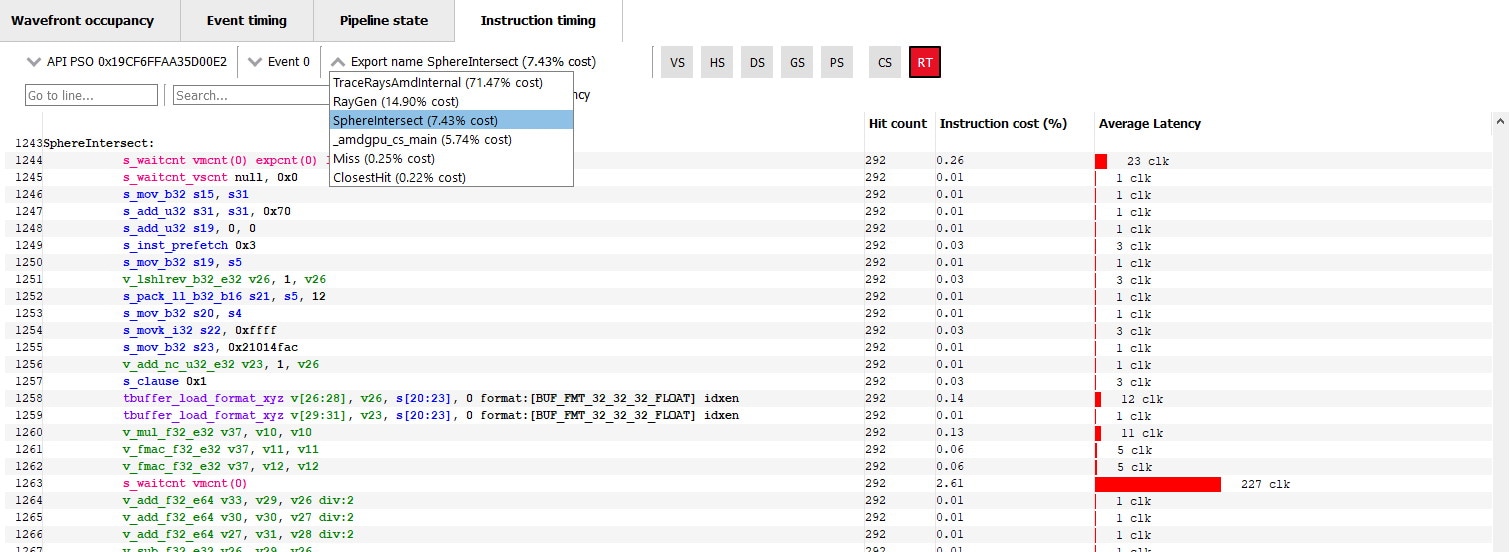
The latest release of Radeon™ GPU Profiler introduces an updated Radeon Developer Panel, Instruction Timing, and more.

Radeon™ GPU Profiler
RGP gives you unprecedented, in-depth access to a GPU. Easily analyze graphics, async compute usage, event timing, pipeline stalls, barriers, bottlenecks, and other performance inefficiencies.