


2022 has been a busy year for the Radeon™ GPU Profiler (RGP) team. We are happy to share with you the fruits of our labor: RGP version 1.14.
New! Support for Radeon™ RX 7000 Series GPUs
A major focus for the team over the past year has been enabling support for AMD’s new flagship GPUs, the Radeon 7000 Series, based on AMD RDNA™ 3 architecture. All of the RGP features you’ve come to know and love are now available for this new generation of GPUs.
For AMD Radeon™ RX 7000 Series GPUs, make sure you have the Adrenalin 22.12.1 for RX7000 Series Graphics with Radeon Developer Tool Suite Support driver or newer installed.
New! Support for profiling HIP applications
Another area of focus this year has been RGP’s support for Compute applications, where we’ve added support for HIP – AMD’s cross-platform and cross-vendor compute API. Like the support for OpenCL™, the support for HIP profiling is available on the Windows platform. All features in RGP that previously supported OpenCL™ applications can now also support HIP. Whether you are interested in kernel timing information, GPU occupancy, or kernel memory cache usage (among many other features), RGP can now help you analyze the performance of your HIP application. HIP profiling is officially supported starting with 22.20-based drivers, though for best results, we always suggest using the most recent driver available on the AMD website.
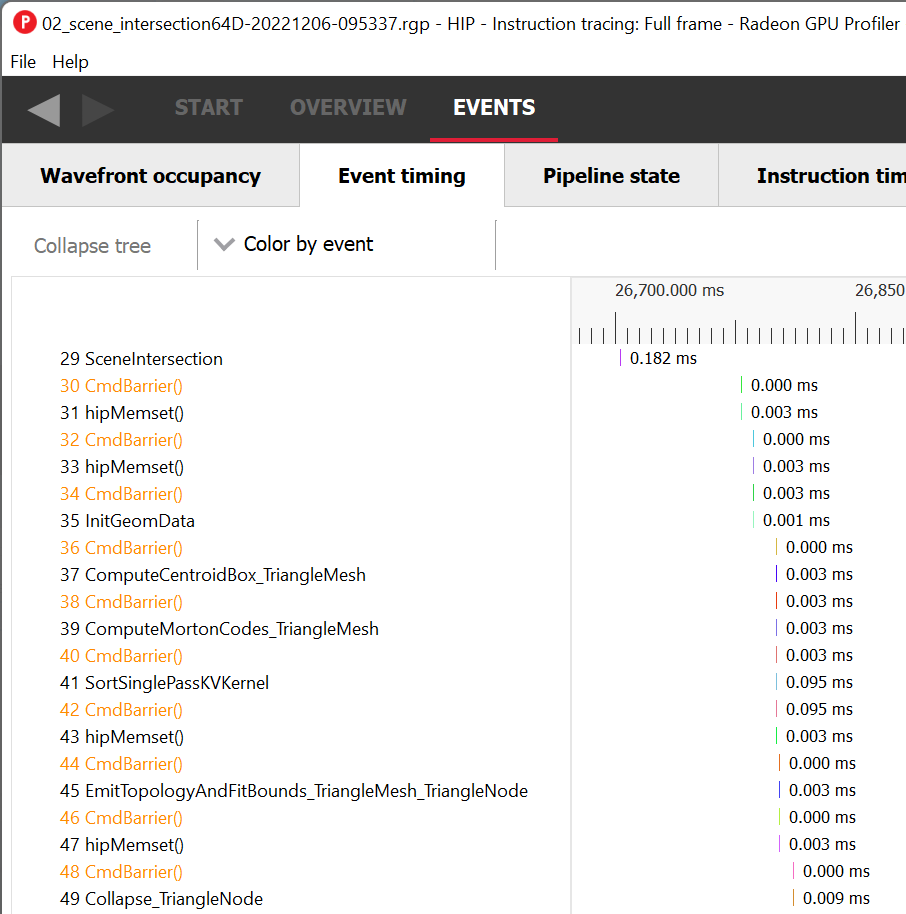
Below is a screenshot of how a simple HIP application looks in RGP. Note that the title bar in RGP indicates that this is a HIP profile. In addition, the event list shows the names of the various HIP kernels dispatched by the application as well as some hipMemset calls which also resulted in work being done by the GPU.
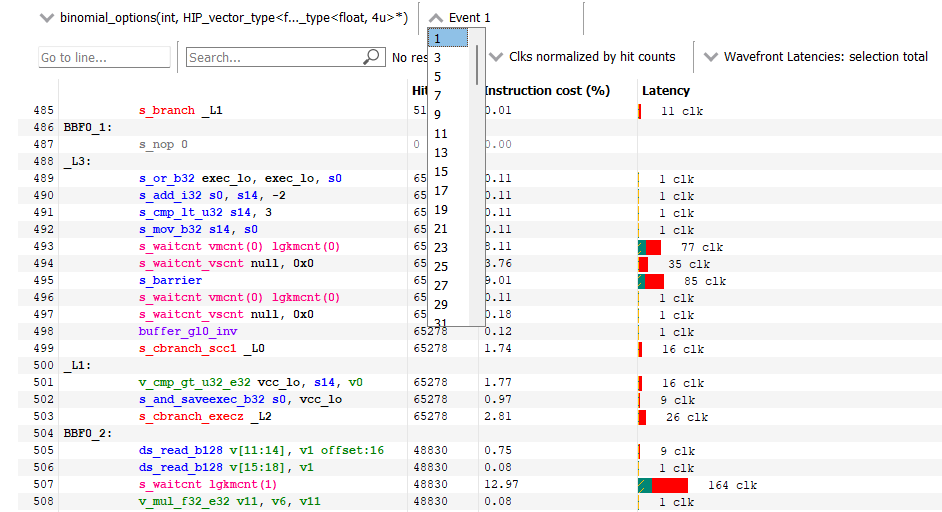
New! Support for Instruction timing for HIP and OpenCL™ applications
Also added in this version is support for collecting and analyzing detailed instruction timing data for OpenCL™ and HIP applications. This feature, which has been available for DirectX®12 and Vulkan® applications for a while, can be used to get deep insight into instruction-level performance of your compute kernels. For more details on the full set of Instruction timing features and to learn how the Instruction timing view can be used to find bottlenecks and optimize kernels, please read the documentation available here.
Navigation in the Instruction timing pane is slightly different for OpenCL™ and HIP applications than it is for DirectX®12 and Vulkan® graphics applications. For graphics applications, you start by choosing an API PSO hash. From there you would choose an event number and then a shader stage. For compute applications, navigation is a bit simpler – you start with an event name (which typically contains the actual kernel name) instead of an API PSO. You also do not need to choose a shader stage, as only compute kernels are available in OpenCL™ and HIP applications.
Related to this feature, the Pipeline state pane will now also show the compiled kernel ISA for each kernel dispatched by the profiled application.
Here is a screenshot of how the Instruction timing pane looks for a HIP application:
Now supported! The Radeon™ Software for Linux driver now supports Counter collection on RDNA™ 2 architecture-based GPUs
Starting with the 22.40 driver on Linux, Cache counter and Ray tracing counter collection is now supported for RDNA™ 2 based GPUs. Previously, counter collection on this family of GPUs was only supported on Windows, but with the latest drivers, Radeon Developer Panel (RDP) and RGP, Linux developers can take advantage of this feature to better understand application performance.
And more!
Here is a list of a few other features added to RGP 1.14
- In the Pipeline state pane, the user interface that shows the ray tracing pipeline flow chart and shader table is now supported for ExecuteIndirect calls that perform raytracing using the indirect shader compilation mode.
- The various Color by combo boxes in the Events panes can now be automatically synchronized by holding down the CTRL key while selecting a Color By mode from one of the combo boxes. When you do this all panes that support the selected Color by mode will be automatically updated to use that mode.
- Improved the dynamic display and filtering of user markers in the Event timeline in the Wavefront occupancy view, especially in the presence of nested and overlapping user markers.
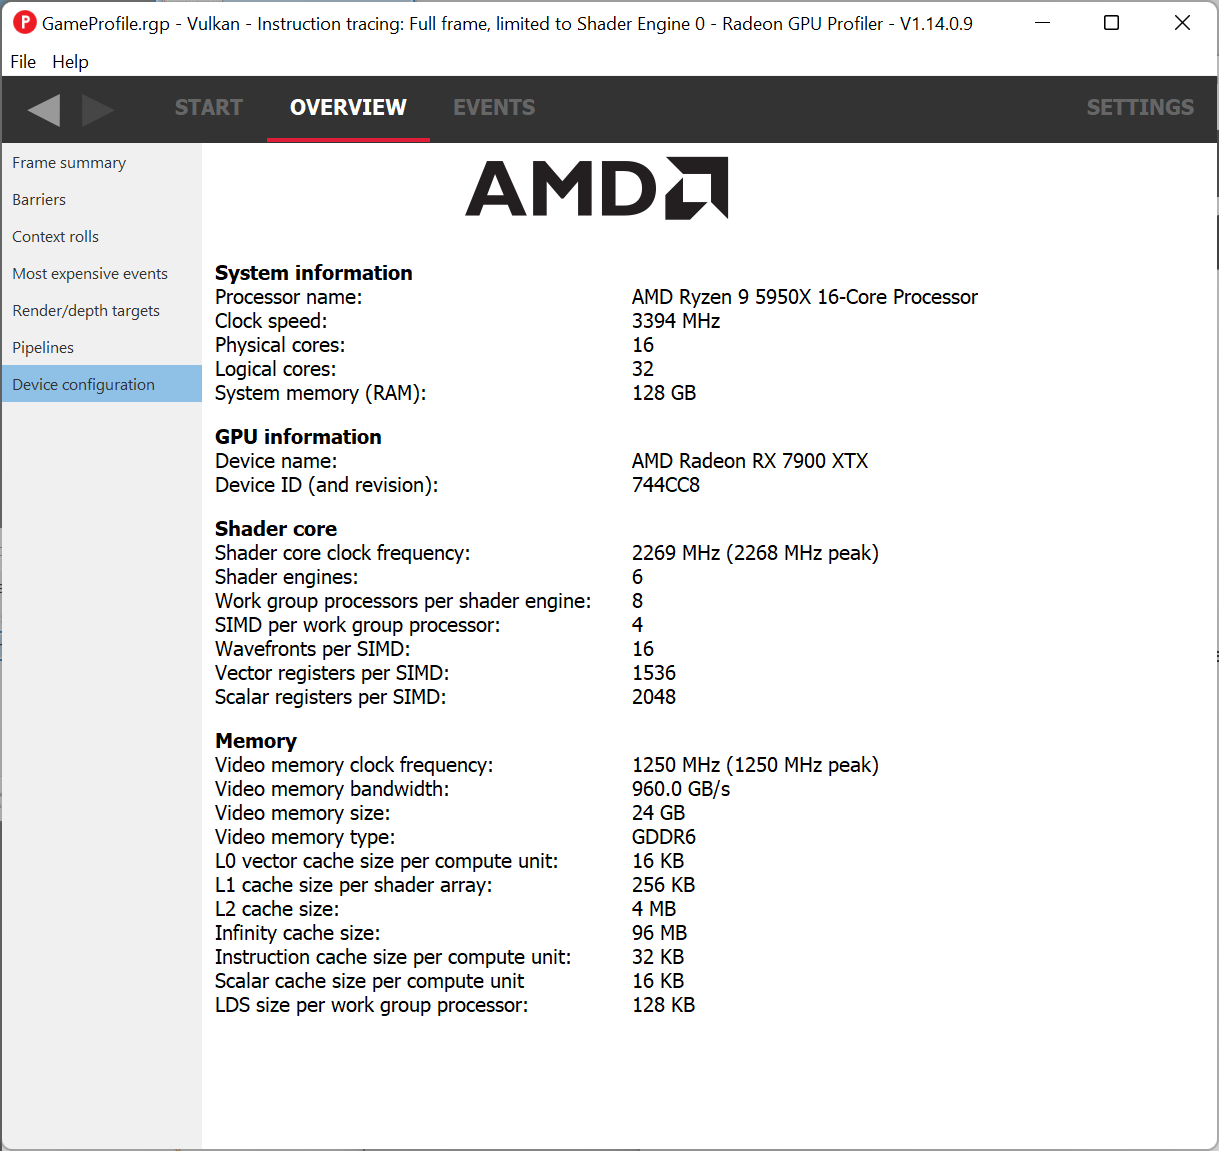
- For profiles captured on RDNA™ 2 and newer hardware (with at least a 22.40-based driver), the Device Configuration pane will now show the sizes of the Infinity cache, the Instruction cache and the Scalar cache.
- The RGP user interface should now behave better when running at lower screen resolutions. We still recommend running at a resolution of at least 1080p (1920 x 1080).
As with all RGP releases, there have been plenty of bug fixes and other smaller enhancements. We invite you to head over to the product page on gpuopen.com and download the latest version to check it out.
And as always, we value feedback we receive from our users. If you have ideas for future enhancements, or have something you’d like to share with us, please visit the product page on GitHub and use the Issues list to share your feedback.