
GPU PerfStudio is no longer supported
Try our Radeon™ Developer Tool Suite instead!
Introducing the Radeon™ Developer Tool Suite
The Radeon™ Developer Tool Suite combines our Radeon™ GPU Profiler, Radeon™ Memory Visualizer, Radeon™ GPU Analyzer, and Radeon™ Developer Panel in one handy package.
GPU PerfStudio
Spend more time writing code and less time debugging. GPU PerfStudio gives developers control with seamless workflow integration. Identify performance and algorithm issues early in the development cycle, and meet your quality and performance goals. GPU PerfStudio is the second generation GPU Performance Analysis and Debugging Tool from AMD. It offers clear advantages to developers by cutting software development time and improving graphics quality. Read on to learn more or click to go to downloads.
Integrated tools
GPU PerfStudio integrates five tools that are key for the contemporary graphics developer. A Frame Debugger that allows you to visualize the graphics state and resources in your frame, a Frame Profiler that allows you to identify per draw call performance issues at the hardware counter level, a Shader Debugger that allows you to step through and debug your shader code and its output, an API Trace window with integrated CPU timing information, and a Shader Analyzer for optimizing your shader code.
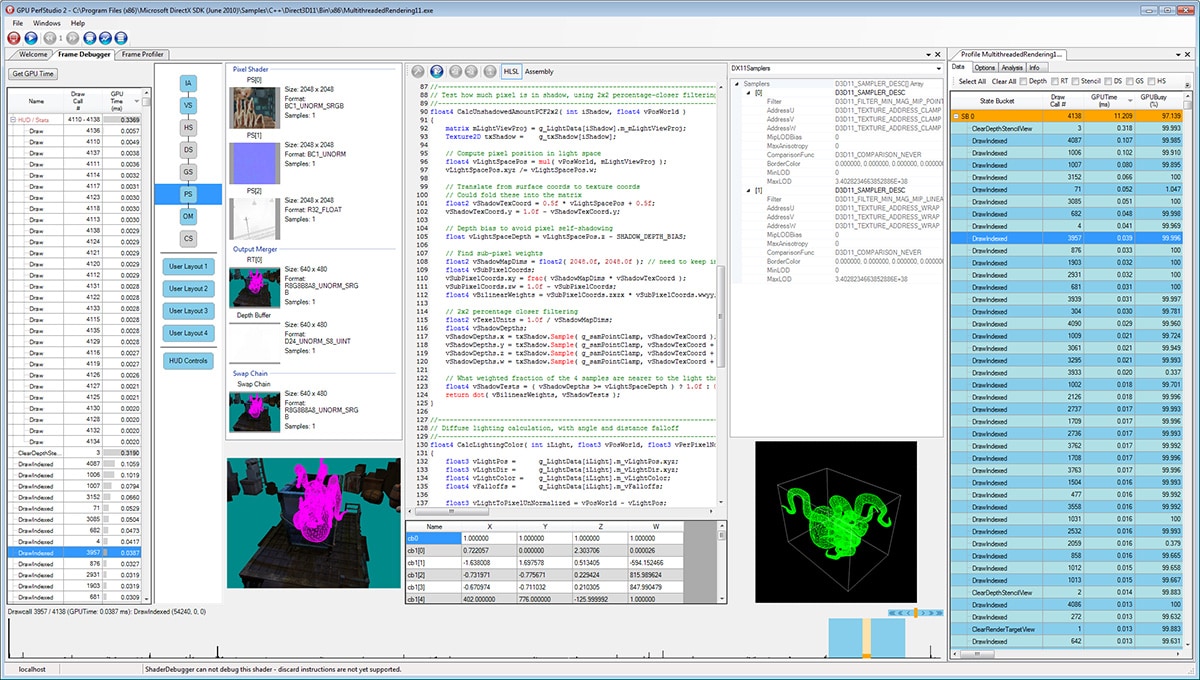
This screen shot (click image for larger view) shows the Frame Profiler and, Frame Debugger in use at the same time. In this scenario the profiler was used to identify an expensive draw call. The draw call was selected in the blue list on the right hand side causing the Frame Debugger to jump to that draw call. The vertex and index buffer, the texture assets, and depth buffer for this draw call are currently displayed. The pixel shader code can be stepped through where the relationship between the code and assets can be thoroughly explored to identify costly aspects of the shader.
GPU PerfStudio Key Features:
- GPU ShaderAnalyzer for GCN – Static analyzer for HLSL
- Supports Vulkan™ on Windows and Linux with the following tools:
- API Trace
- GPU Trace
- Linked Trace
- Supports DirectX® 12 on Windows 10
- Supports DirectX® 11, OpenGL 4.5, and OpenGL ES 3.1 applications on Windows 7 and Windows 8.1
- Integrated Frame Debugger, Frame Profiler, API Trace with CPU timing information
- Integrated Shader Debugger with support for DirectX™ HLSL and ASM
- Supports OpenGL 4.5 and OpenGL ES 3.1 applications on Ubuntu 12.04 or higher.
- Client / Server model
- GPU PerfStudio Client runs locally or remotely over the network
- GPU PerfStudio Server supports 32-bit and 64-bit application
- No special build required for your application
- Customizable Client GUI, define and save your own window layouts
- Drag and drop your application onto the server to start debugging
- No installation required – copy and run anywhere – your settings go with you
What’s New in V3.6?
New Features
- New – Vulkan support for Windows and Linux applications.
- Support for AMD Radeon RX 460, Rx 470, Rx 480 GPUs.
Known Issues
- The current version of the GPU PerfStudio Frame Profiler now only works on HD 7000 (GCN) series and above.
- On Windows 10 you must turn on Developer mode in the “For Developer Settings”.
Other Resources
Downloads
| File Name | Version |
3.6 |
|---|---|
| Size |
15 MB |
| Launch Date |
9/16/2016 |
| OS |
Ubuntu 16.04 |
| Bitness |
32/64 |
| Description |
GPU PerfStudio for Linux. This is the server component to use PerfStudio on Linux. The Windows client is also required. |