GPUPerfStudio Now Supports Vulkan™
GPU PerfStudio 3.6 adds support for high level CPU/GPU analysis of Vulkan applications on Windows and Linux. There are three main tools:
- API Trace
- GPU Trace
- Linked Trace
API Trace
The API Trace shows the application’s CPU-side activity.
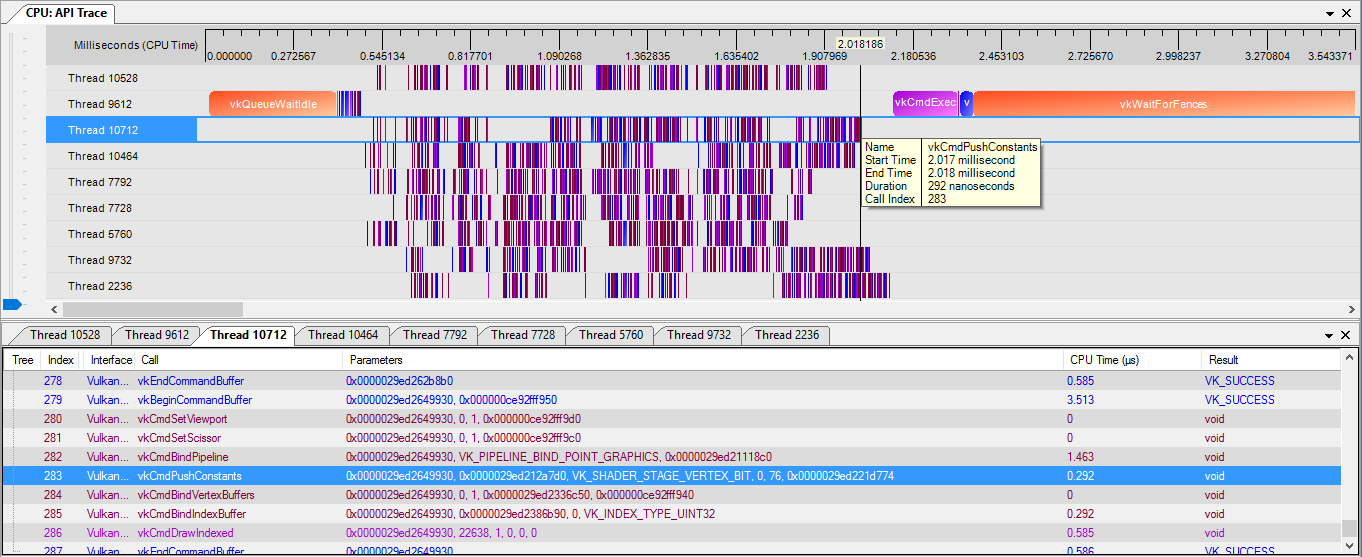
The top pane shows rows of active CPU threads, and all of the API calls issued by each thread. Hovering over each call will bring up a tool-tip with timing information. This pane may also be easily moved left/right, by holding down the left mouse button on it and dragging left/right. It may also be zoomed in and out using the mouse wheel.
The bottom pane shows one tab per CPU thread, with each tab containing a list of all API calls issued by that thread. Here one can also find function parameters and return results for each API call.
Users may also double click on API calls on either pane, to go highlight the call on the opposite pane. Once open, timing data may be refreshed by pressing the API Trace button multiple times.
GPU Trace
The GPU Trace shows the application’s GPU-side activity.
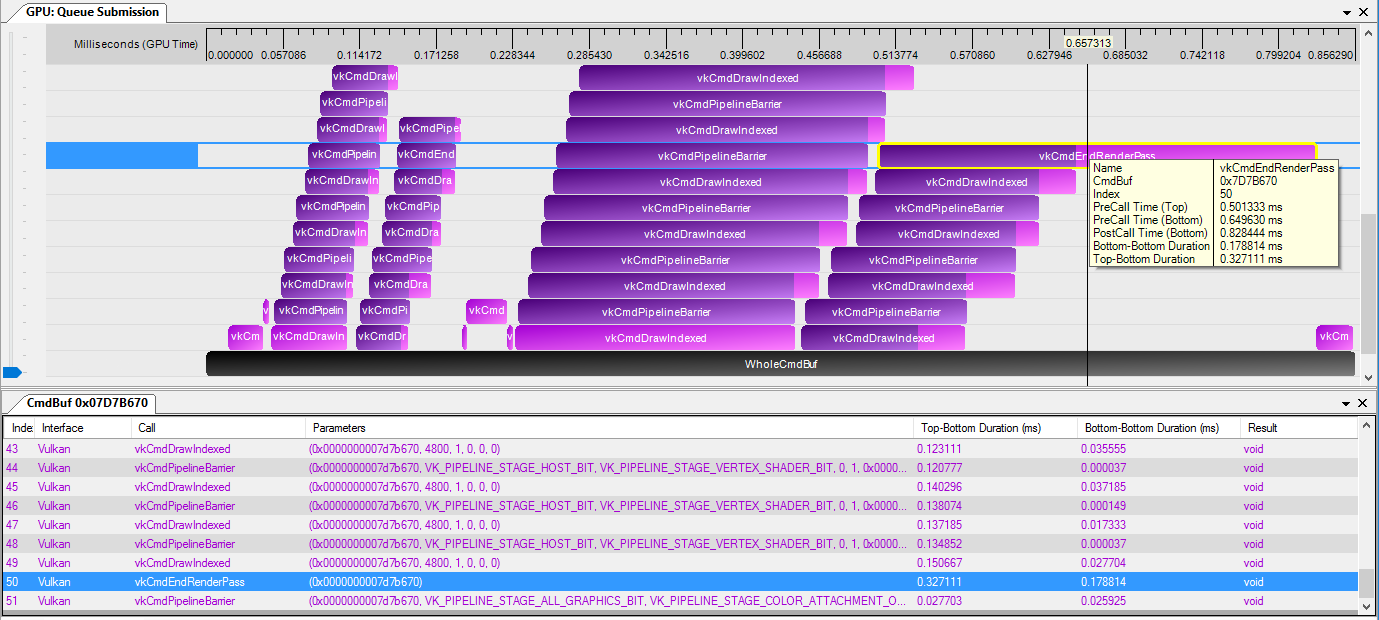
The top pane shows entire command buffer durations (black), and per-command durations (purple/pink). GPU PerfStudio obtains these durations by injecting timestamps the instant a GPU Trace is invoked. These timestamps are injected around all commands of non-baked command buffers, following this pattern: TopTimestamp BottomTimestamp1 Command BottomTimestamp2. The visualization shows commands split into two regions. The purple region is the duration from TopTimestamp to BottomTimestamp1. The pink region is the duration from BottomTimestamp1 to BottomTimestamp2. When looking for performance bottlenecks, the calls to look for are those with long pink regions. These bottom-to-bottom durations provide a reasonable means to identify expensive commands. Any commands which lack a pink region indicate that it executed very fast, and therefore one should focus on other commands. Top-to-bottom durations indicate when a command entered the pipeline, and are only an aid to visualize parallelism. Lastly, if one finds a black WholeCmdBuf without any commands above it, this indicates the command buffer was baked before the GPU Trace was invoked. That is, before GPU PerfStudio had an opportunity to inject timestamps, and therefore per-command durations will be unavailable.
Hovering over each command will bring up a tooltip with timing information. This pane may also be easily moved left/right, by holding down the left mouse button on it and dragging left/right. It may also be zoomed in and out using the mouse wheel.
The bottom pane shows one tab per command buffer, with each tab containing a list of all commands within that command buffer. Here one can also find the parameters for each command.
Users may also double click on commands on either pane, to go highlight the command on the opposite pane.
Once open, timing data may be refreshed by pressing the GPU Trace button multiple times.
Linked Trace
The Linked Trace shows a blend of the application’s CPU and GPU activities.
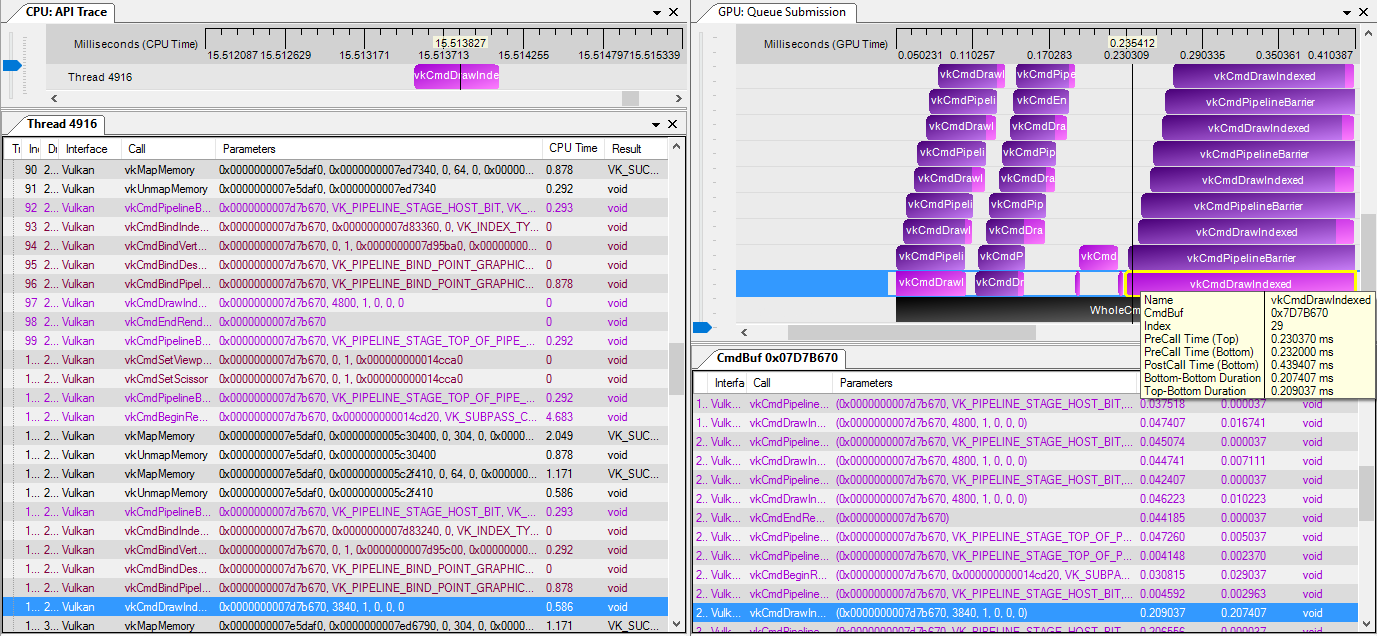
The main purpose of this is to provide a means to cross-link API calls with corresponding GPU commands, and vice versa. Users are encouraged to undock the API Trace and GPU Trace tabs, and place them side-by-side as shown above. It is then possible to click on a call on one side, to identify the same call on the opposite side. This allows one to find expensive GPU commands, and find its point of origin on the CPU side.
Once open, timing data may be refreshed by pressing the Linked Trace button multiple times.