OCAT

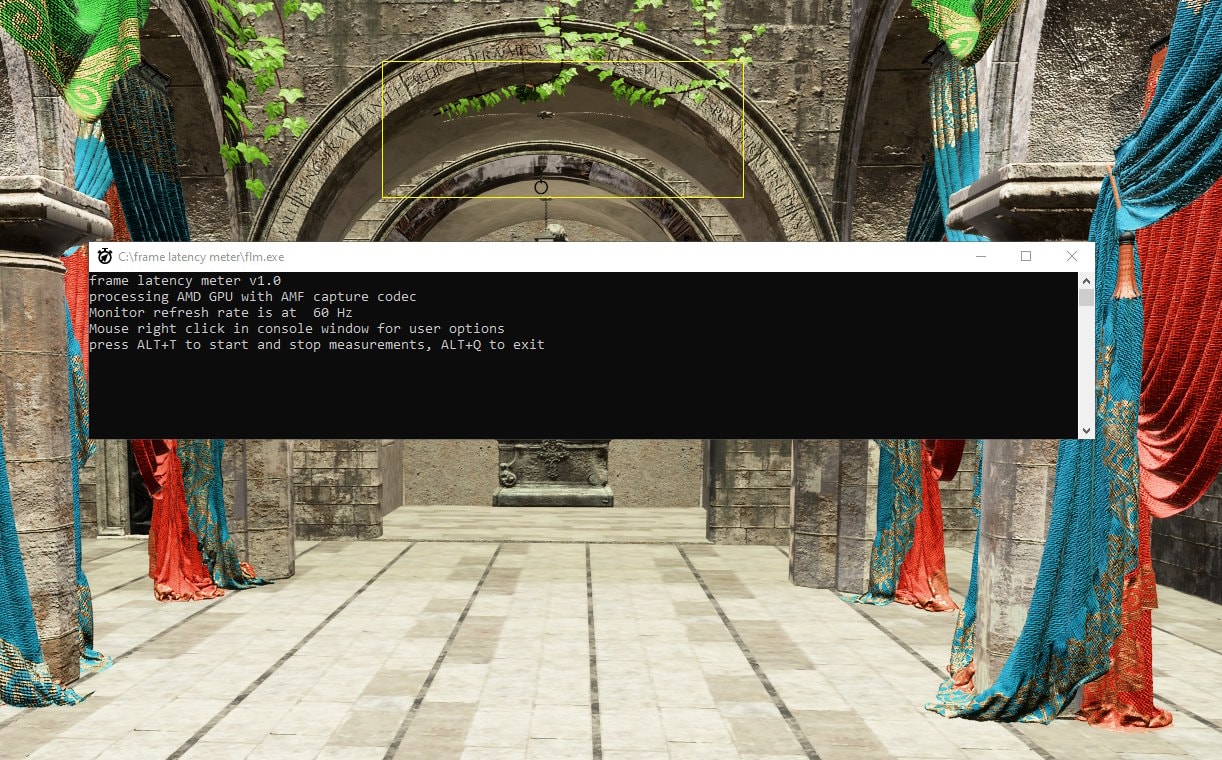
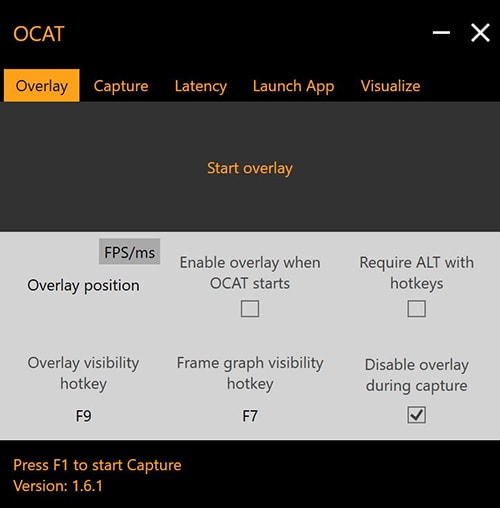
Open

Capture

Analysis

Tool

If you want to know how well a game is performing on your machine in real-time with low overhead, Open Capture and Analysis Tool (OCAT) has you covered.

Download the latest version - v1.6.3

This release adds the following features:

  • Changes that increase compatibility with games using AMD FidelityFX™ Super Resolution 3.
  • Updated the Platform Toolset to v143 (Visual Studio 2022).
  • Updated the .NET version to 4.7.2.
  • Fixed a bug that affected overlay compatibility with a number of games.

Benefits

OCAT supports all major APIs on Windows® – Direct3D® 11, 12 and Vulkan® – and can show an in-game overlay with the current frame rate to give you an at-a-glance overview of instantaneous performance.

That’s good enough for a top level view, but OCAT doesn’t stop there. It also has a detailed analysis mode based on Intel’s excellent PresentMon library, which provides you with in-depth historical data captured across multiple frames, which you can look at offline to get a deeper insight into the runtime performance of games and applications on your system.

OCAT is fully open source and consists of several parts: the user interface, the analysis back-end, and the in-game overlays. You can trigger statistics recording via a hotkey, and you can configure OCAT to avoid drawing the framerate overlay on applications that might be using the GPU but aren’t games, like browsers.

Version history

  • Changes that increase compatibility with games using AMD FidelityFX Super Resolution 3.
  • Updated the Platform Toolset to v143 (Visual Studio 2022).
  • Updated the .NET version to 4.7.2.
  • Fixed a bug that affected overlay compatibility with a number of games.
  • Option to set working directory when launching app from within OCAT.
  • Updated GPUDetect.
  • Updated Windows SDK and Vulkan SDK.
  • Fixed several bugs that affected overlay compatibility with a number of games.
  • Support for RDNA™ and RDNA™ 2 GPUs.
    • Updated AGS to 6.0.
  • Resolution information now also gets retrieved in window mode.
  • Added the ability to disable overlay during measurements.
  • Lag indicator overlay
    • Mutually exclusive to rest of overlay
    • Changes color on lag indicator hotkey signal
  • Estimated driver lag metric in performance summary and verbose log files
  • Resolution information in performance summary and verbose log files
  • Audible indicator toggle
  • Option to require ALT + hotkey combination instead of single hotkey only
  • Audible indicators for starting and stopping recording
    • Helps when the overlay isn’t compatible or available
  • Overlay now prints the graphics API being used
  • Rolling plot of frame times added to overlay
  • 95th and 99.9th percentile frame times in the performance summary
  • Per-frame colored bar
  • Reworked UI

    • Changed to make it much more intuitive to use
      • New Overlay, Capture, Launch App and Visualize tabs
      • Overlay tab controls overlay configuration
      • Capture tab controls capture settings
      • Launch App tab controls overlay injection settings for a single application
      • Visualize tab launches the visualizer!
      • Read OCAT usage for more detailed information
  • User-supplied blacklist

    • OCAT maintains its own internal blacklist, but also lets you provide your own
      • That ensures OCAT doesn’t remove your own blacklist settings when OCAT is updated
      • See Blacklist for more detailed information
  • Launching Steam apps via Steam AppId

    • Allows OCAT to work with many more Steam games and lets the explicit hook work in more cases
    • Read Launch App for more detailed information
  • Presents now show in the frame overview.
  • RenderDoc interoperability (Beta).
  • Brand new UI!
  • New combined summary data
  • Toggle support for the overlay
    • Hotkey is P
  • Documentation moved to Sphinx
  • Initial release

Our other tools

AMD Compressonator

Compressonator is a set of tools to allow artists and developers to more easily work with compressed assets and easily visualize the quality impact of various compression technologies.

GPU Reshape

GPU Reshape is a powerful tool that leverages on-the-fly instrumentation of GPU operations with instruction level validation of potentially undefined behavior.

The RDP provides a communication channel with the Radeon™ Adrenalin driver. It generates event timing data used by the Radeon™ GPU Profiler (RGP), and the memory usage data used by the Radeon™ Memory Visualizer (RMV).

Radeon GPU Analyzer is an offline compiler and performance analysis tool for DirectX®, Vulkan®, SPIR-V™, OpenGL® and OpenCL™.

AMD Radeon GPU Analyzer VS Code Extension

This is a Visual Studio® Code extension for Radeon GPU Analyzer (RGA) to allow you to use RGA directly from within VS Code.

AMD Radeon GPU Detective logo

Radeon™ GPU Detective (RGD) is a tool for post-mortem analysis of GPU crashes. RGD can capture AMD GPU crash dumps from DirectX® 12 apps.

AMD Radeon GPU Profiler

RGP gives you unprecedented, in-depth access to a GPU. Easily analyze graphics, async compute usage, event timing, pipeline stalls, barriers, bottlenecks, and other performance inefficiencies.

Radeon™ Memory Visualizer (RMV) is a tool to allow you to gain a deep understanding of how your application uses memory for graphics resources.

Radeon Raytracing Analyzer

Radeon™ Raytracing Analyzer (RRA) is a tool which allows you to investigate the performance of your raytracing applications and highlight potential bottlenecks.