AMD Radeon™ GPU Profiler
AMD RGP gives you unprecedented, in-depth access to a GPU. Easily analyze graphics, async compute usage, event timing, pipeline stalls, barriers, bottlenecks, and other performance inefficiencies.
As we approach the end of 2023, we are thrilled to introduce version 2.0 of the Radeon GPU Profiler (RGP).
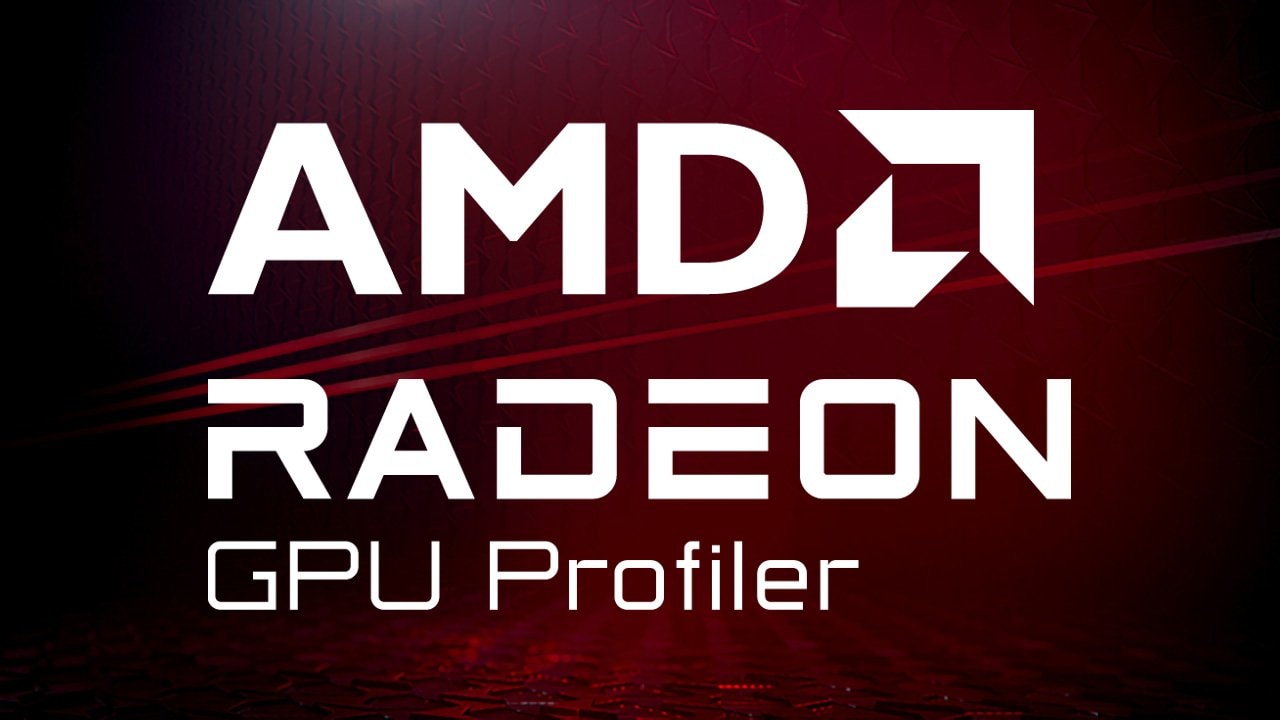
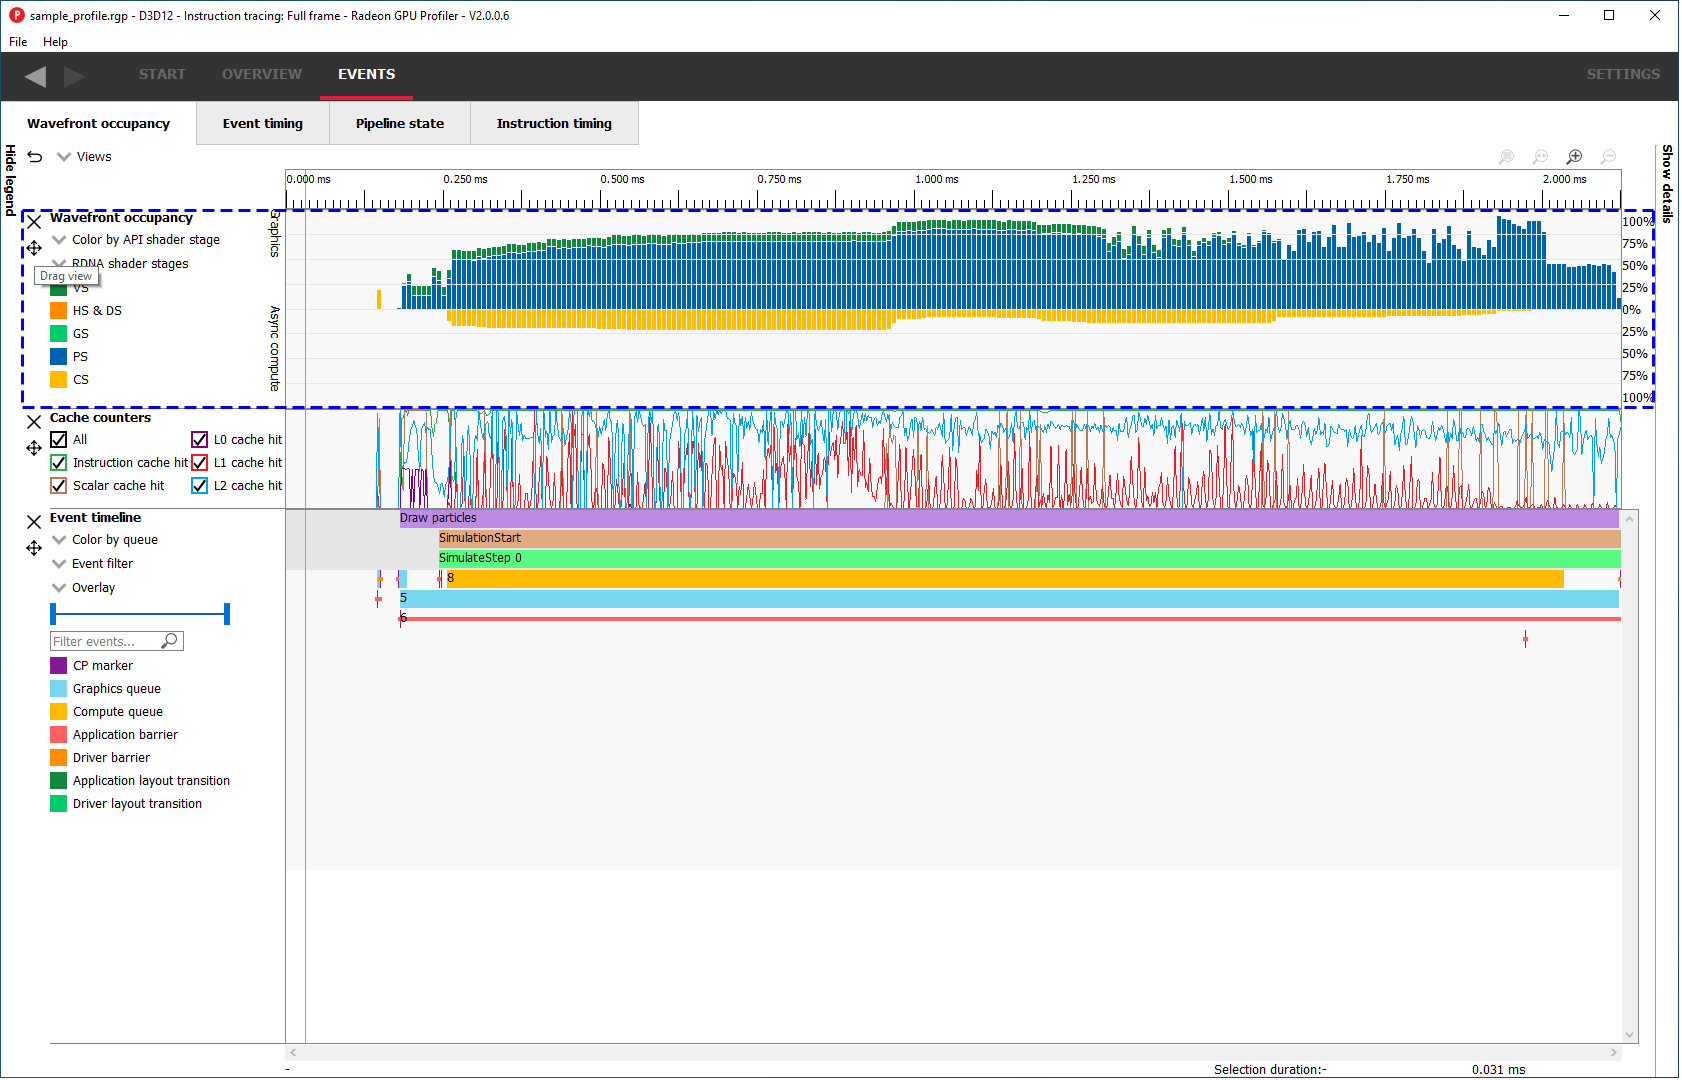
A big reason for moving from version 1.x to 2.x in this release is the introduction of a new user interface in the Wavefront Occupancy view. While the main functionality of this core view remains, there are some key changes that make the view look a bit different. The motivation for these changes is twofold. First, we wanted to maximize the use of screen real estate when looking at some of the key data presented in the RGP UI. Second, we wanted to give you more control over how the view looks and allow the view to be configured to fit your needs.
To those ends, here is the default look of the new Wavefront Occupancy UI in RGP 2.0:
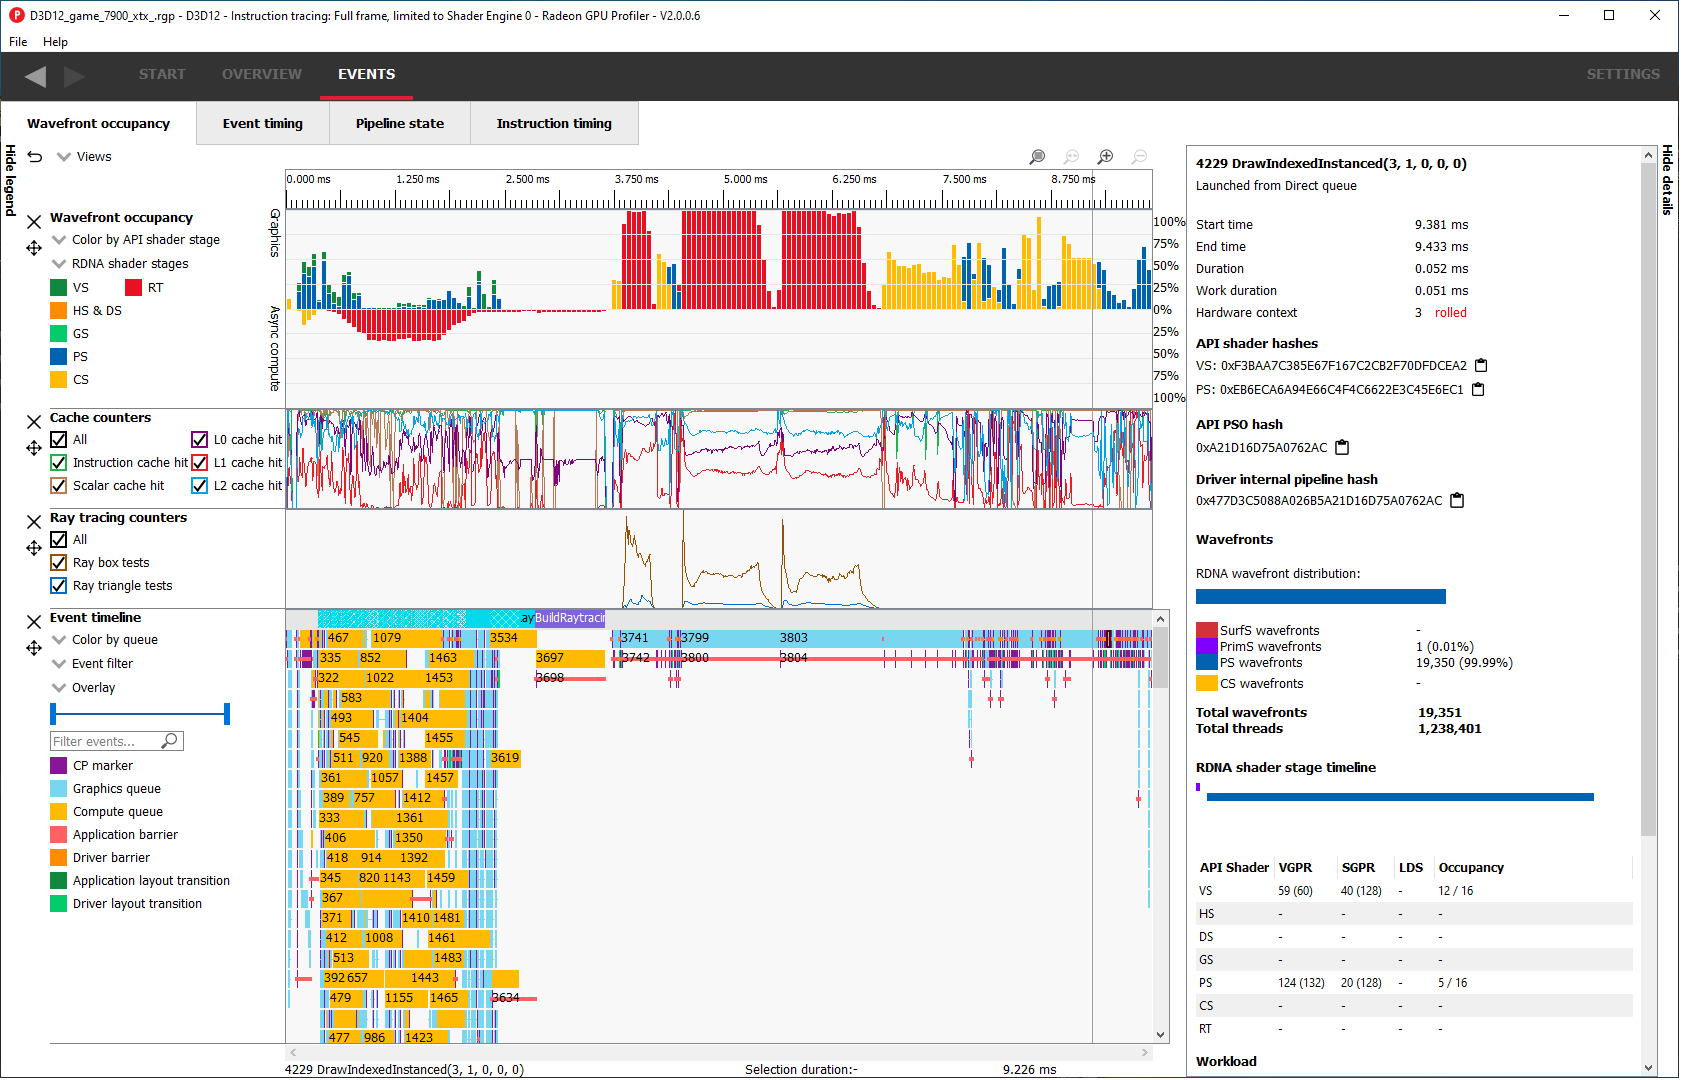
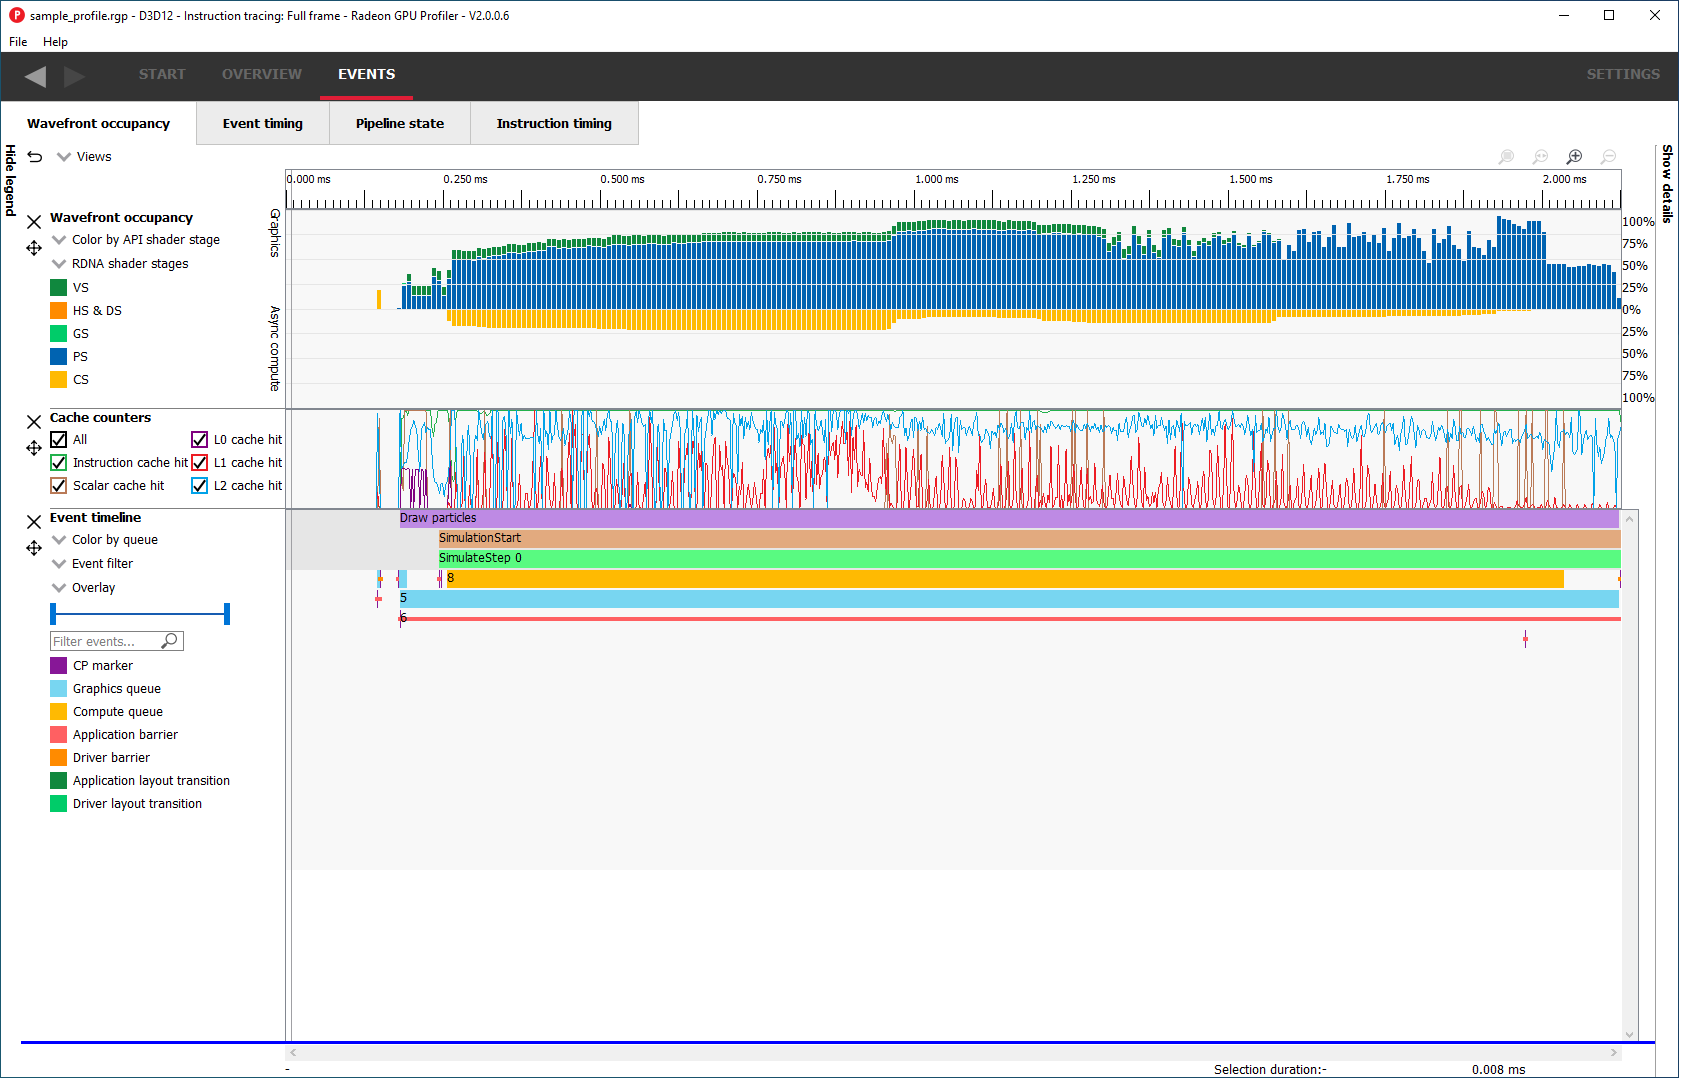
The first thing you might notice is that the combo boxes and legends for each row have been moved from above and below the row to the left side of the row. This allows us to maximize vertical screen space in this view. In addition, the entire legend view on the left can be hidden. Here is what the view looks like when this side panel is hidden:
As you can see, we can now maximize the screen real estate used for the actual profiling data.
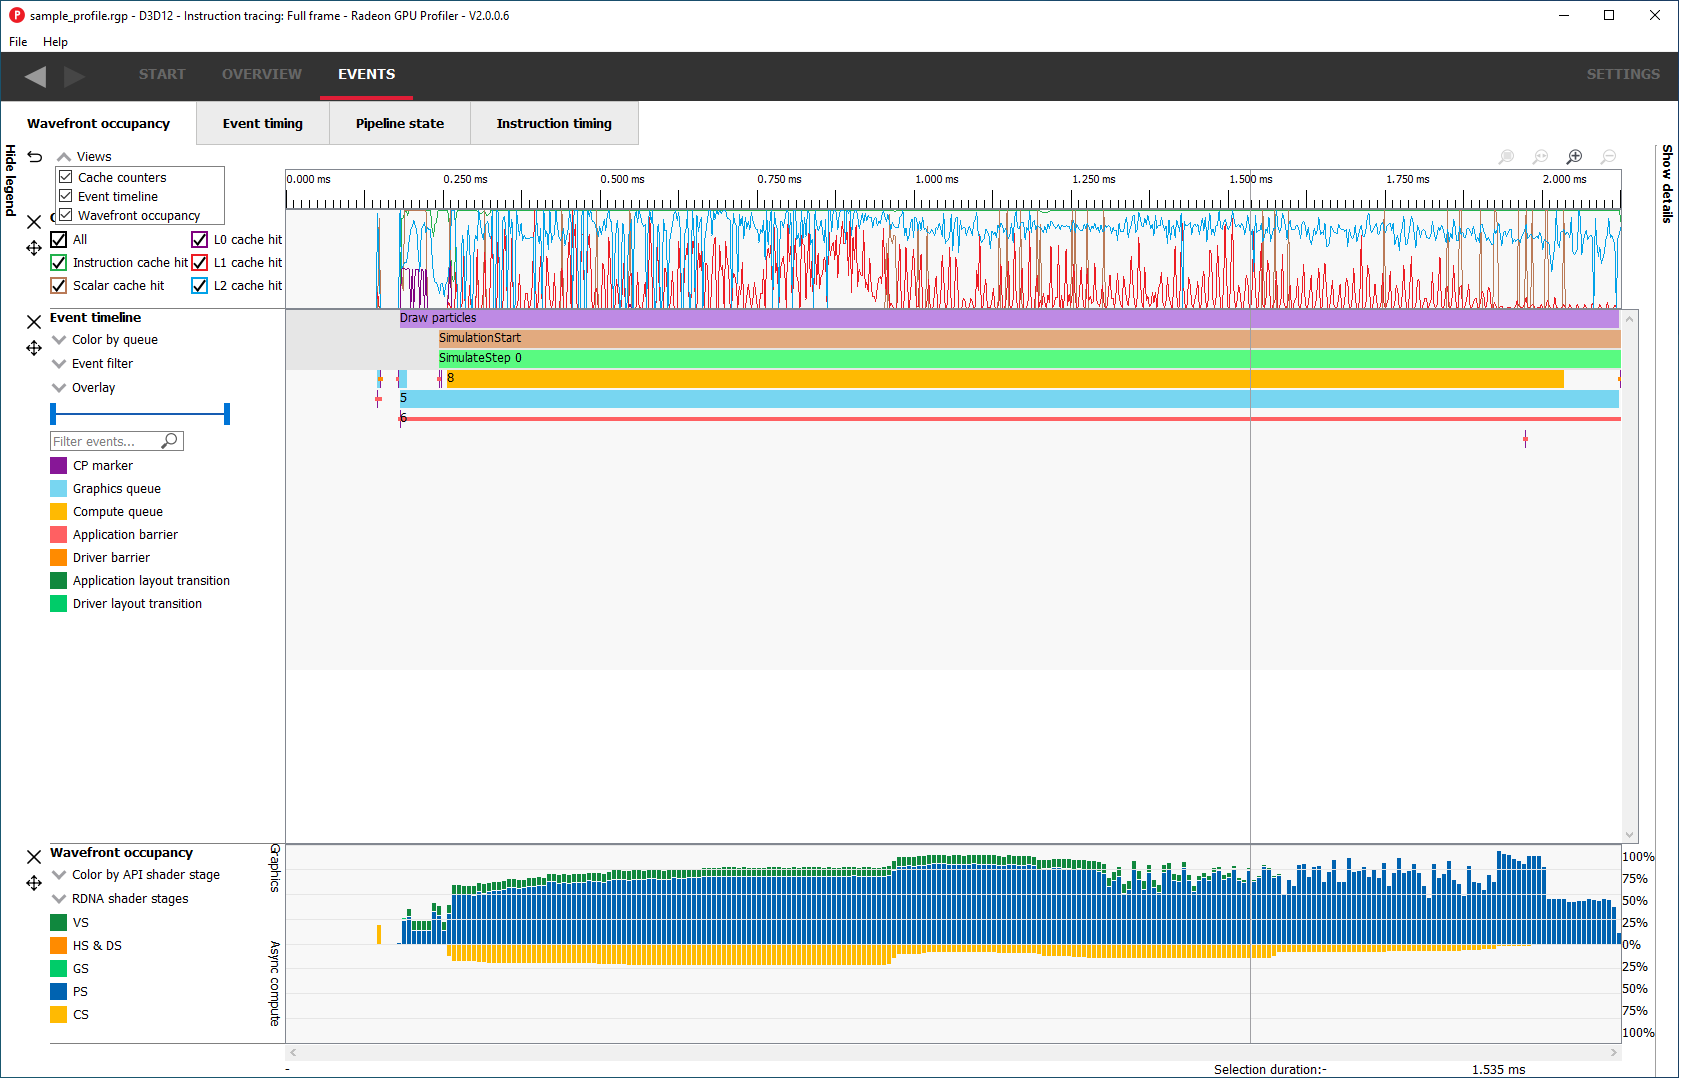
In addition, you can customize the layout of the Wavefront Occupancy pane by either hiding or rearranging the individual rows that make up the view. An individual row can be hidden by clicking the X button on the left side of the row. So if you decide you want to focus solely on the Wavefront and Event timing data, you can hide all of the Counter rows so that they don’t clutter your view. Note, however, that you cannot hide all views — if only a single view is visible, its Close button will be disabled, preventing you from hiding the last visible view.
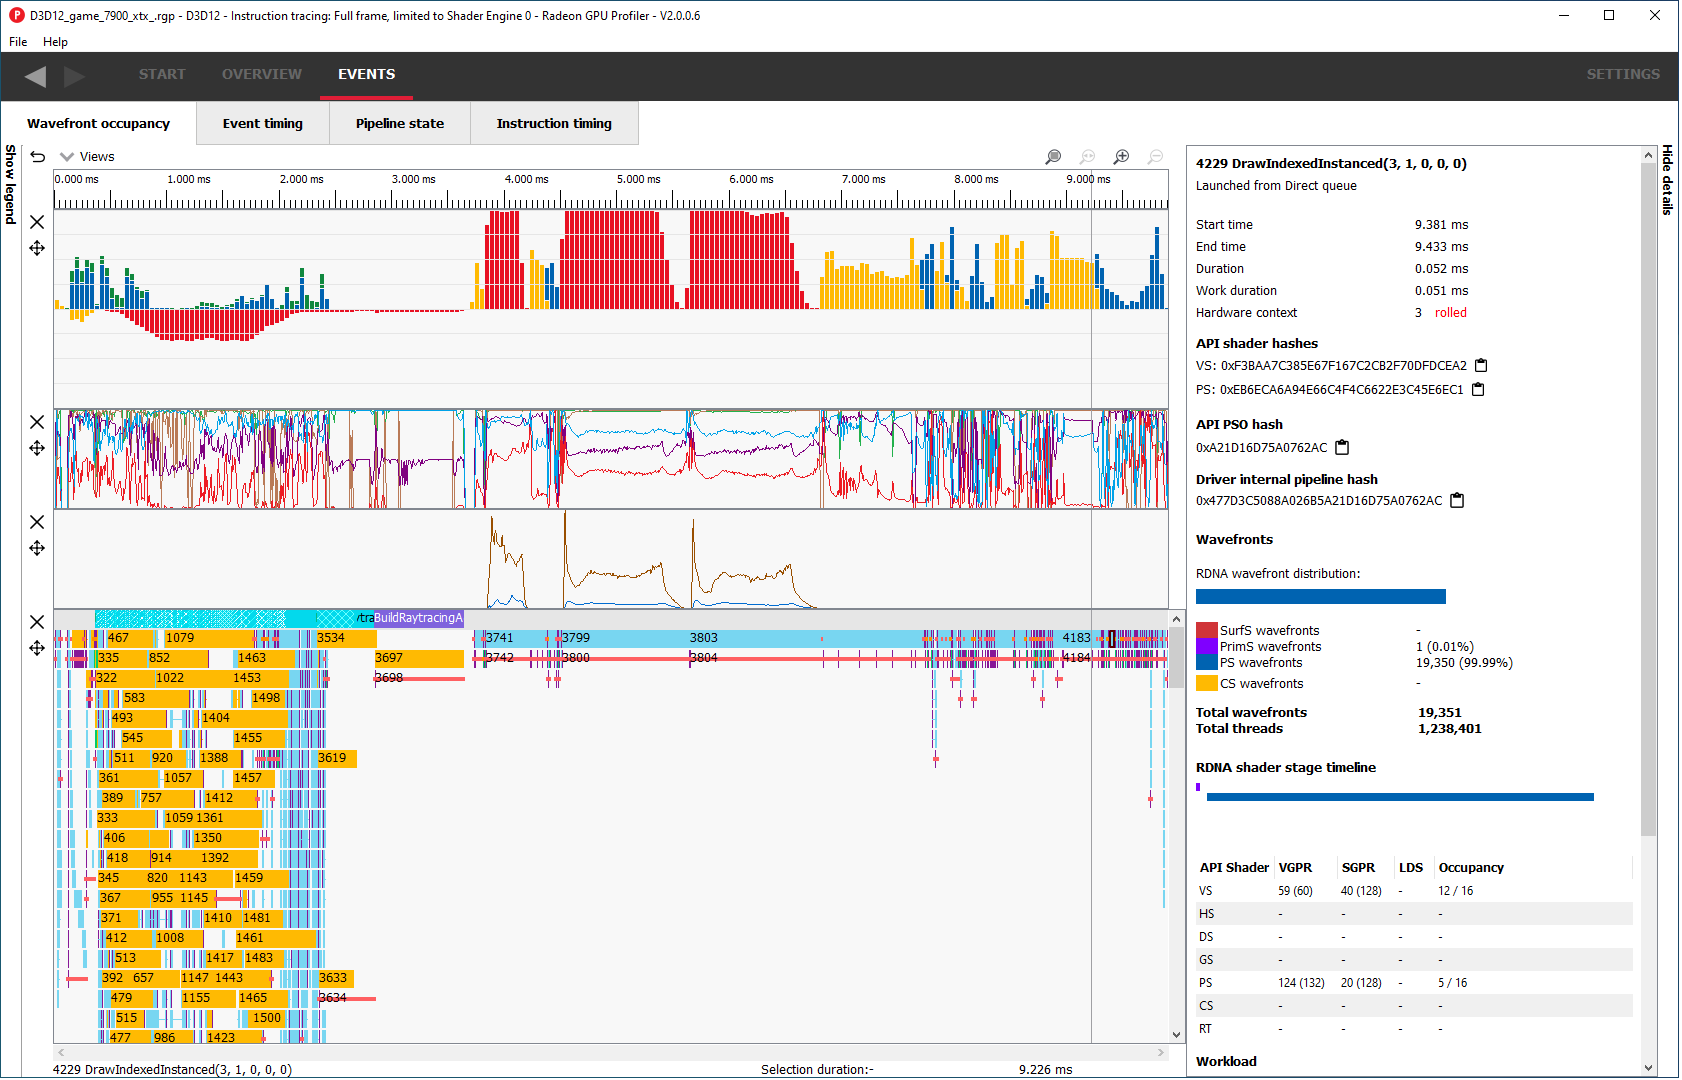
Once a view has been hidden, it can be reshown by using the Views combo box at the top of the view:
This combo box can also be used to hide one or more views. Similar to clicking the close button to the left of each view, you can also uncheck a view in the combo box to hide it.
As mentioned, individual rows can also be reordered. This is done using drag and drop. Simply hover the mouse over the drag button to the left of the view. When you do this, a dashed blue line rectangle will highlight the view that you are about to move.
If you then click the left mouse button, you can drag the selected row to a new position within the view. As you are dragging, a solid blue line will appear to indicate where the dragged view will be inserted when you let go of the mouse button.
Once you are satisfied with the new location, simply release the mouse button and the view will be inserted at the location indicated.
The user-defined layout will persist across RGP sessions, so if you customize the view and close RGP, the layout will be automatically loaded the next time you open RGP.
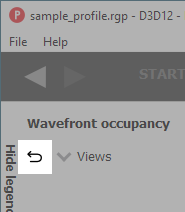
If you ever want to restore the default layout, simply click the Restore to default button that appears next to the Views combo box. This is the button highlighted in the following screenshot:
We have some exciting plans to take further advantage of this new user interface in future RGP releases. Stay tuned here on GPUOpen to learn about these when they become available.
Another new UI feature in RGP 2.0 is the introduction of Dark Mode support. There is now a new Color Theme setting available in the Themes and Colors settings page. You can choose between Light, Dark, or Detect OS settings.
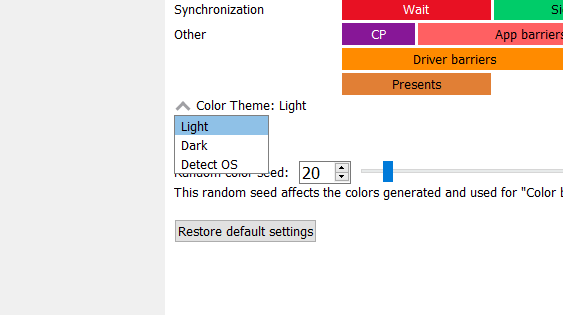
The Light theme is the traditional look and feel that has been used in RGP since version 1.0. The Dark theme is a new Dark mode that uses darker background colors throughout the RGP user interface. The Detect OS setting will cause RGP to follow the theme set in the host operating system, so if the OS is set to use a dark theme, RGP will also use the dark theme. If the OS setting cannot be detected, then RGP will default to using the light theme. When changing RGP’s color theme setting on Windows, you will be prompted to restart RGP. This is because parts of the user interface may not automatically update to the new color theme until after a restart.
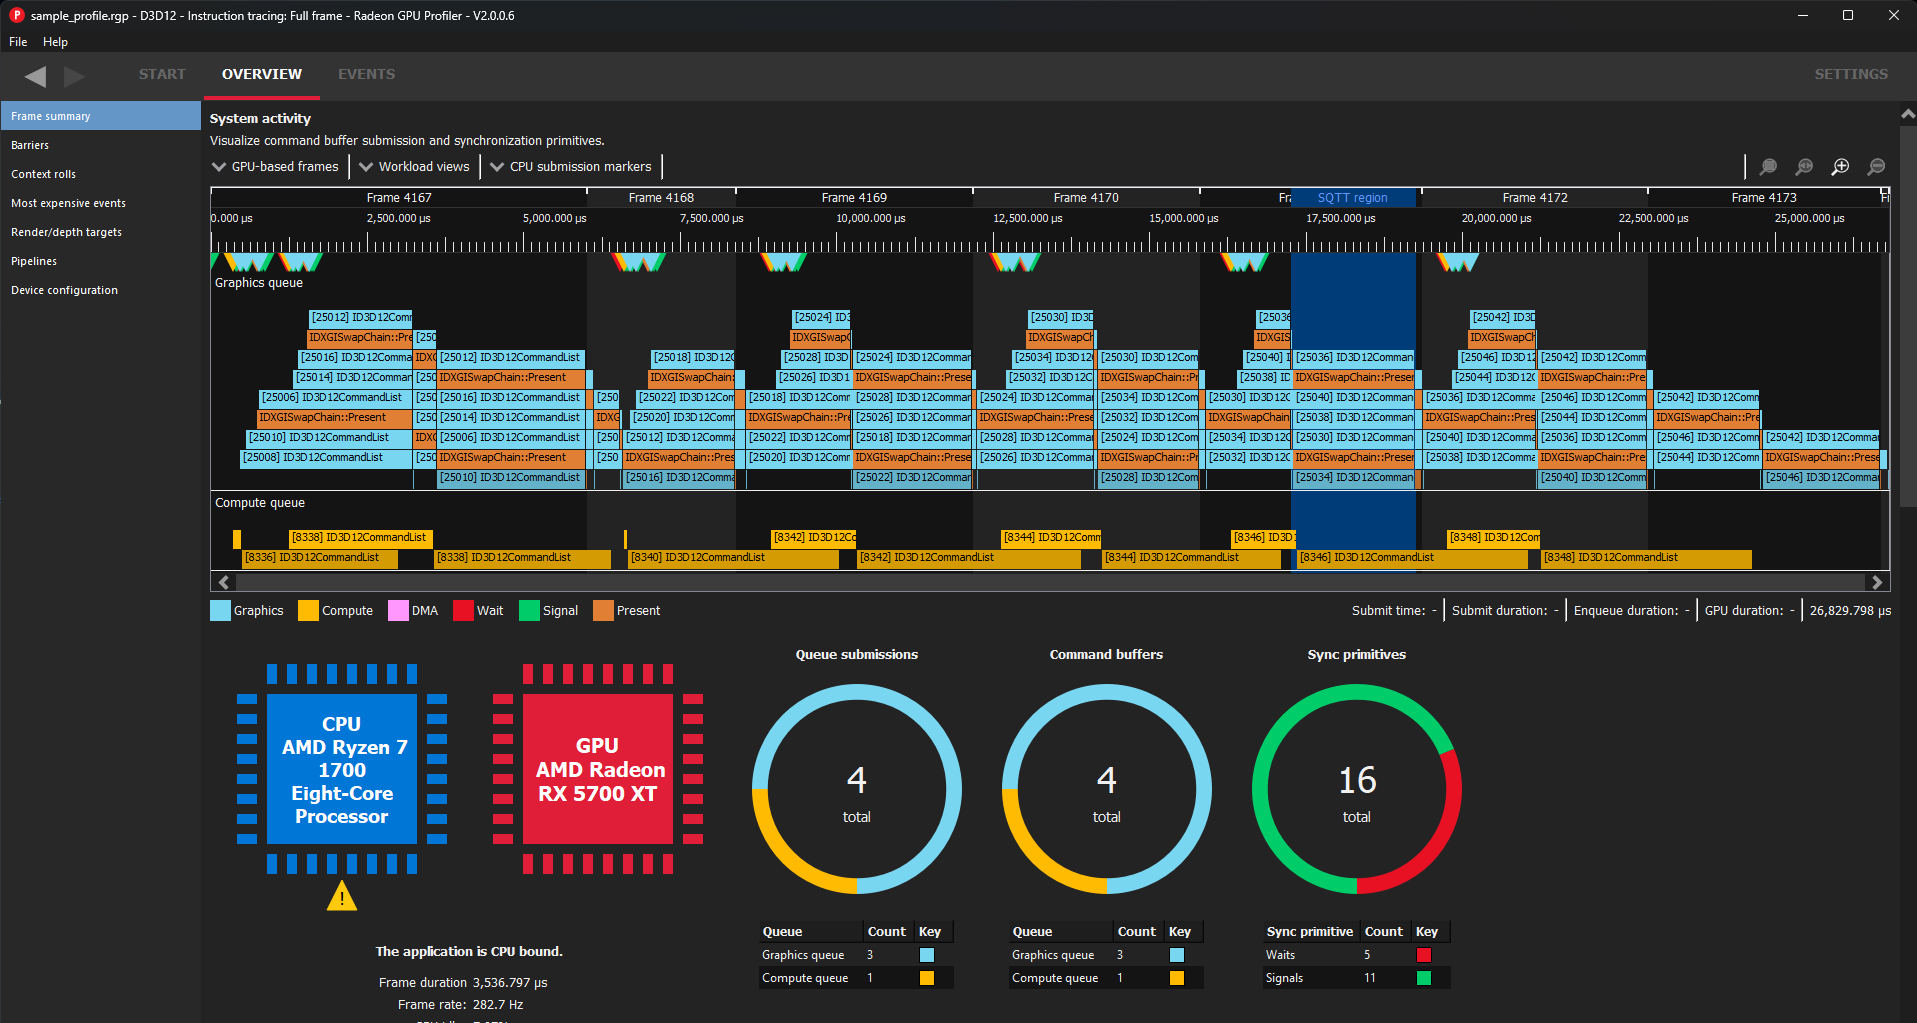
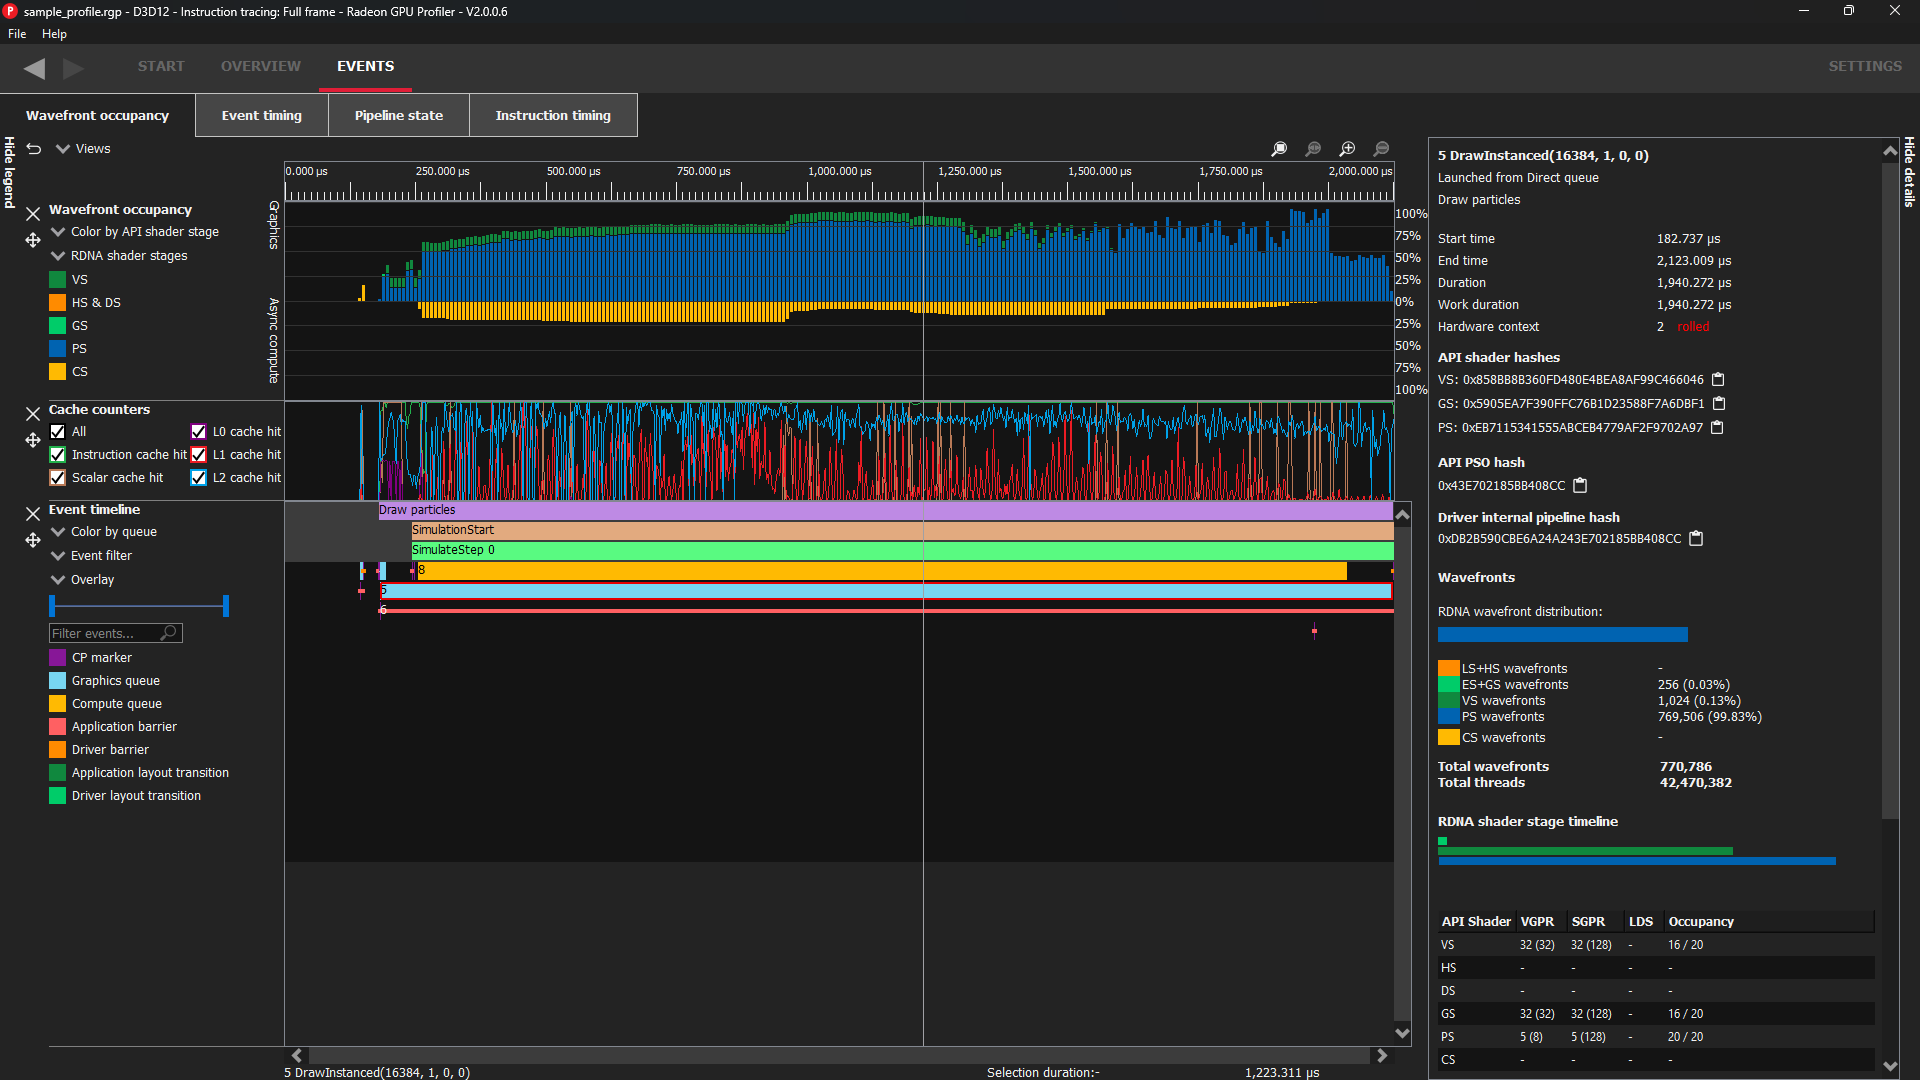
Here are two examples of how RGP will look when using a dark theme:
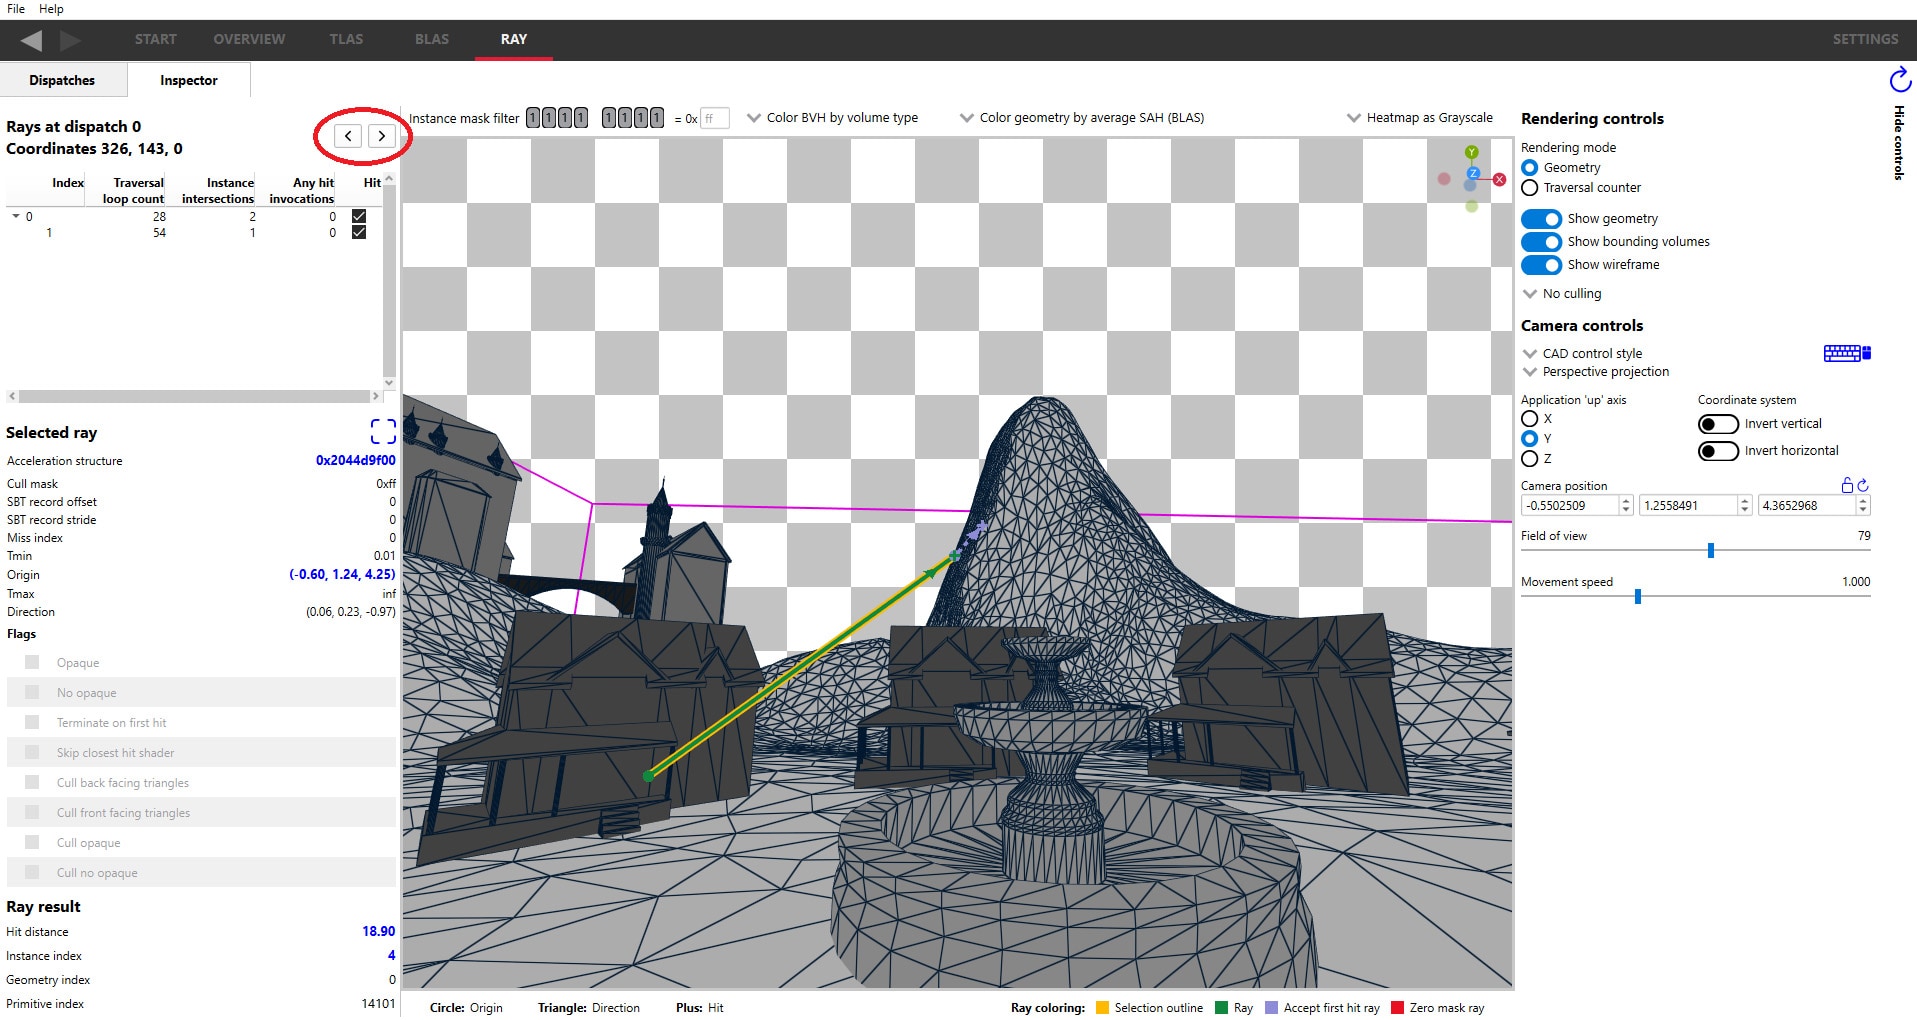
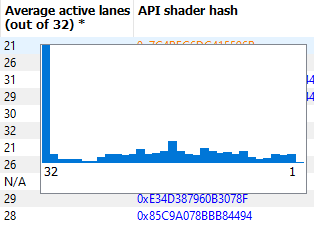
In addition to the above new UI features, we are pleased to talk about an additional feature that provides insight into thread divergence in raytracing pipelines. When this feature is enabled during capture (more on that in a bit), the raytracing shader table will include an extra column to indicate the average number of lanes which are active upon entering the corresponding shader. This new column, with a heading of Average active lanes, can be seen in the following screenshot:
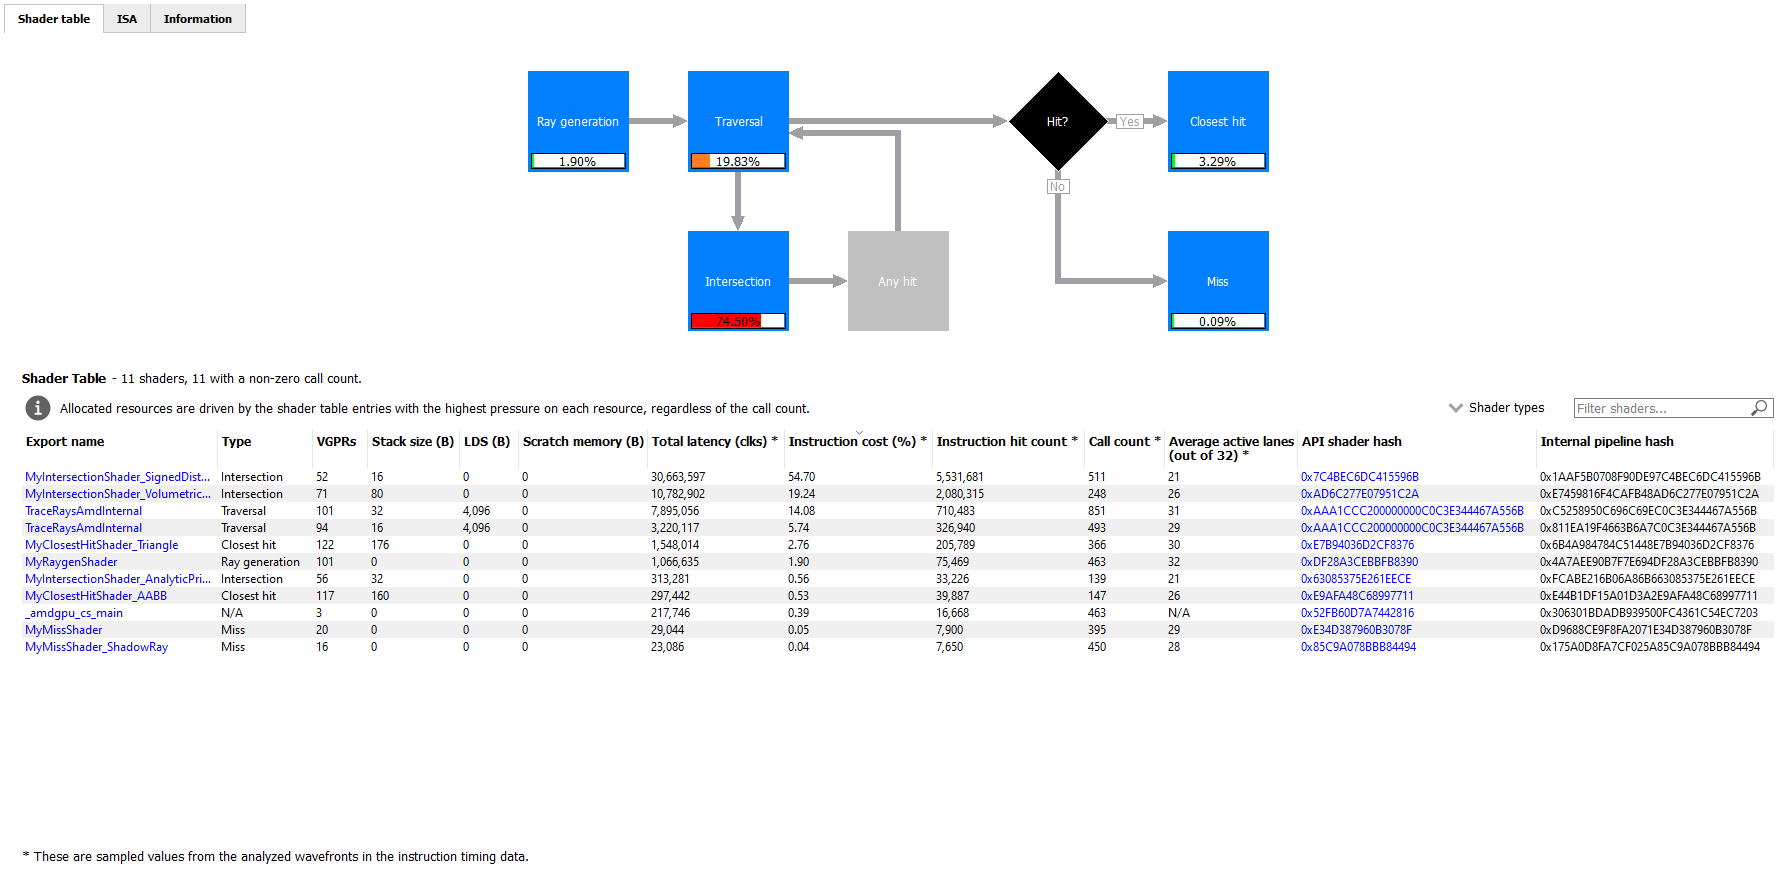
When hovering the mouse over a cell in this column, a tooltip will be displayed to show the distribution of the number of active lanes for individual calls.
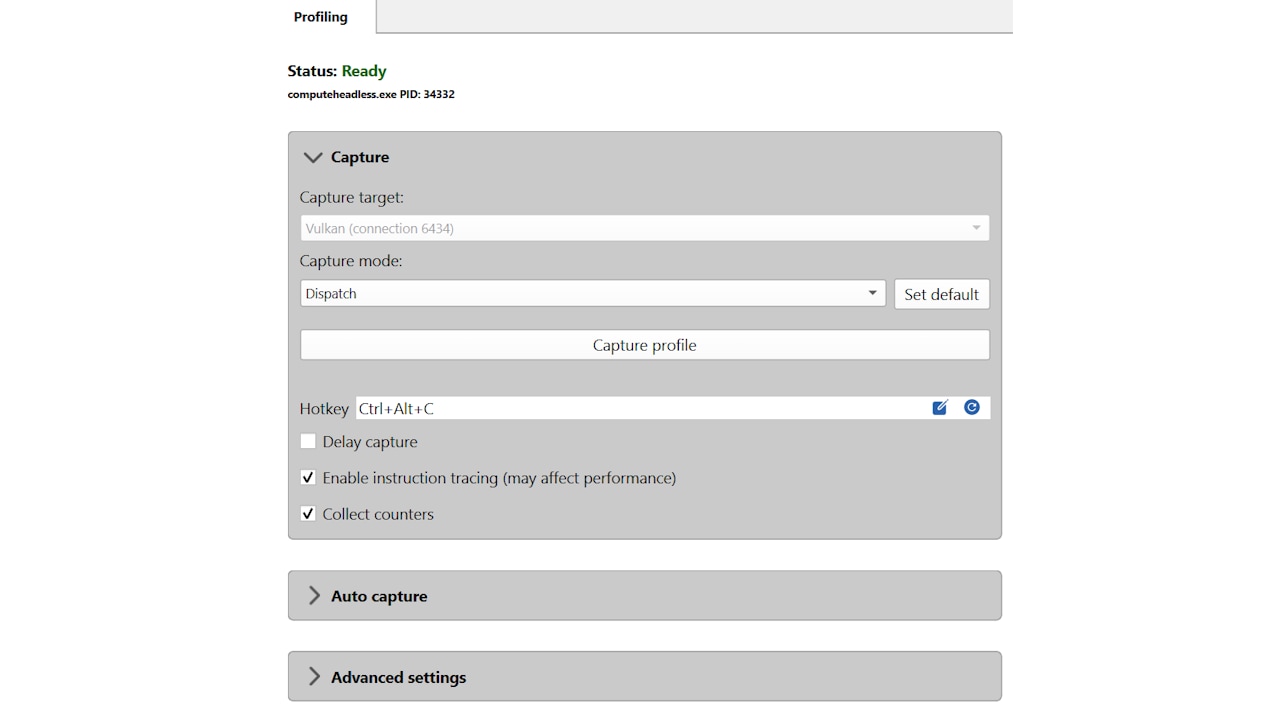
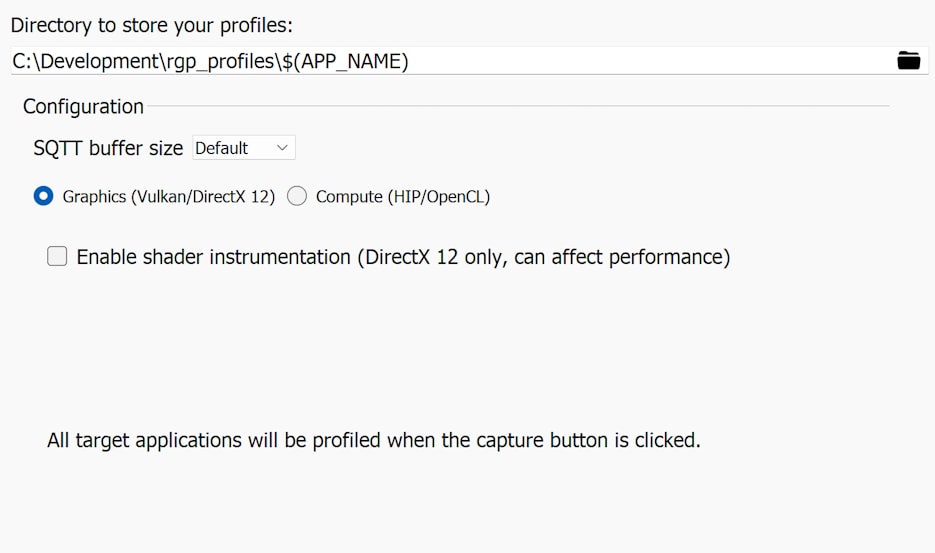
This data is collected by instrumenting the shader functions at runtime to sample the number of active wavefronts. This instrumentation is enabled in the Radeon Developer Panel on the Profiling Workflow view. This checkbox can be seen in the following screenshot. In addition to enabling this checkbox, collection of Instruction tracing data must also be enabled on the Profiling tab in the Applications view.
Three final notes about this feature:
We also have a new feature available to HIP developers. Back in the RGP 1.11 release, we added support for the Call targets visualization in the Instruction timing pane for ray tracing pipelines. You can read more about that support here. In this release, we are extending this feature to also support HIP kernels that call other functions. When viewing the instruction timing data for such a kernel, the Call targets table in the Instruction timing side panel will be populated any time you select a s_swappc or s_setpc instruction that has a non-zero hit count.

Although rare, we occasionally see profiles which contain a large number of events. So many, in fact, that RGP would refuse to load the profile. In this release, we have removed the limit on the number of events that can be contained in a profile. If you find yourself in a situation where you have captured a frame with a large number of events, you should no longer see an error message when trying to load the profile into RGP. In this release, RGP should be able to properly load a profile even if it has hundreds of thousands of events.
As with all RGP releases, there have been plenty of bug fixes and other smaller enhancements. We invite you to head over to the product page on gpuopen.com and download the latest version to check it out.
We really hope you enjoy this new version of the Radeon GPU Profiler. If you have any feedback on the new User Interface or any other features in RGP, please visit the product page on GitHub and use the Issues list to share your feedback.