Radeon™ Rays
The lightweight accelerated ray intersection library for DirectX®12 and Vulkan®.
It can often be difficult to know where to start when trying to optimize a Unity® project.
Our Unity Performance Guide is here to help with a step-by-step look at the profiling and optimization process which can help you get the best performance out of your Unity game.
Your first step in any optimization journey is profiling. Understanding how your game is currently performing allows you to identify where you need to make changes to boost performance.
When profiling the GPU, you need to decrease the overhead on the CPU-side as much as possible. This can be achieved in a number of steps.
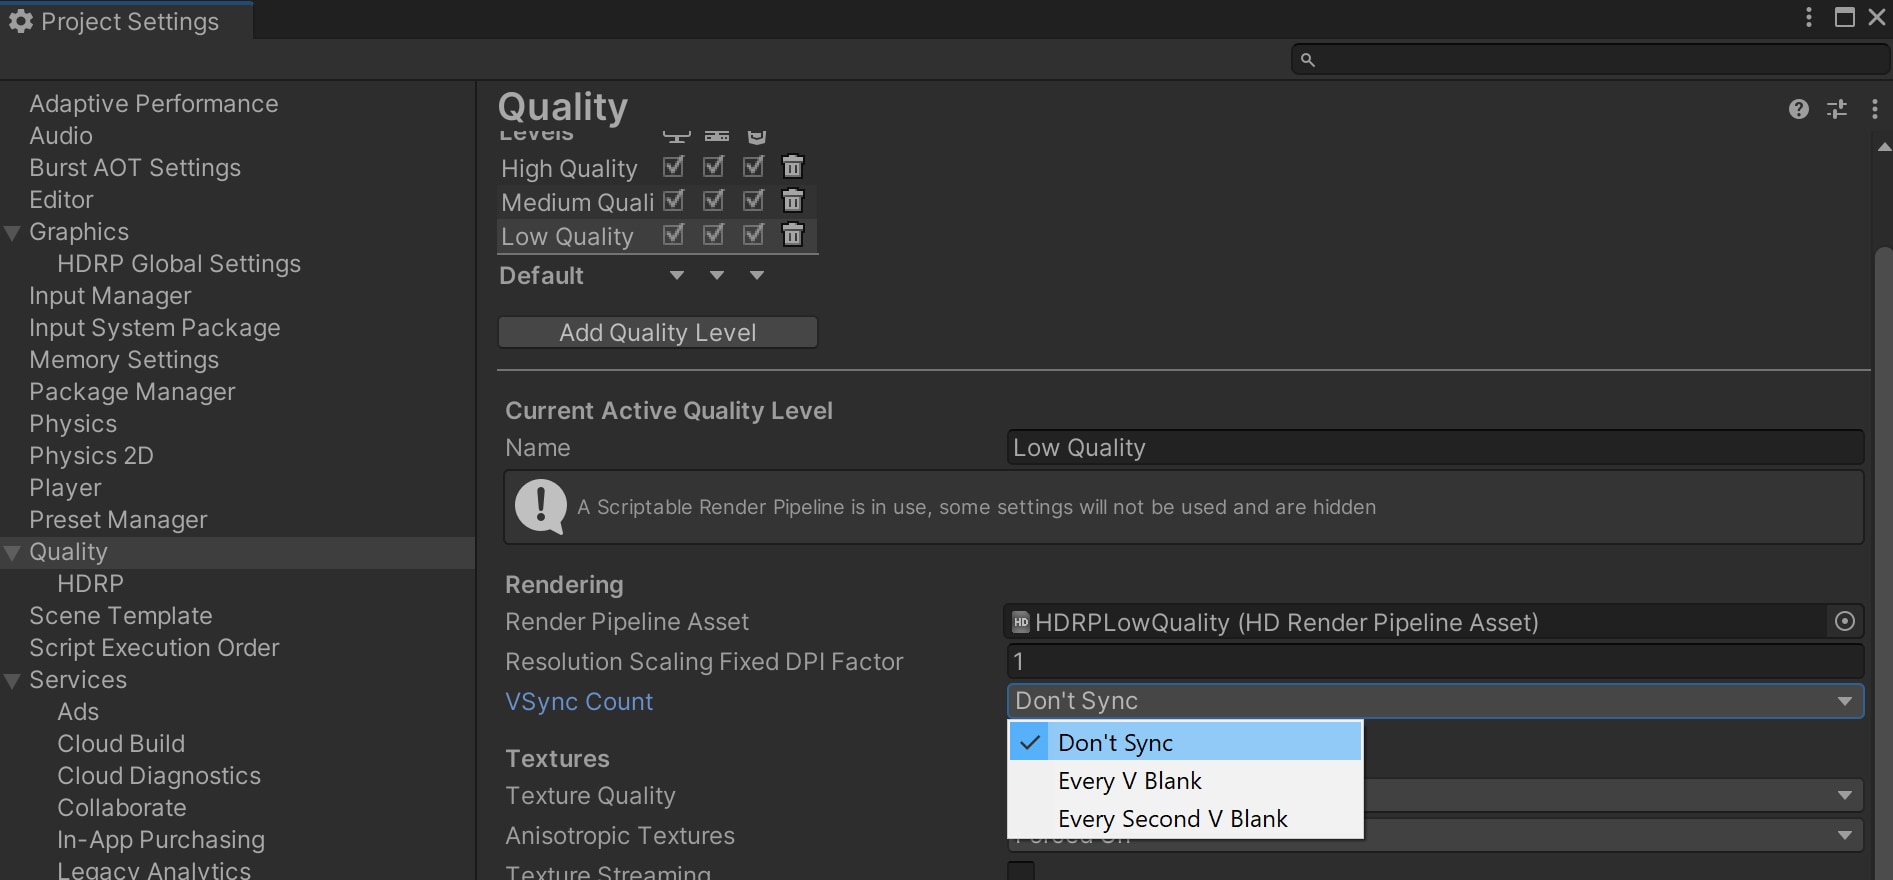
Firstly, you can turn off VSync on platforms other than Mobile or VR by setting vSyncCount to 0. vSyncCount can be changed in your script, QualitySettings.vSyncCount = 0.
Alternatively, you can update vSyncCount in the Project Settings panel.
Next, disable log by adding this -nolog into your input arguments
Finally, instead of muting the Audio Source, you should disable the Audio Source component or disable the GameObject.
This should all reduce the load on the CPU and get you ready for profiling.
The next step is making sure you’ve got the right tools for the job.
AMD provides a large collection of tools to support application development on AMD Radeon GPUs.
The most useful one for our purposes is Radeon GPU Profiler. In addition, the built-in Unity profiler also provides a useful source of data for your investigation.
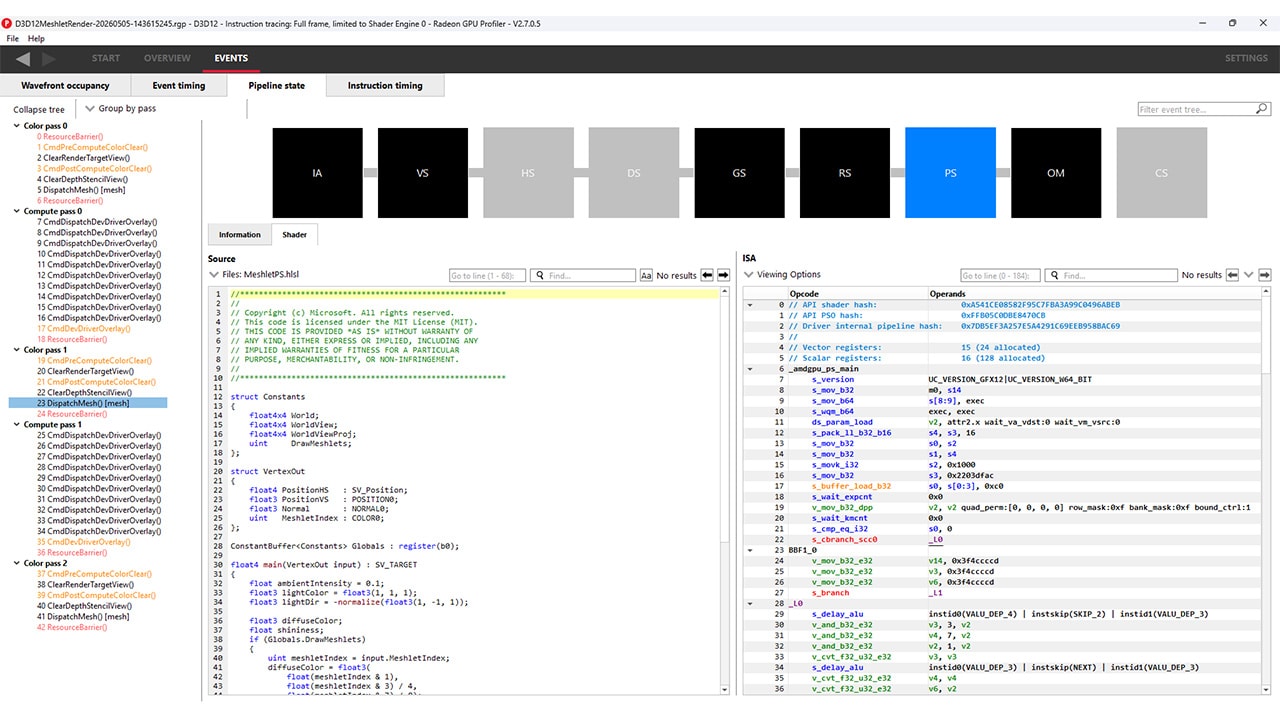
Radeon™ GPU Profiler (RGP) is a profiling tool for Radeon GPUs. It provides rich information about the GPU which allows the developer to gain a greater insight into their application and have more ideas about where to optimize. You can find more information about RGP on the RGP product page. Note, RGP only supports DirectX® 12 and Vulkan.
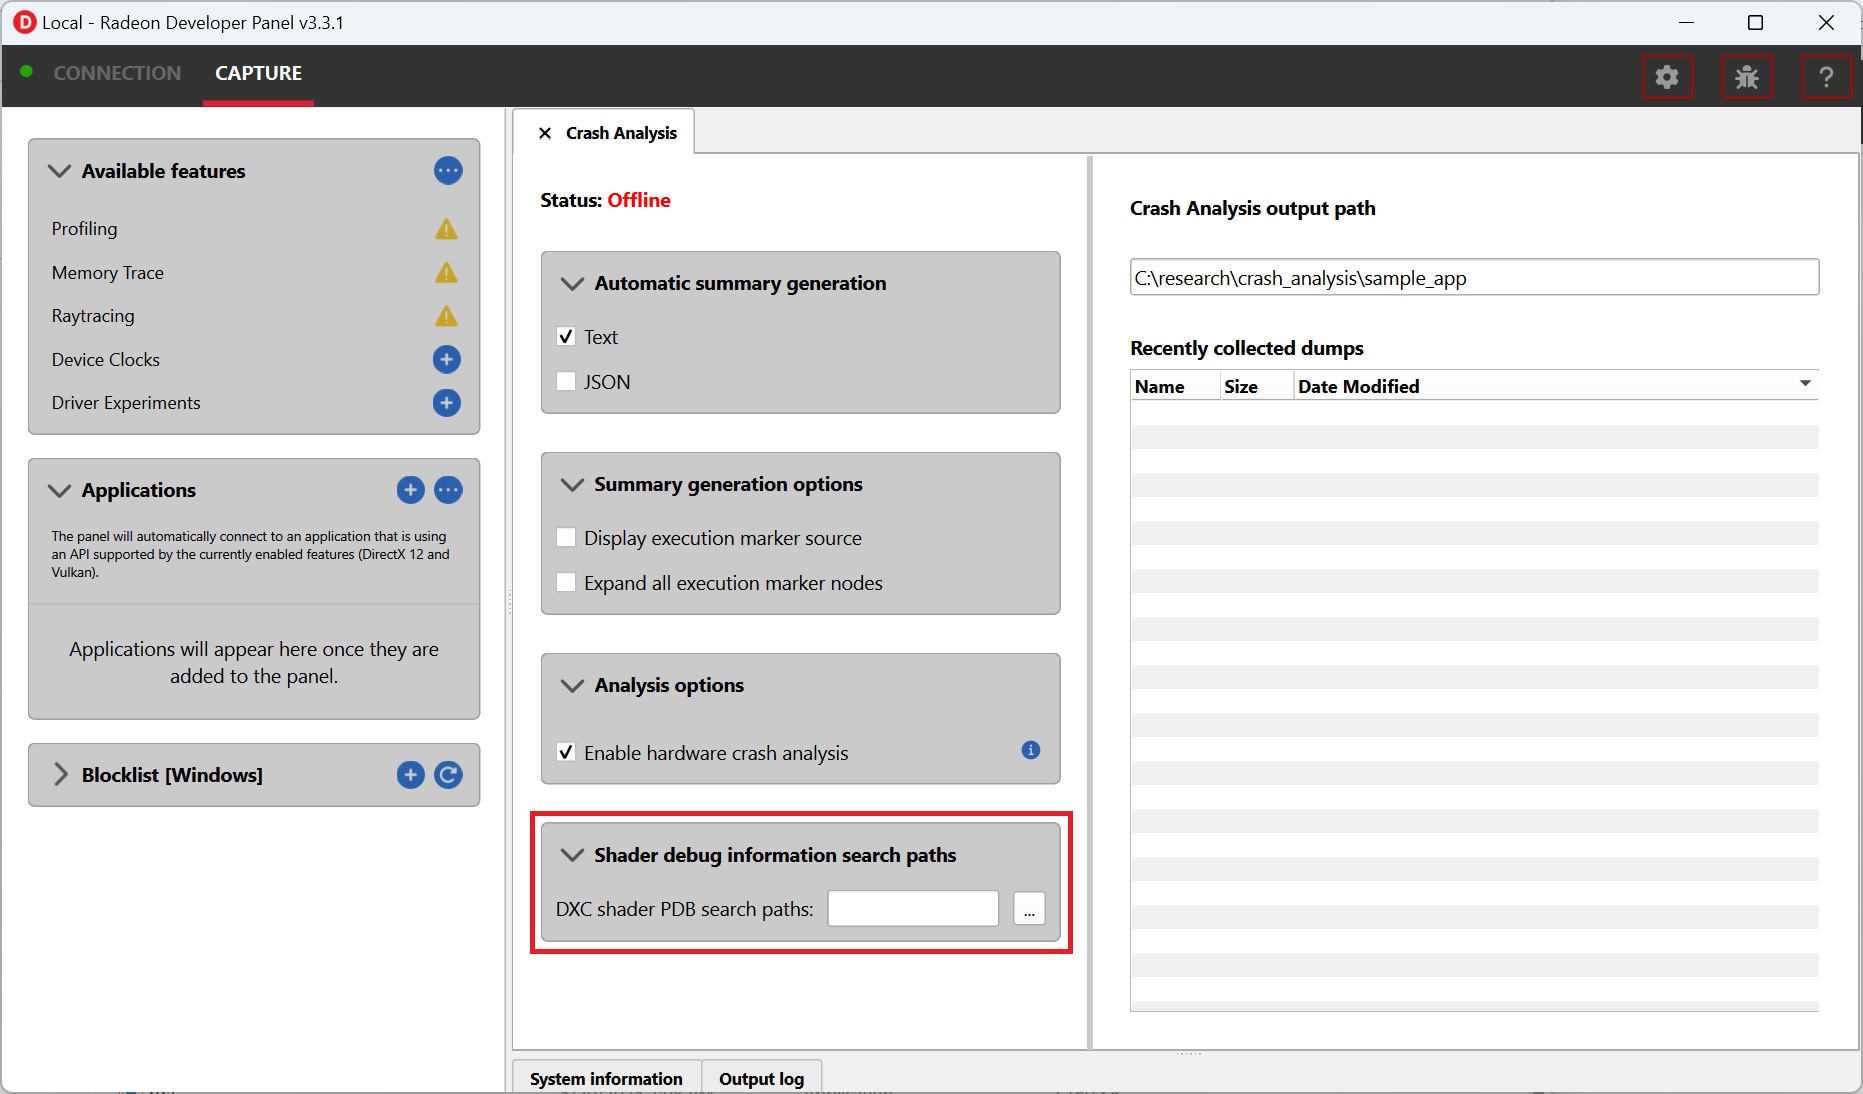
You can create a capture of your game using RGP in a few simple steps.
RadeonDeveloperPanel.exe and connect to the local Radeon Developer Service.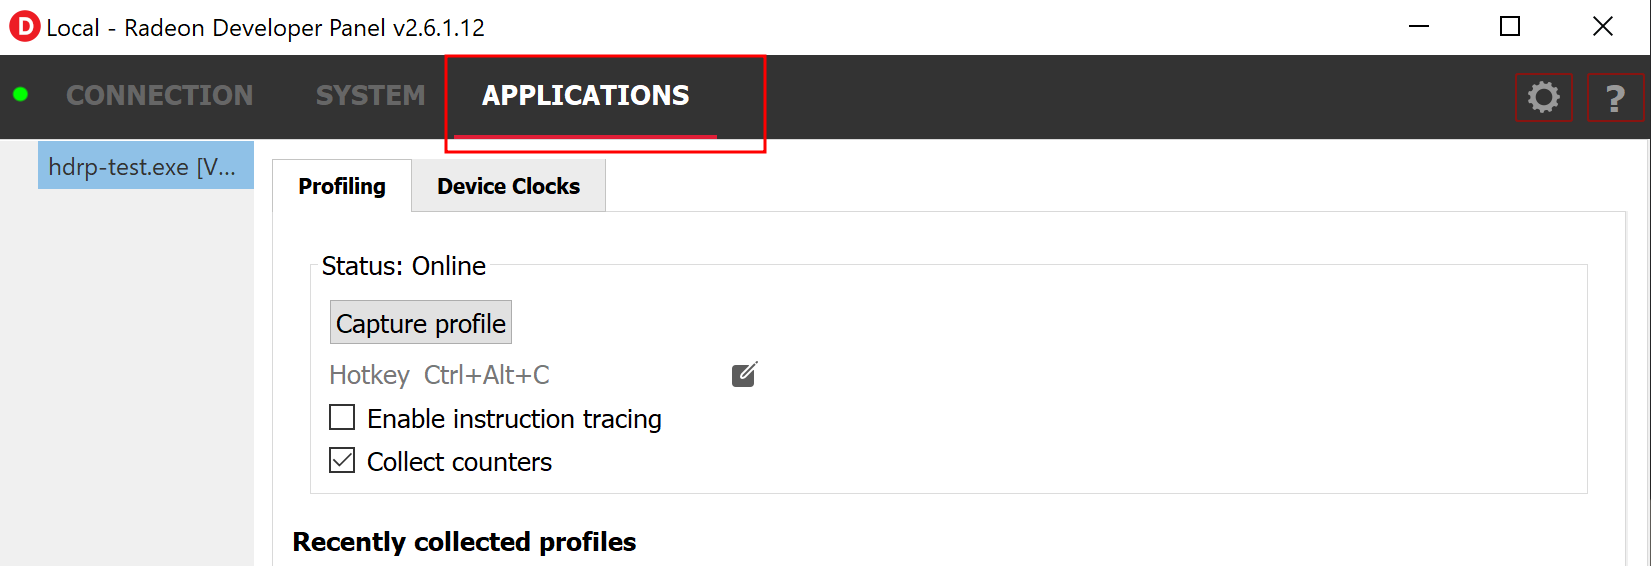
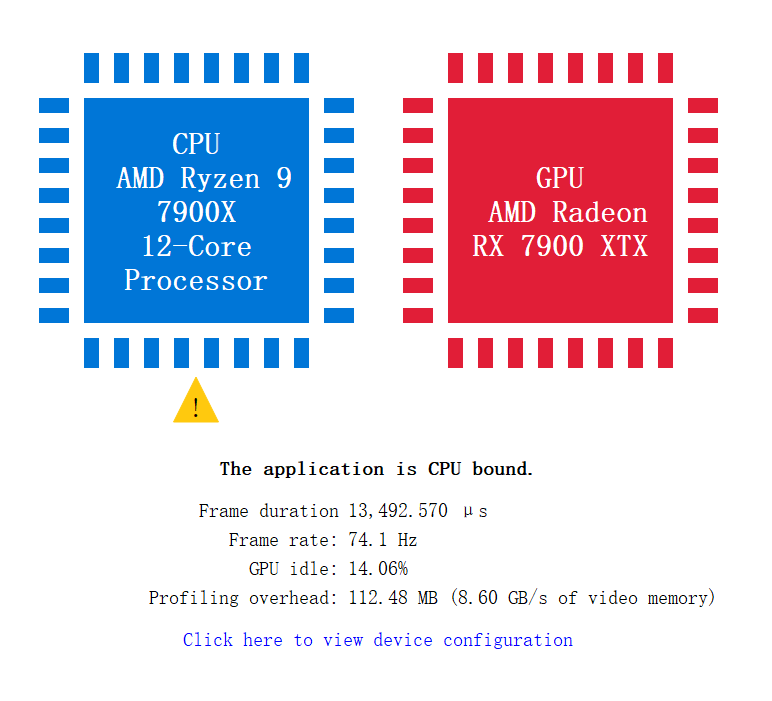
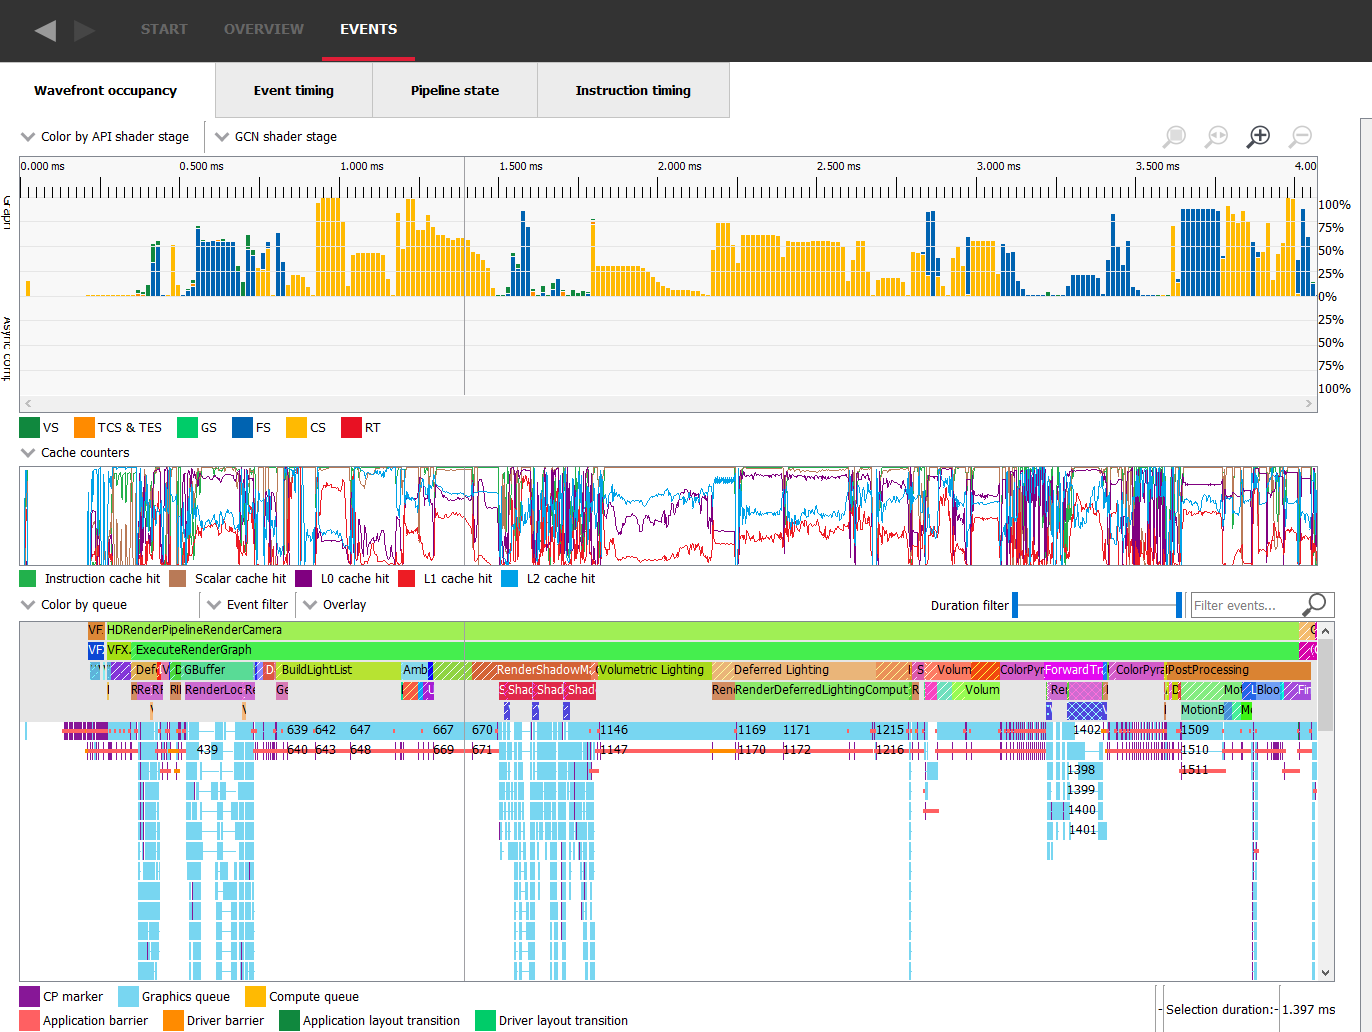
Now that you’ve created a capture in RGP, it’s time to analyze the profiling data for clues.
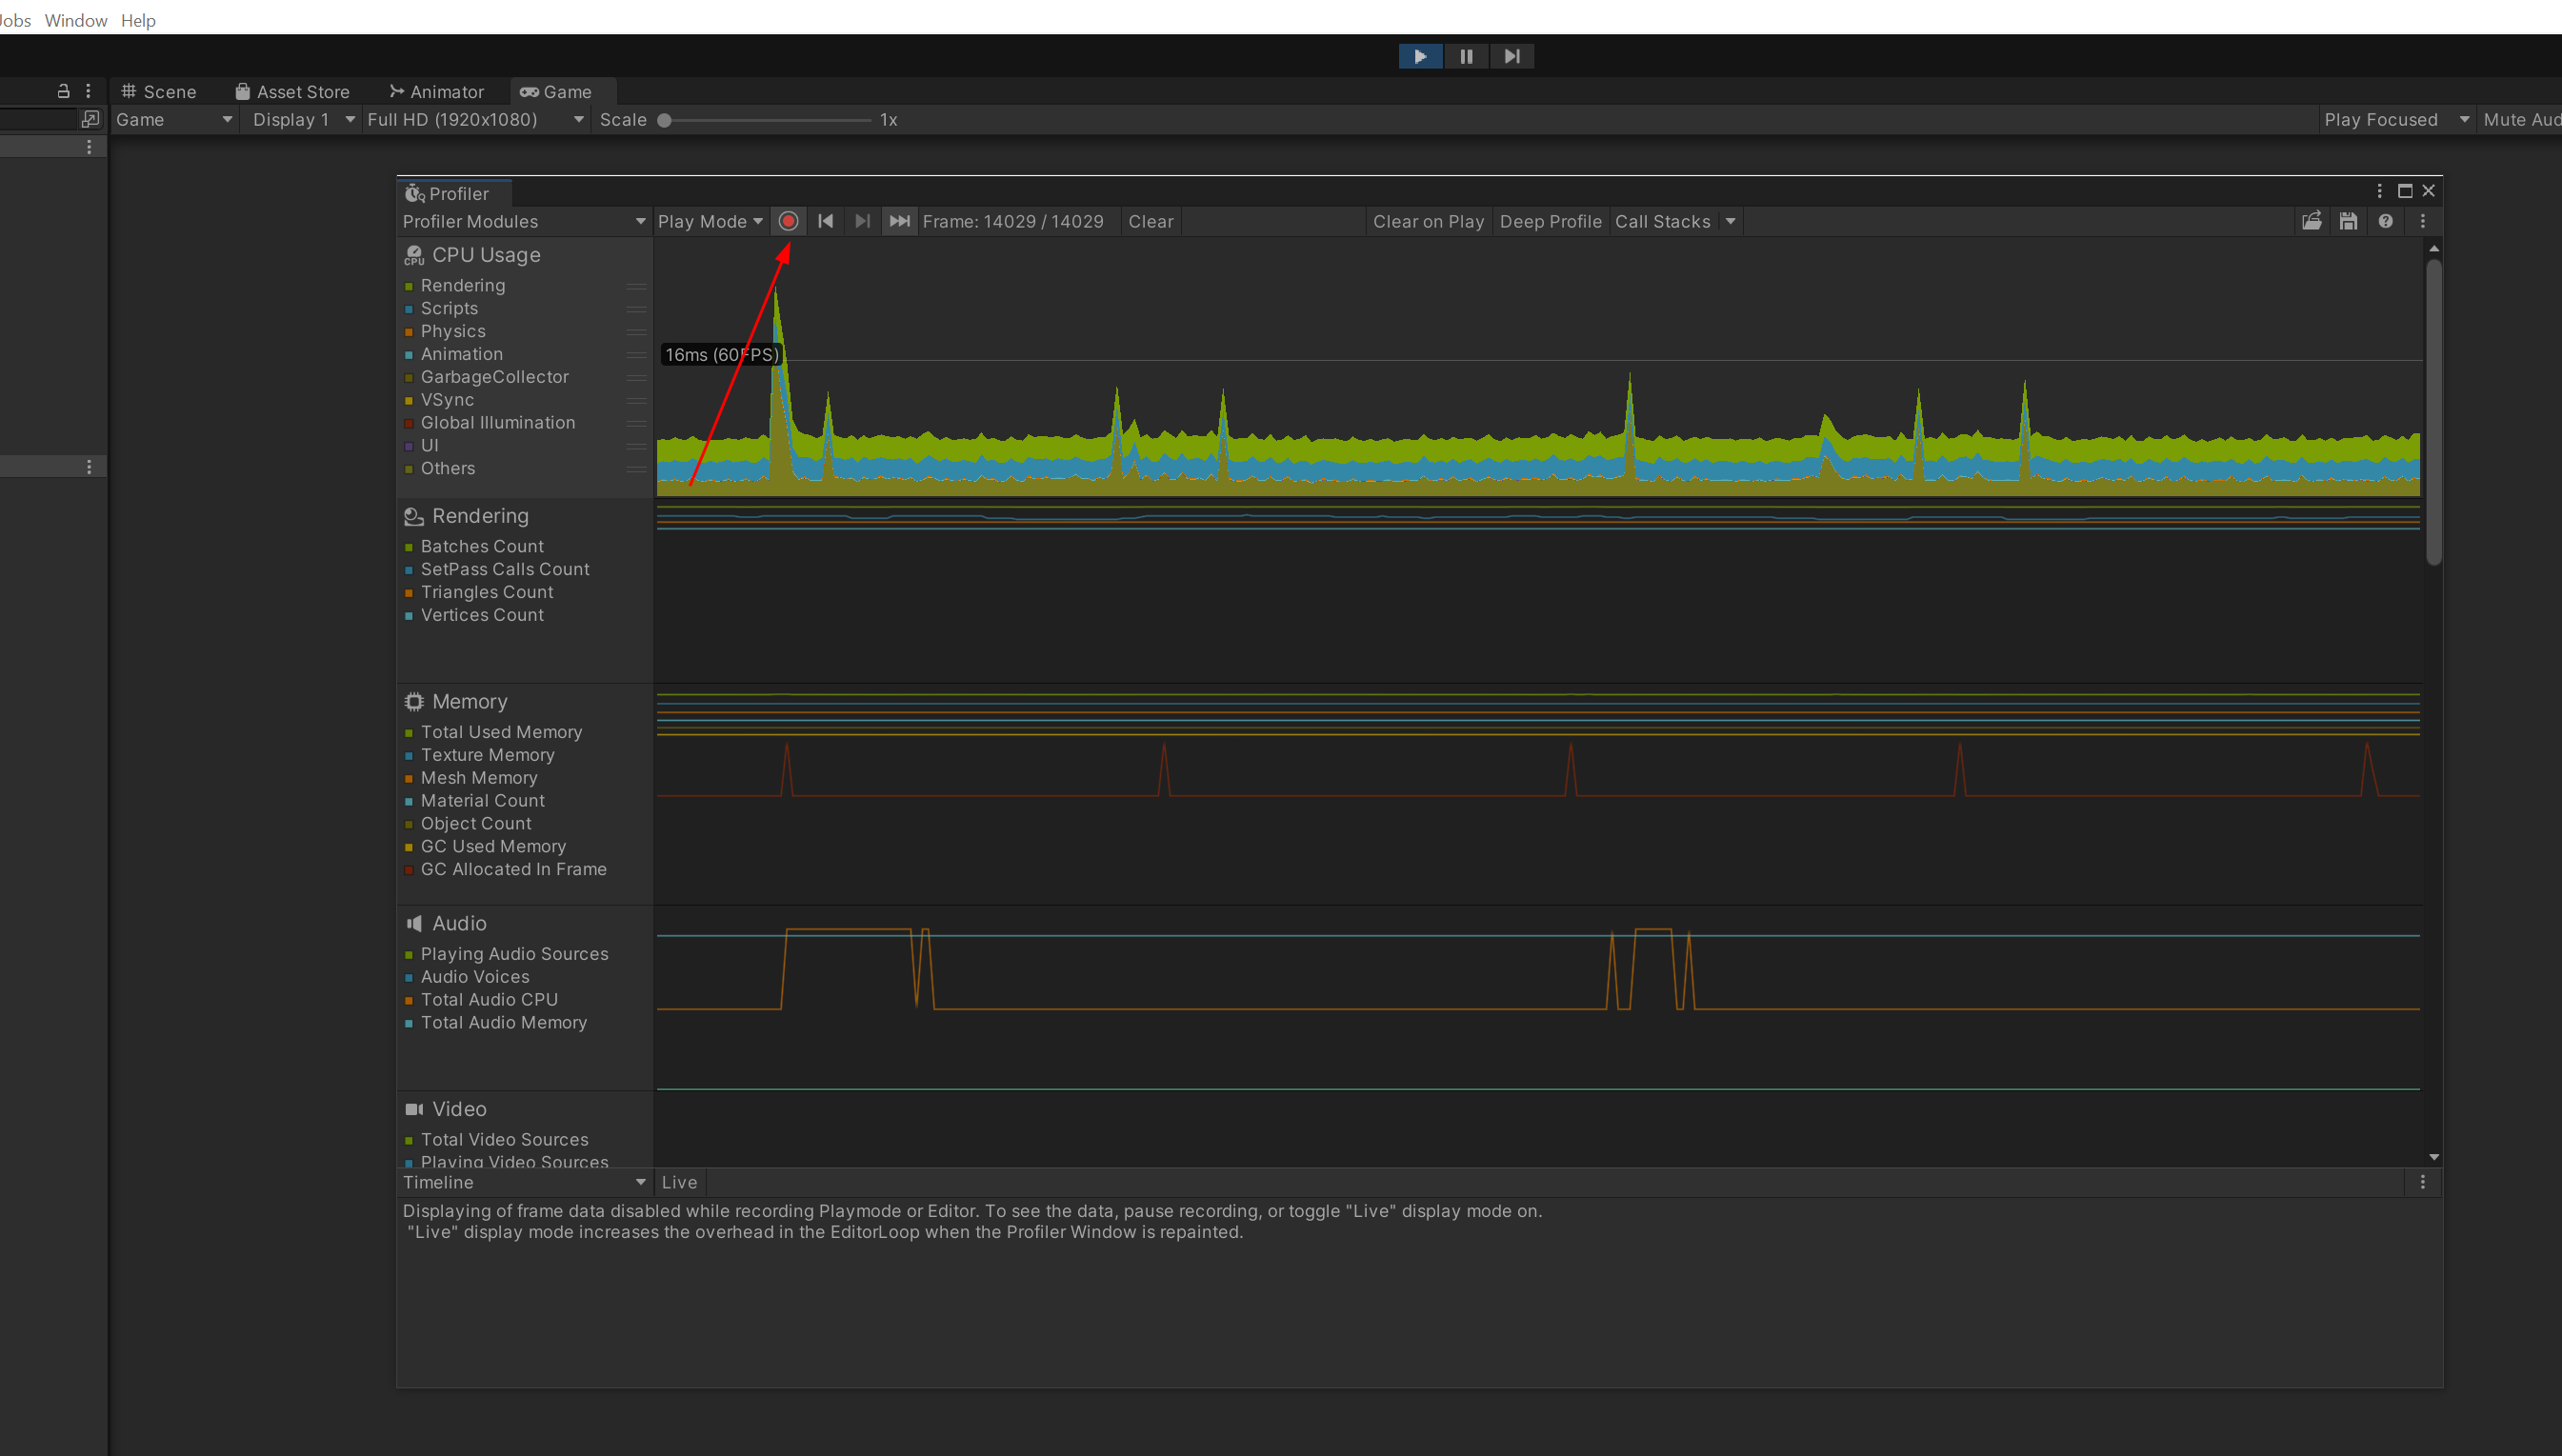
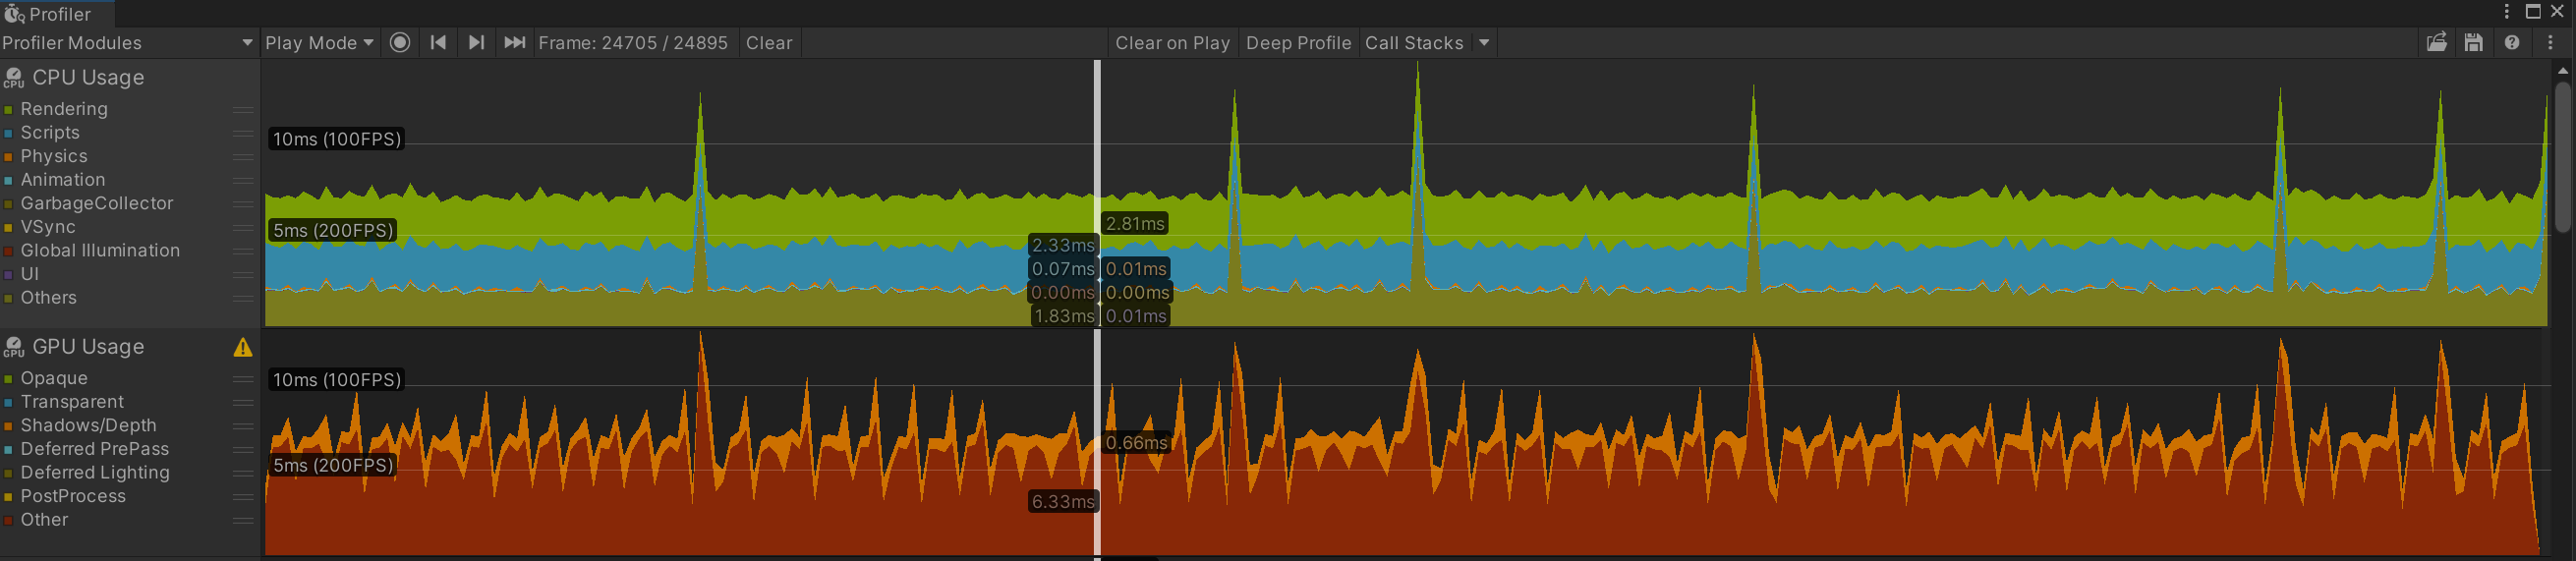
In addition to RGP, you can also use Unity’s built-in profiler to gather more data.
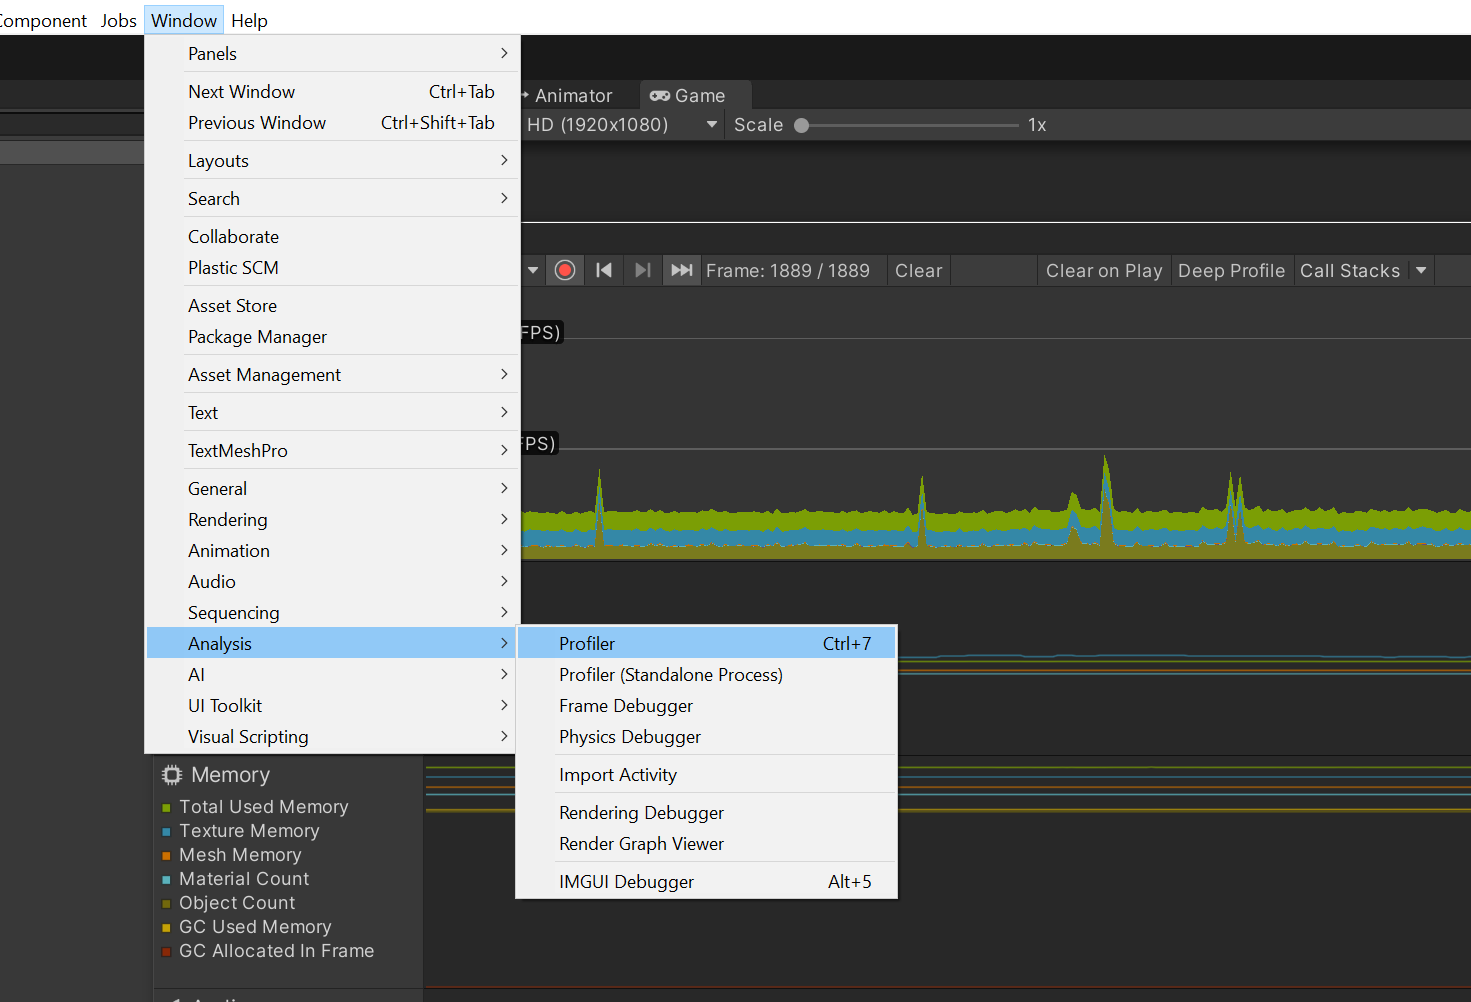
The Unity profiler can be activated using the following steps.
profiler from Window->Analysis->Profiler.
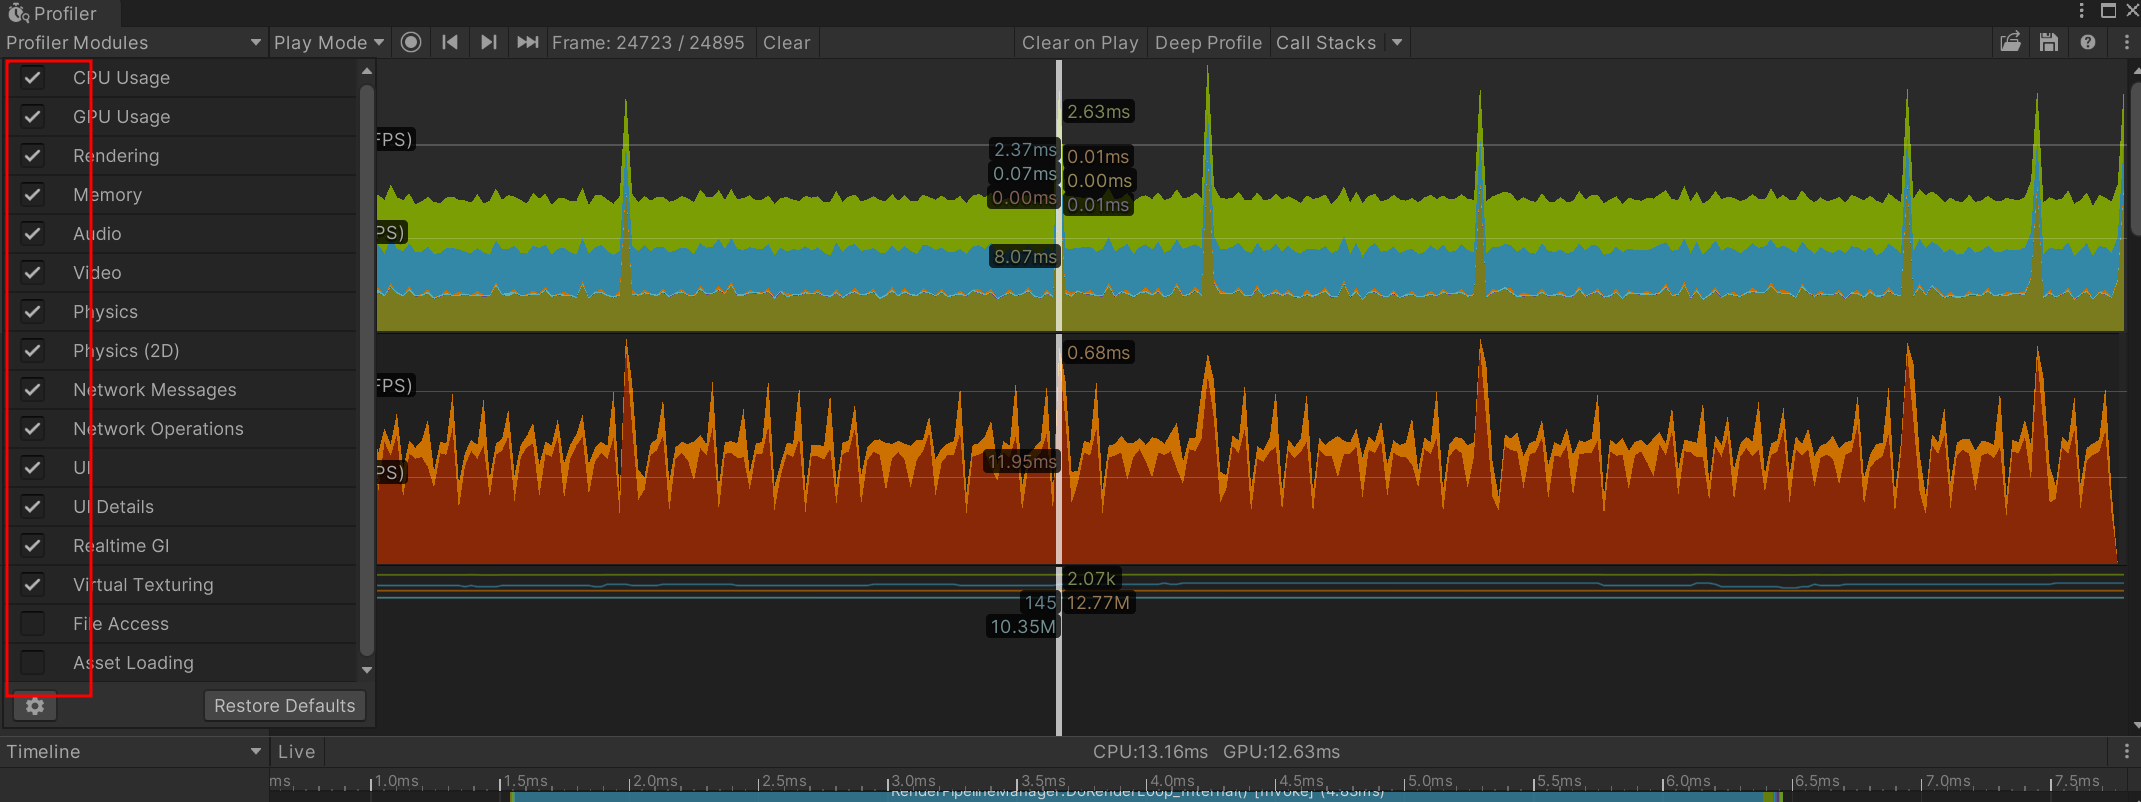
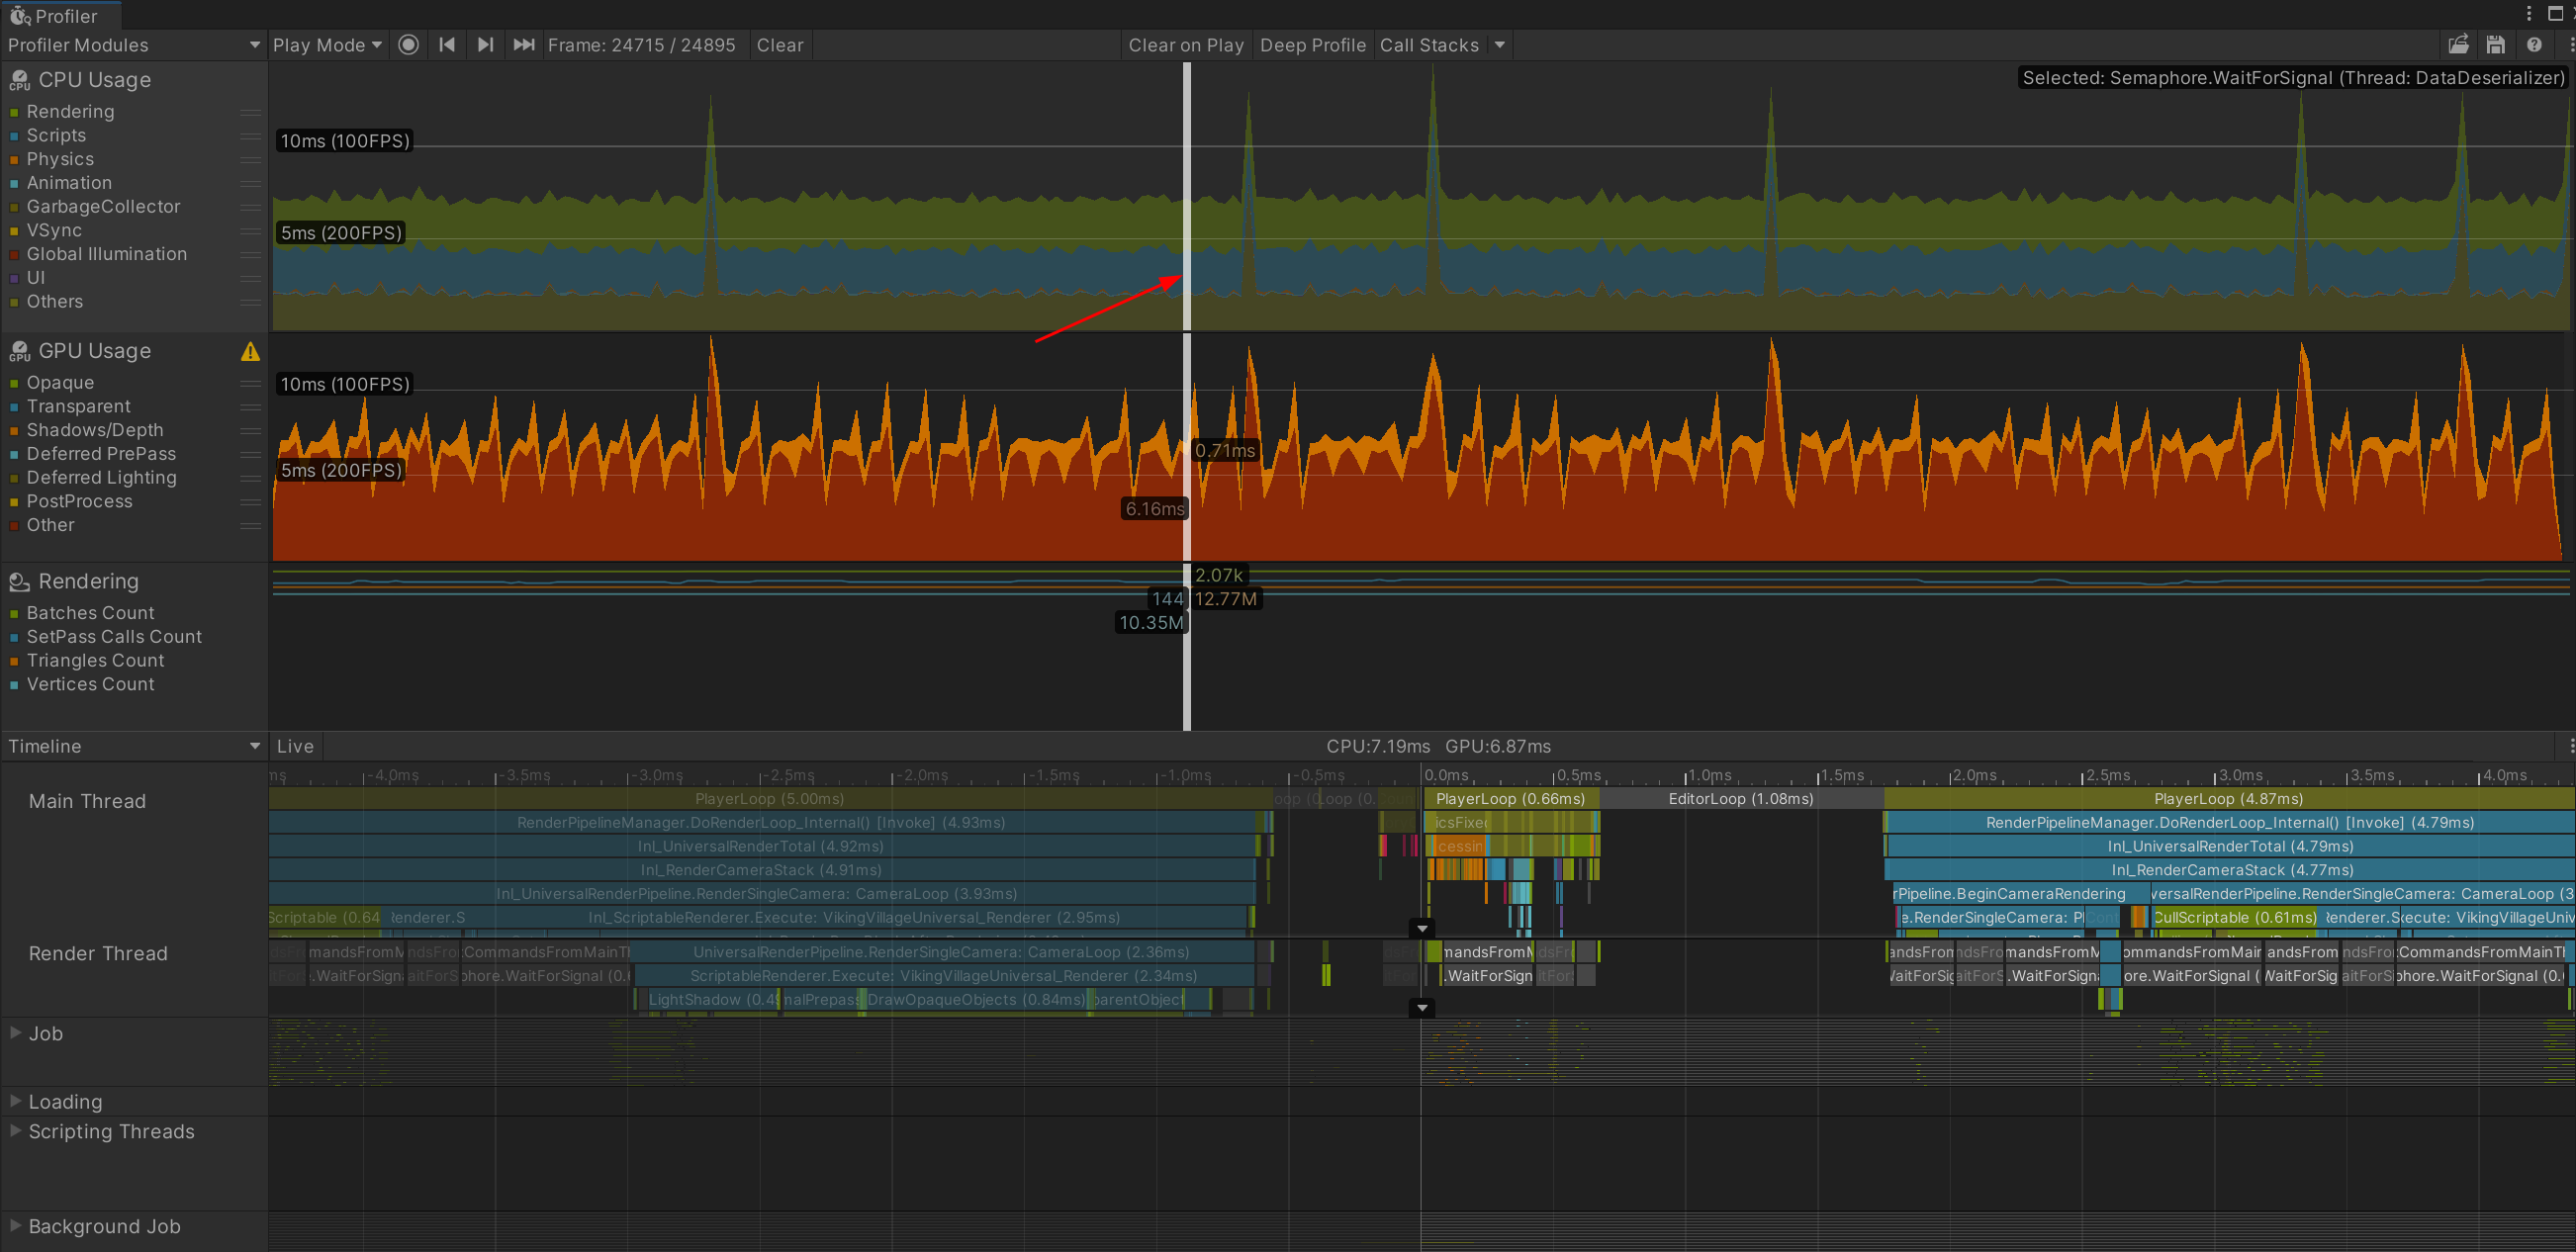
As with RGP, you now need to investigate your profiling data to determine how your game performance is limited.

Below is a screenshot of the Timeline view.
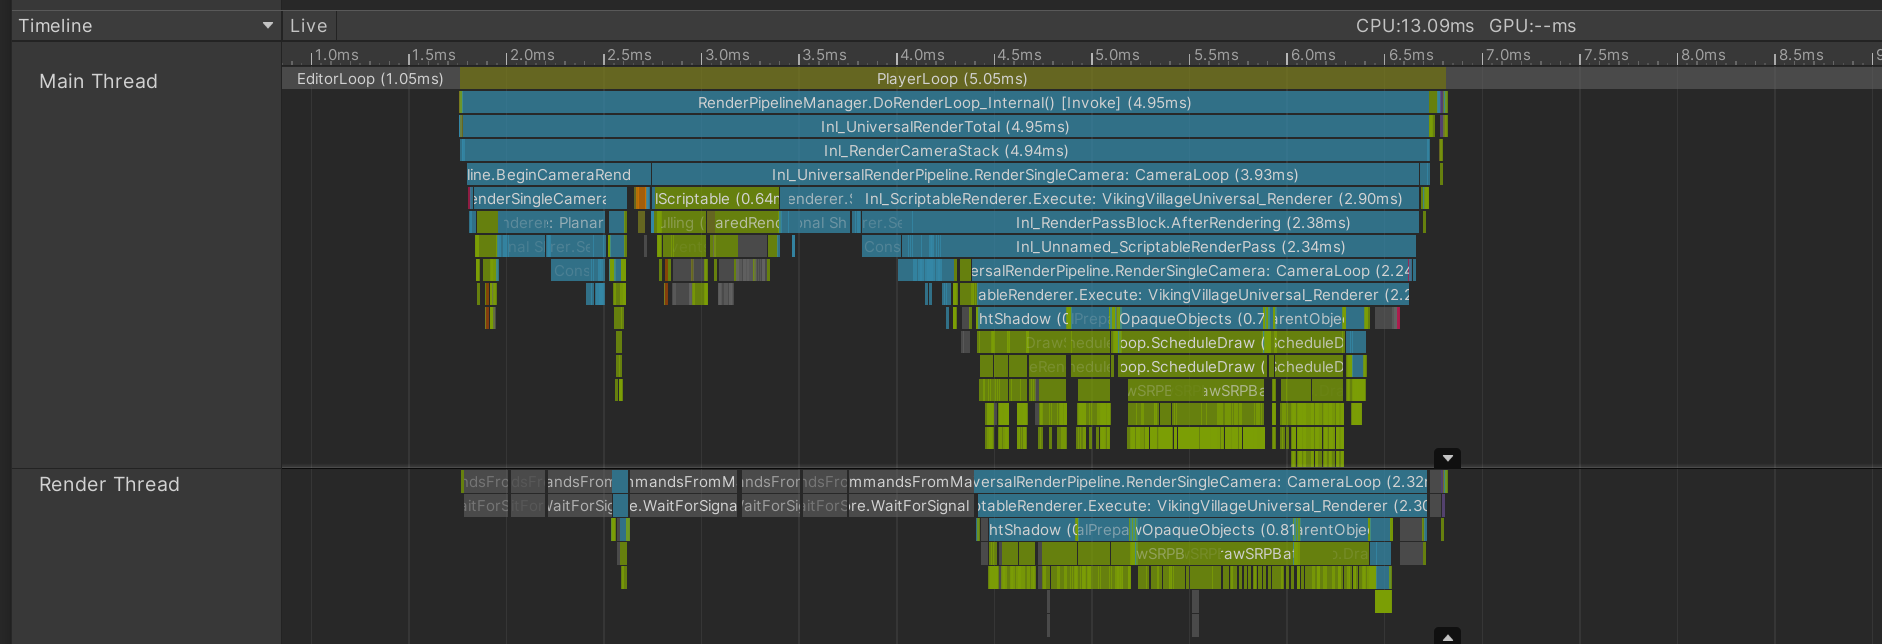
By using the profiling steps above, you should be able to determine why the performance of your game is limited, so the next step is determining what actions to take to improve performance.
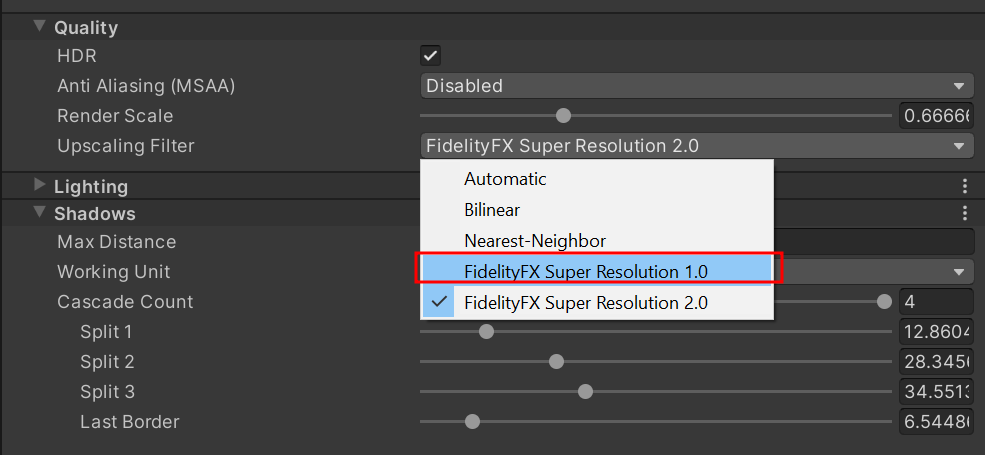
For the GPU-bound case, you may want to try FSR 1 or 2 integration for Unity URP.
Since it’s already been adopted by Unity, you should be able to use it simply by selecting FSR1 as the Upscaling Filter on the inspector panel of your Universal Render Pipeline Asset.
Our FSR 2 patch for Unity URP is now available on GitHub.
Check out our Integrating AMD FidelityFX™ Super Resolution 2 (FSR 2) into Unity URP blog post to get up and running quickly.
Note that our current version of the patch supports DirectX® 11 only.
In addition, you can try some of these quick fixes.

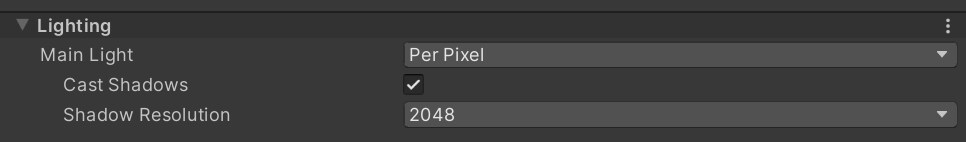
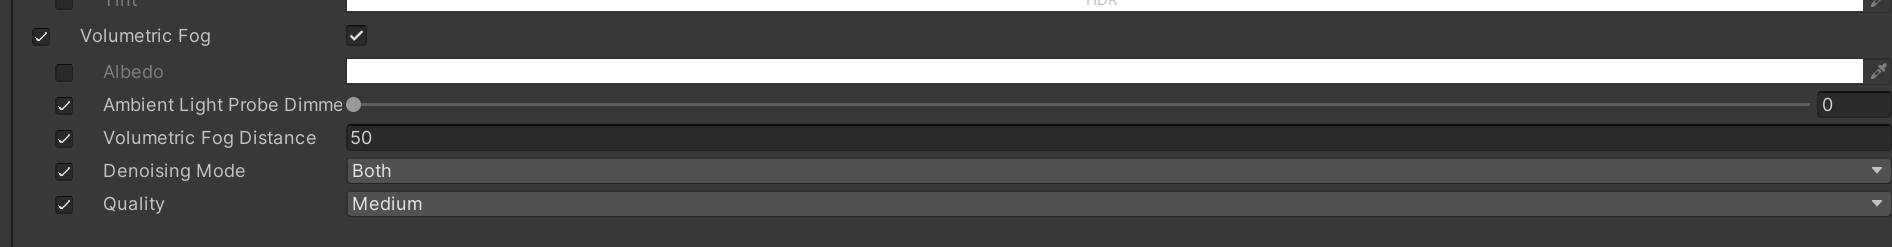
Remember to profile your game again after making any changes to ensure performance is improved.