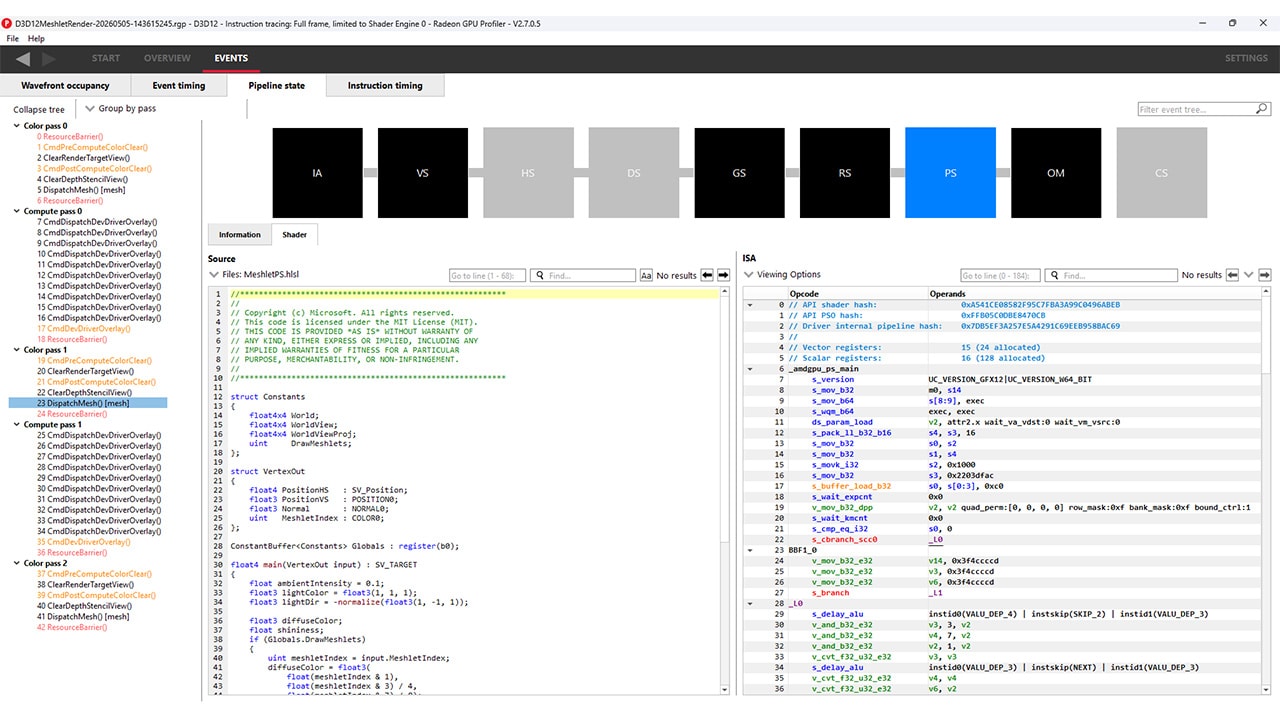
New AMD Radeon Developer Tool Suite update brings shader source code, Extended PIX Markers, and command-line capture

Visualize. Analyze. Optimize. Now available as part of the AMD Radeon™ Developer Tool Suite.

Meet the AMD Radeon™ Raytracing Analyzer (RRA) tool. Investigate the performance of your ray tracing applications and highlight potential bottlenecks.
By using either geometry mode or traversal mode in addition to a selection of coloring modes, AMD Radeon™ Raytracing Analyzer (RRA) allows you to easily spot areas of interest in your scene that need optimizing.
AMD RRA generates easy to understand visualizations of how your DirectX® 12 and Vulkan® ray tracing applications can be optimized. As with all the tools, capturing the ray tracing content of a game is both quick and simple, using the AMD Radeon™ Developer Panel and our AMD Software: Adrenalin Edition™ driver.
To help get you started, we’ve produced a short video and blog post to show you what you need to do:
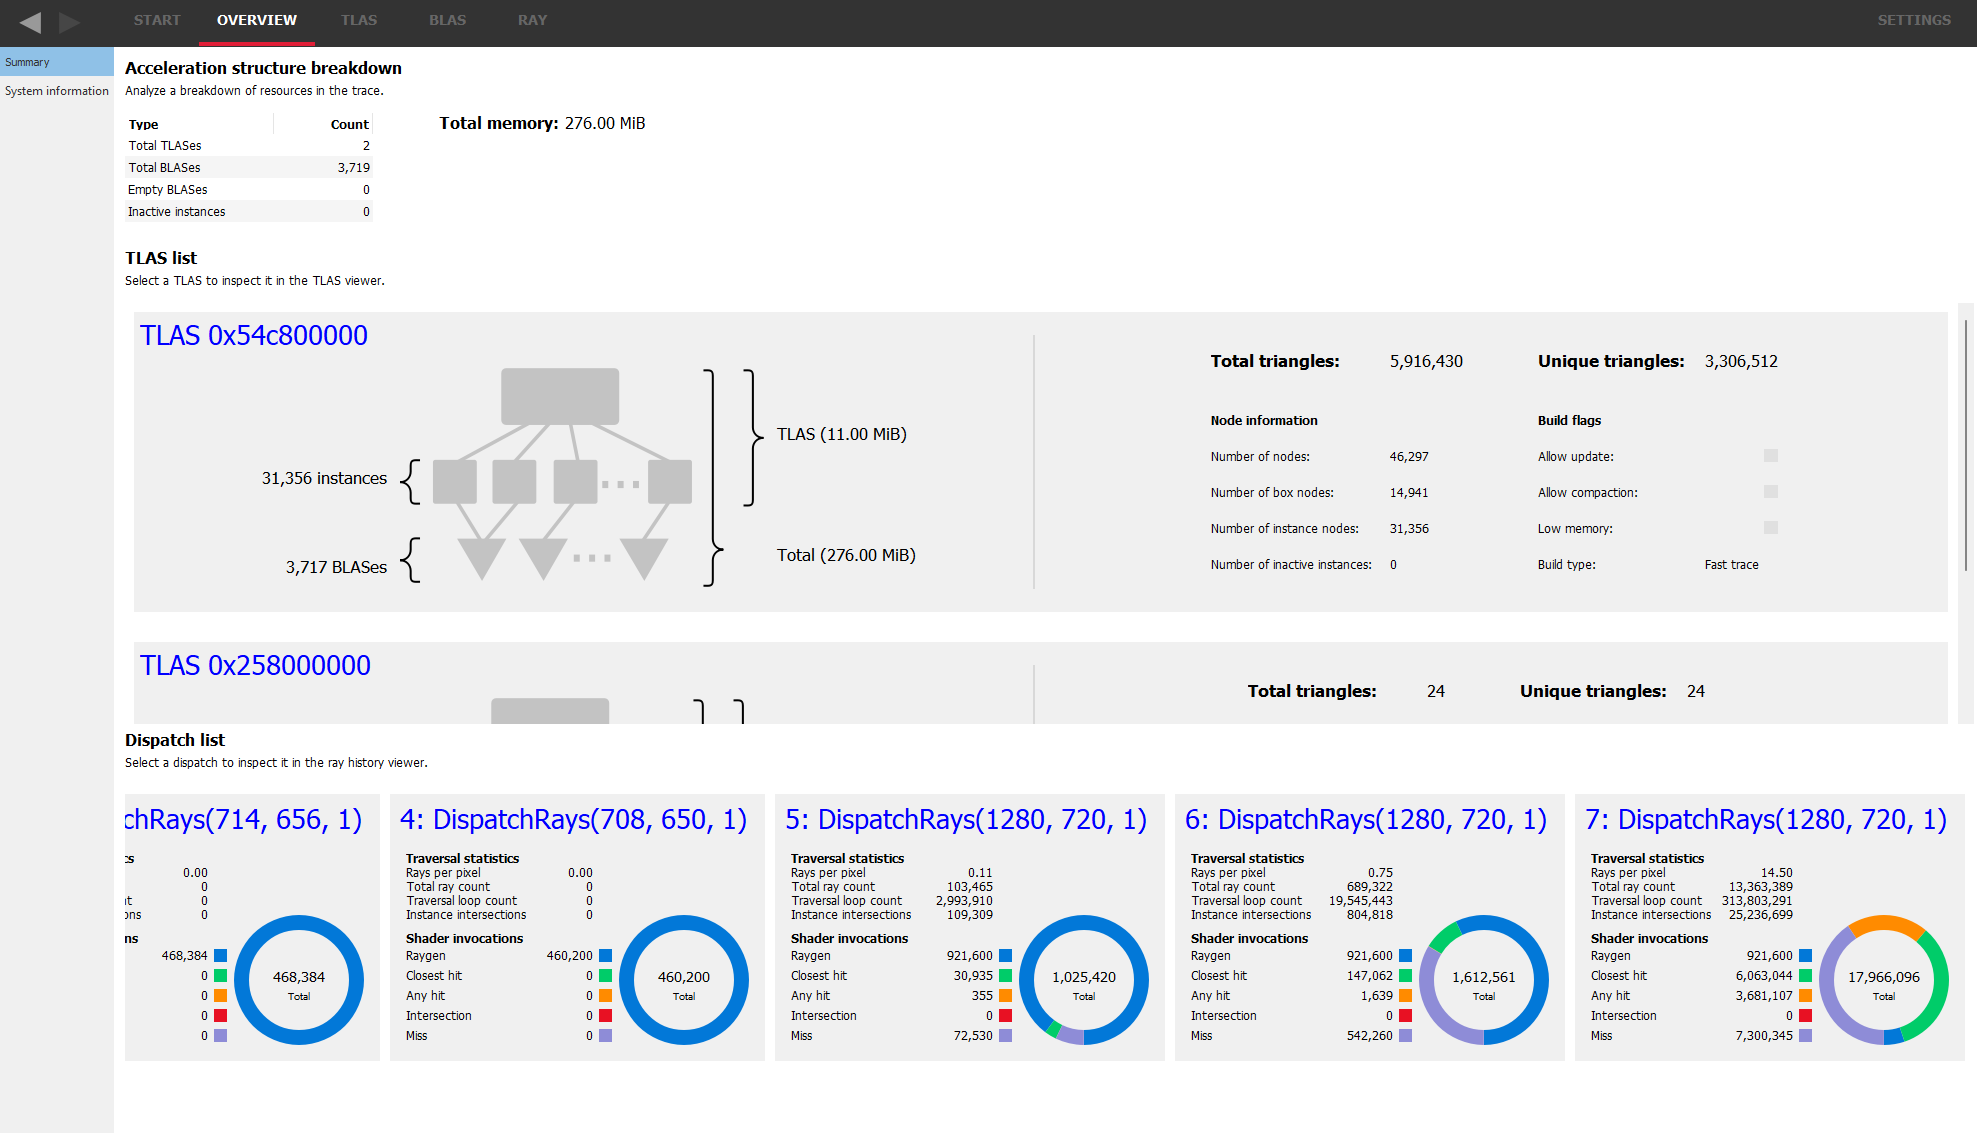
Get a high level view of your acceleration structures.
See how many TLAS and BLAS objects you are using, how large the acceleration structures are, and how much memory they are consuming.
Use the TLAS viewer to visually inspect your scene. Select from a number of coloring modes to highlight areas of interest. See opaque/non-opaque geometry at a glance and a host of other parameters.
Some coloring modes use a range of colors in a heatmap (the surface area heuristic modes, for example) making it easy to see hotspots.
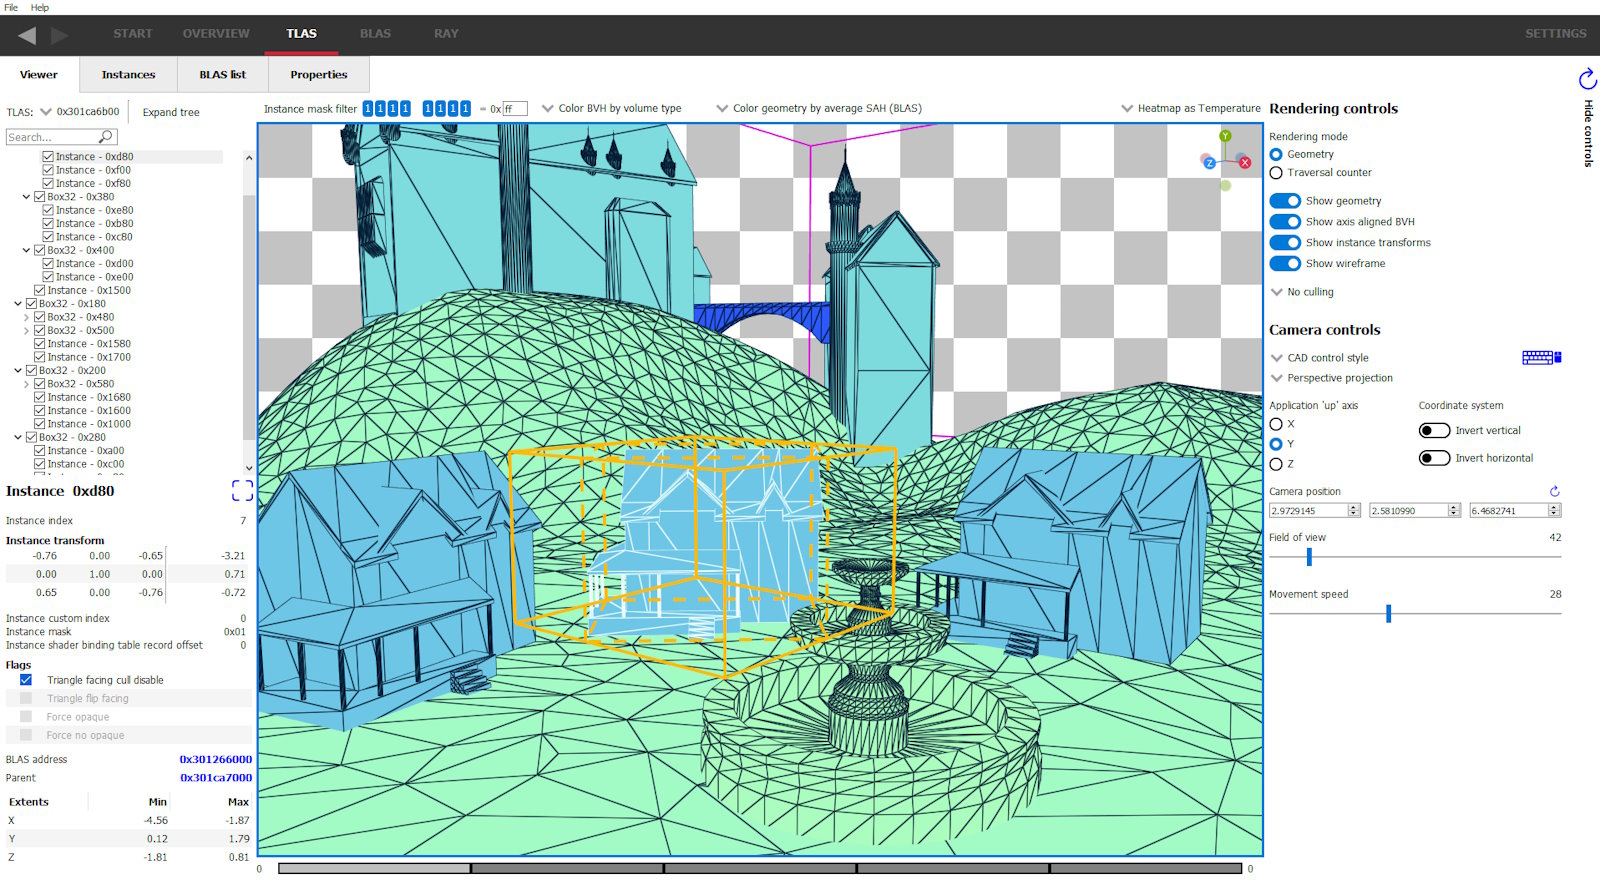
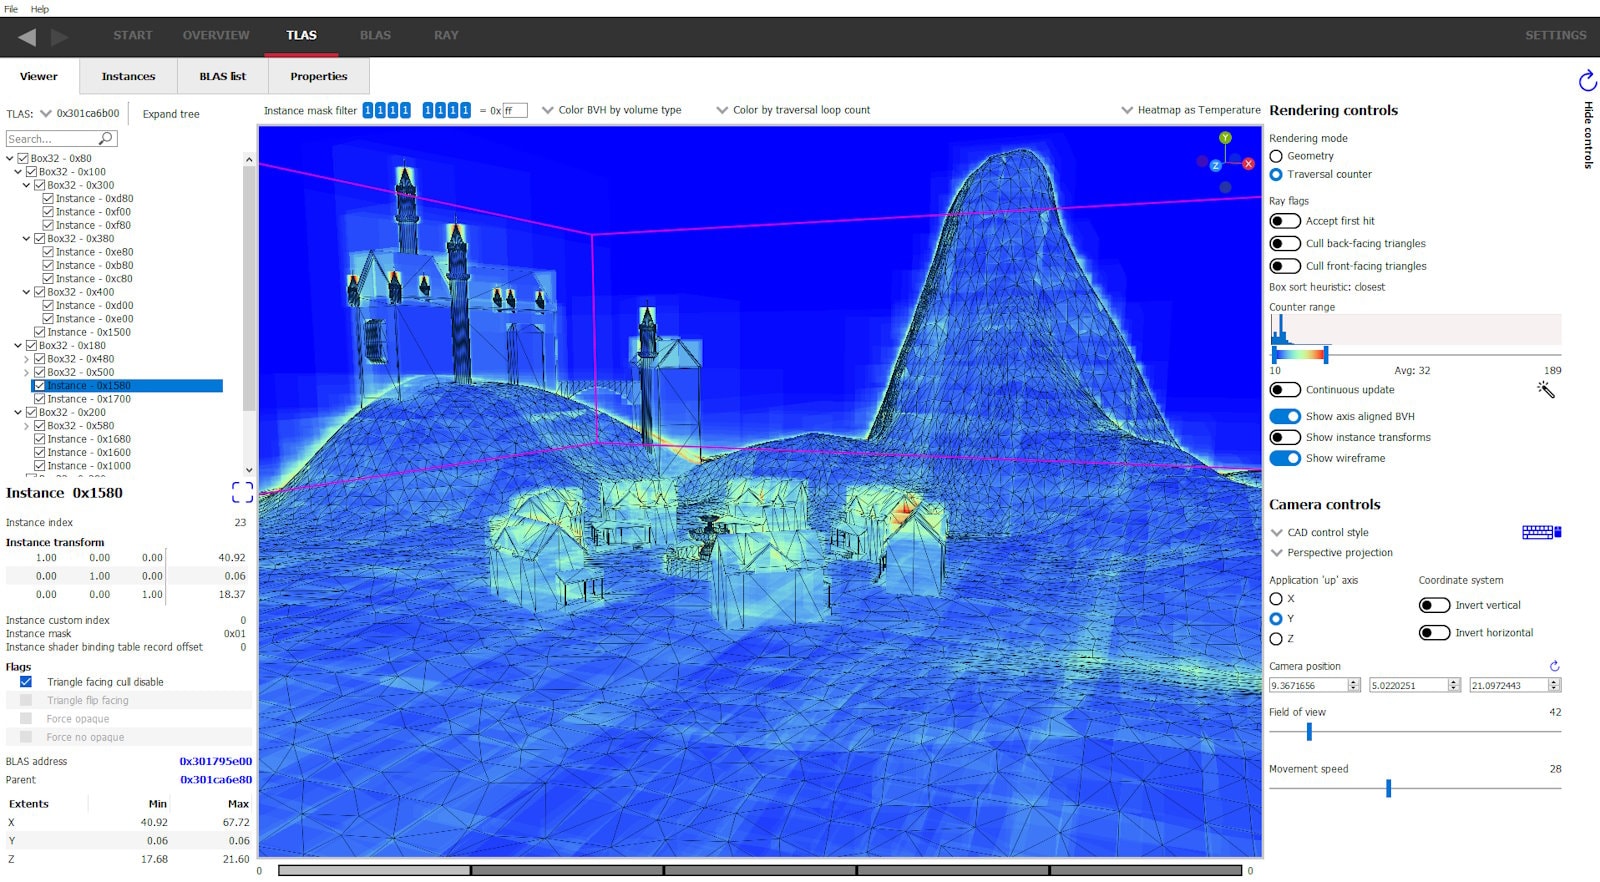
Switch to the traversal counter rendering mode to see how rays interact with your scene.
The heat map image will show areas that require attention. Generally the more red an area, the greater the counter number. The counter types can be selected to show instance hit, box hit/miss, triangle hit/miss and more.
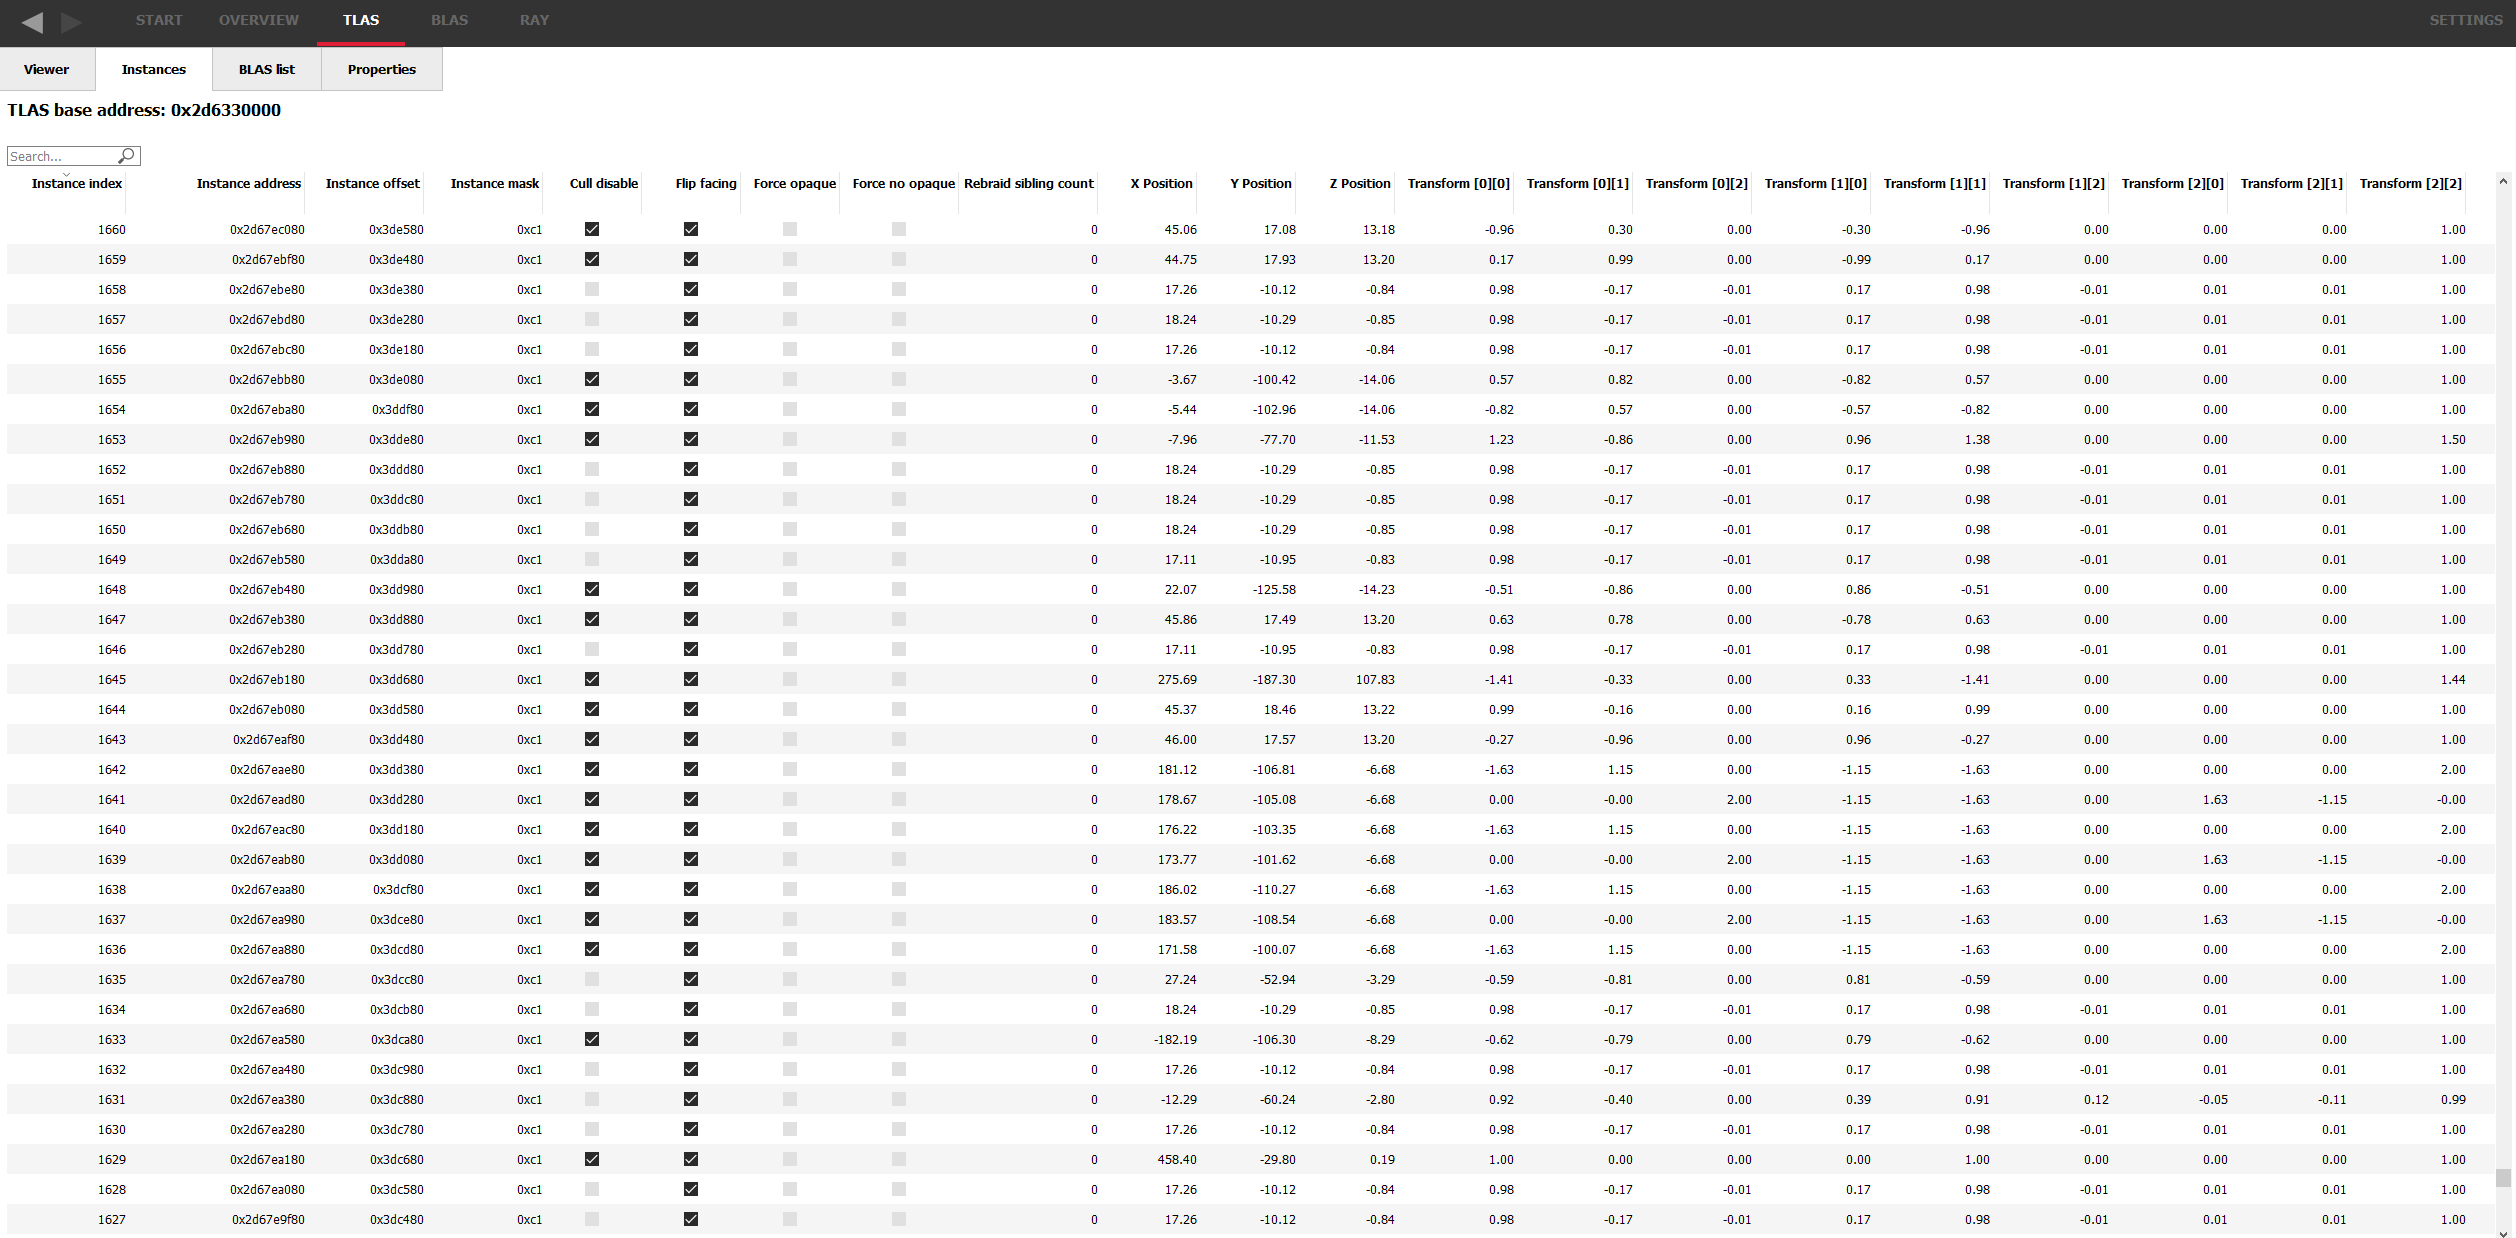
A list of all of the instance in the TLAS is available. A separate table is available for instances of a particular BLAS.
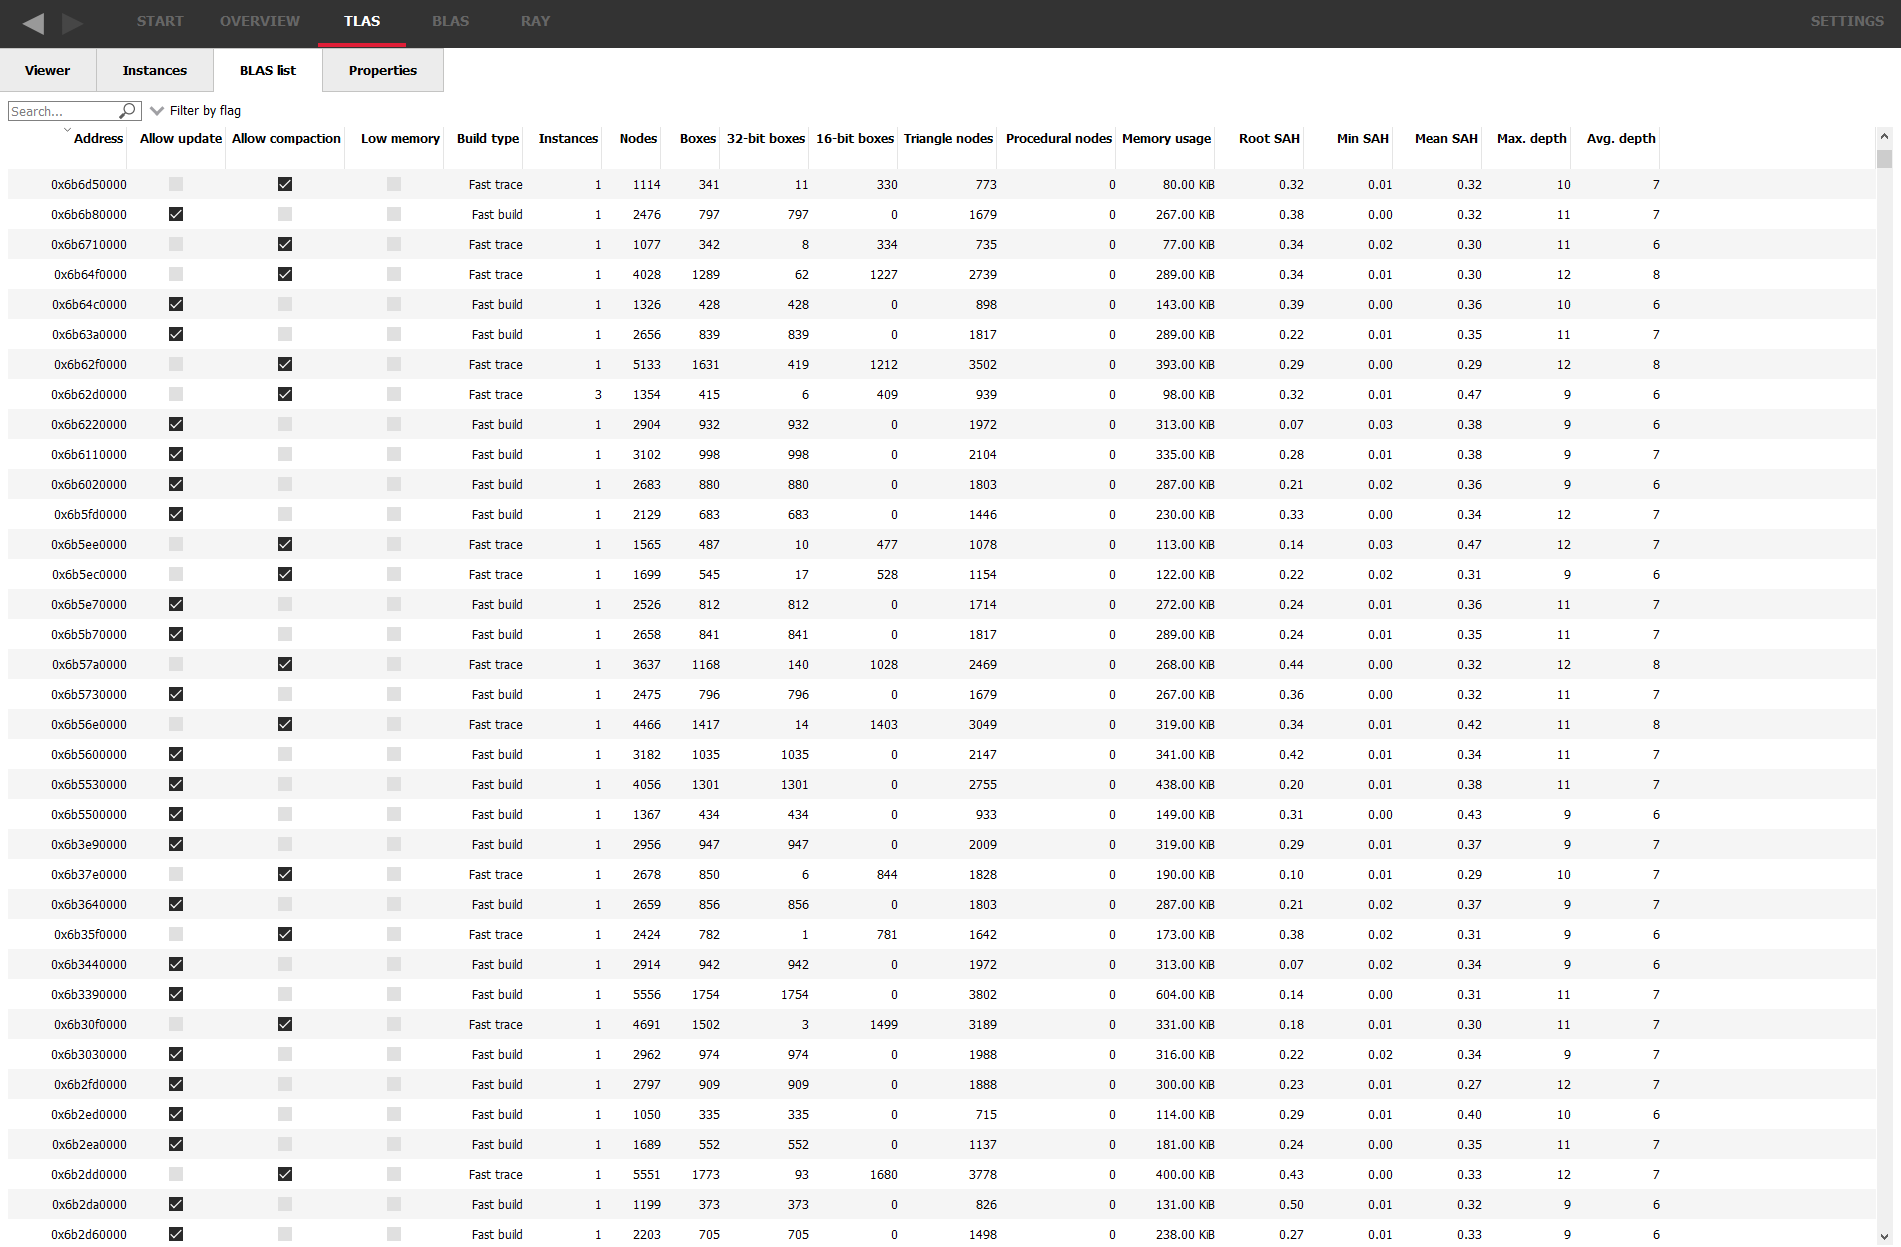
Here, you can see high level statistics for every BLAS in your scene, including things such as memory usage and triangle counts.
All the tables in AMD RRA, like the other tools, have column sorting and text searching so it’s easy to find what you’re looking for.
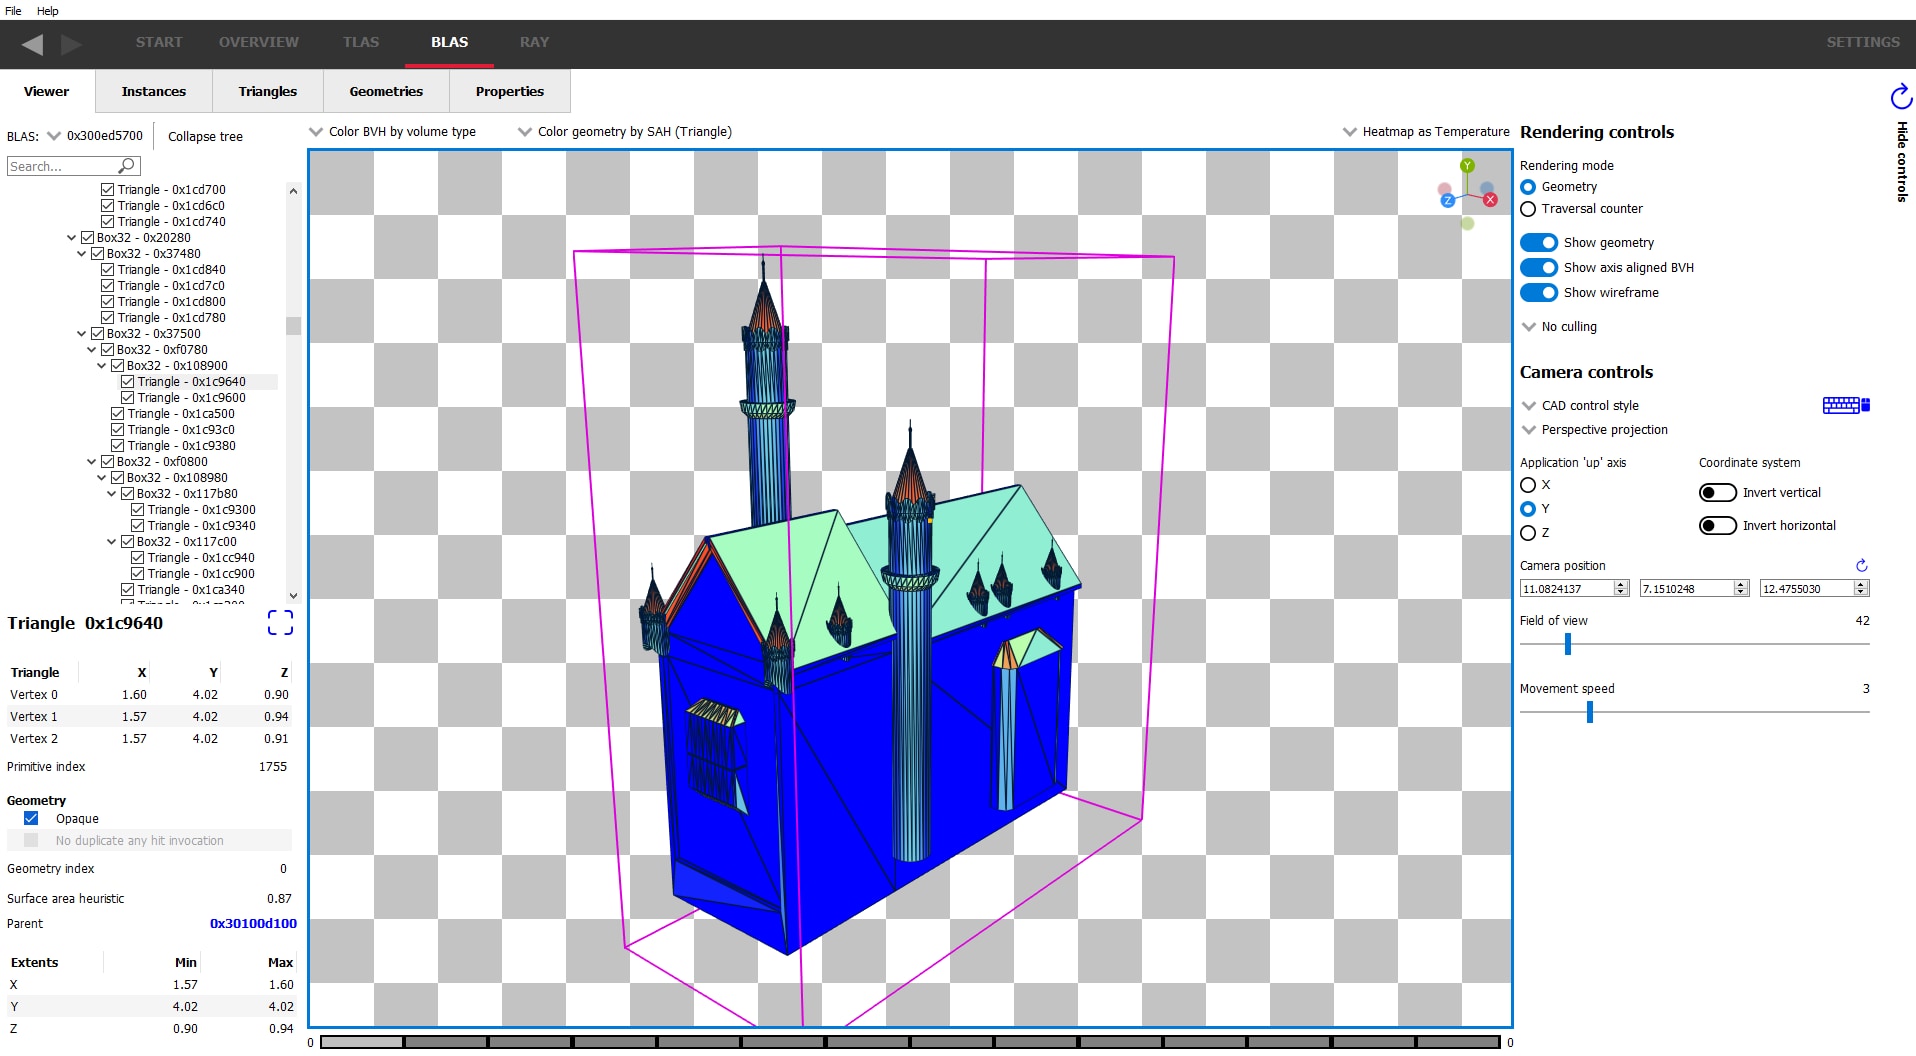
Double-clicking on a BLAS will display it in the BLAS viewer, almost identical to the TLAS viewer but allows inspection of a single BLAS.
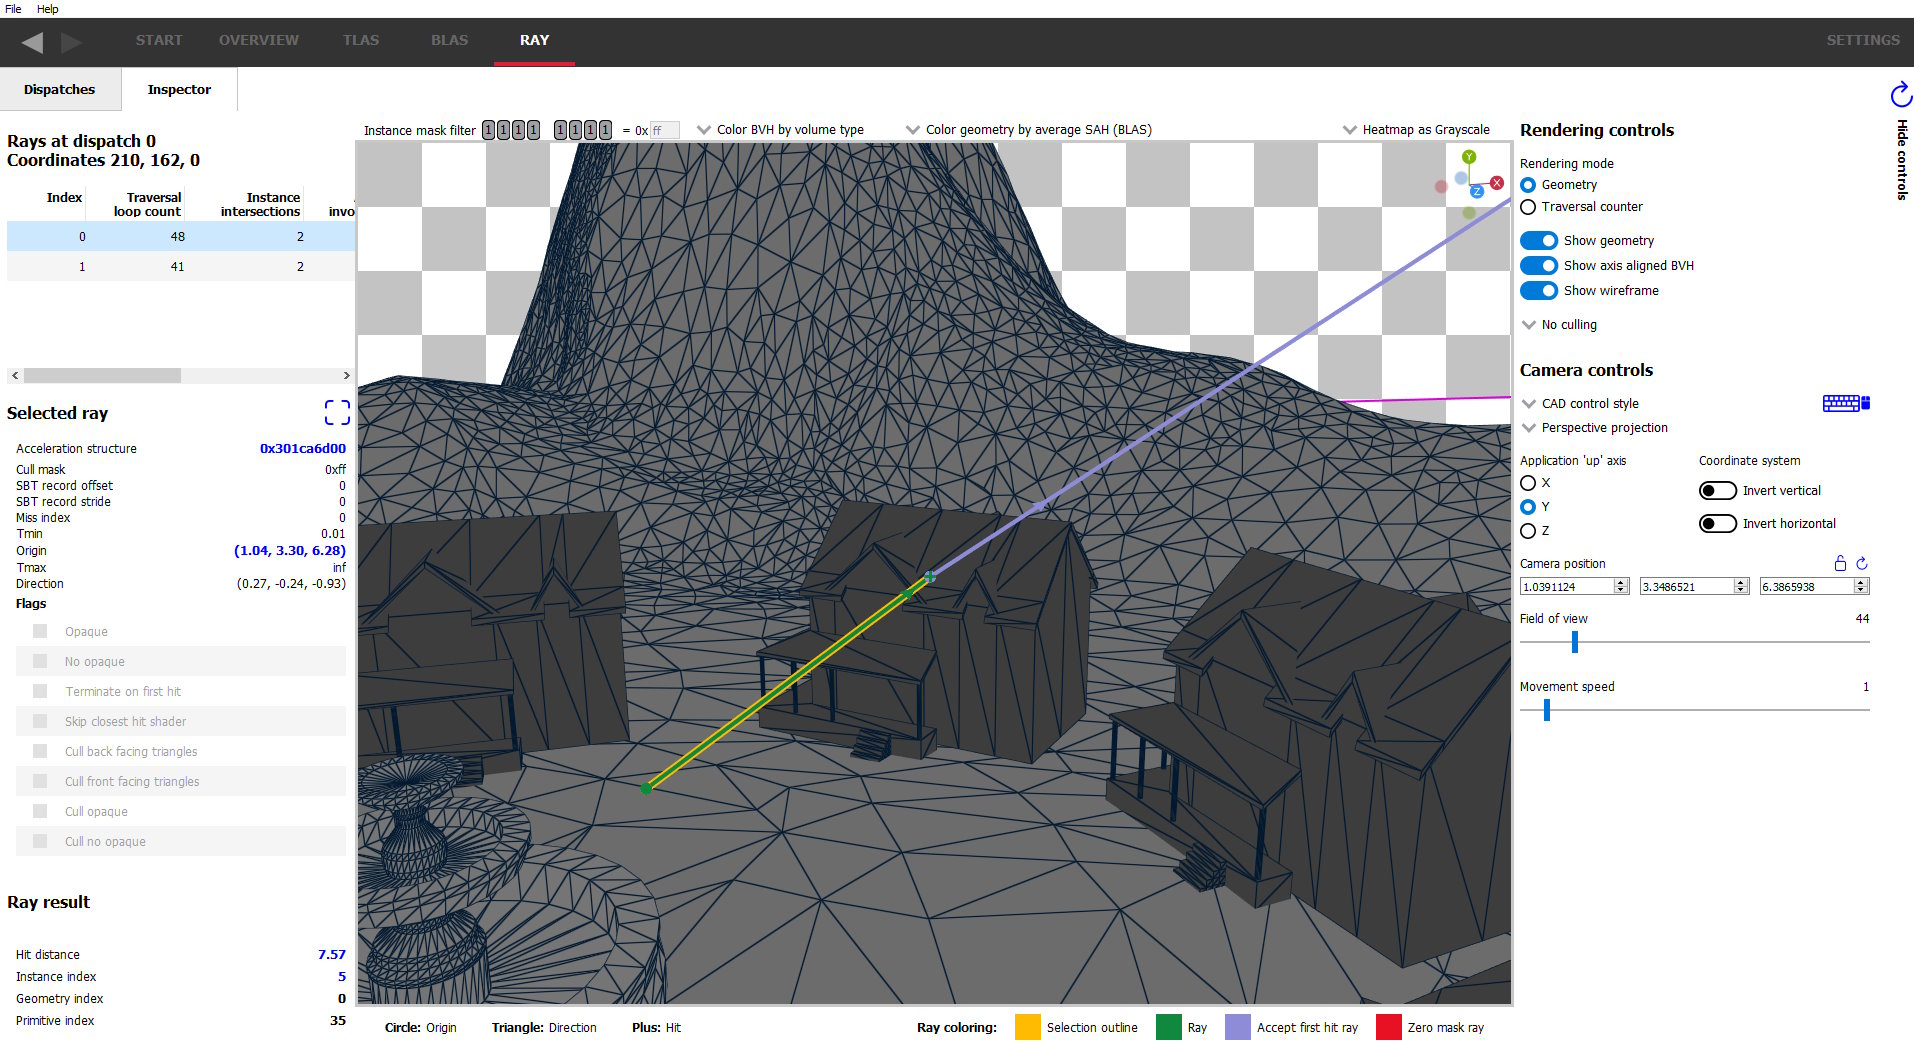
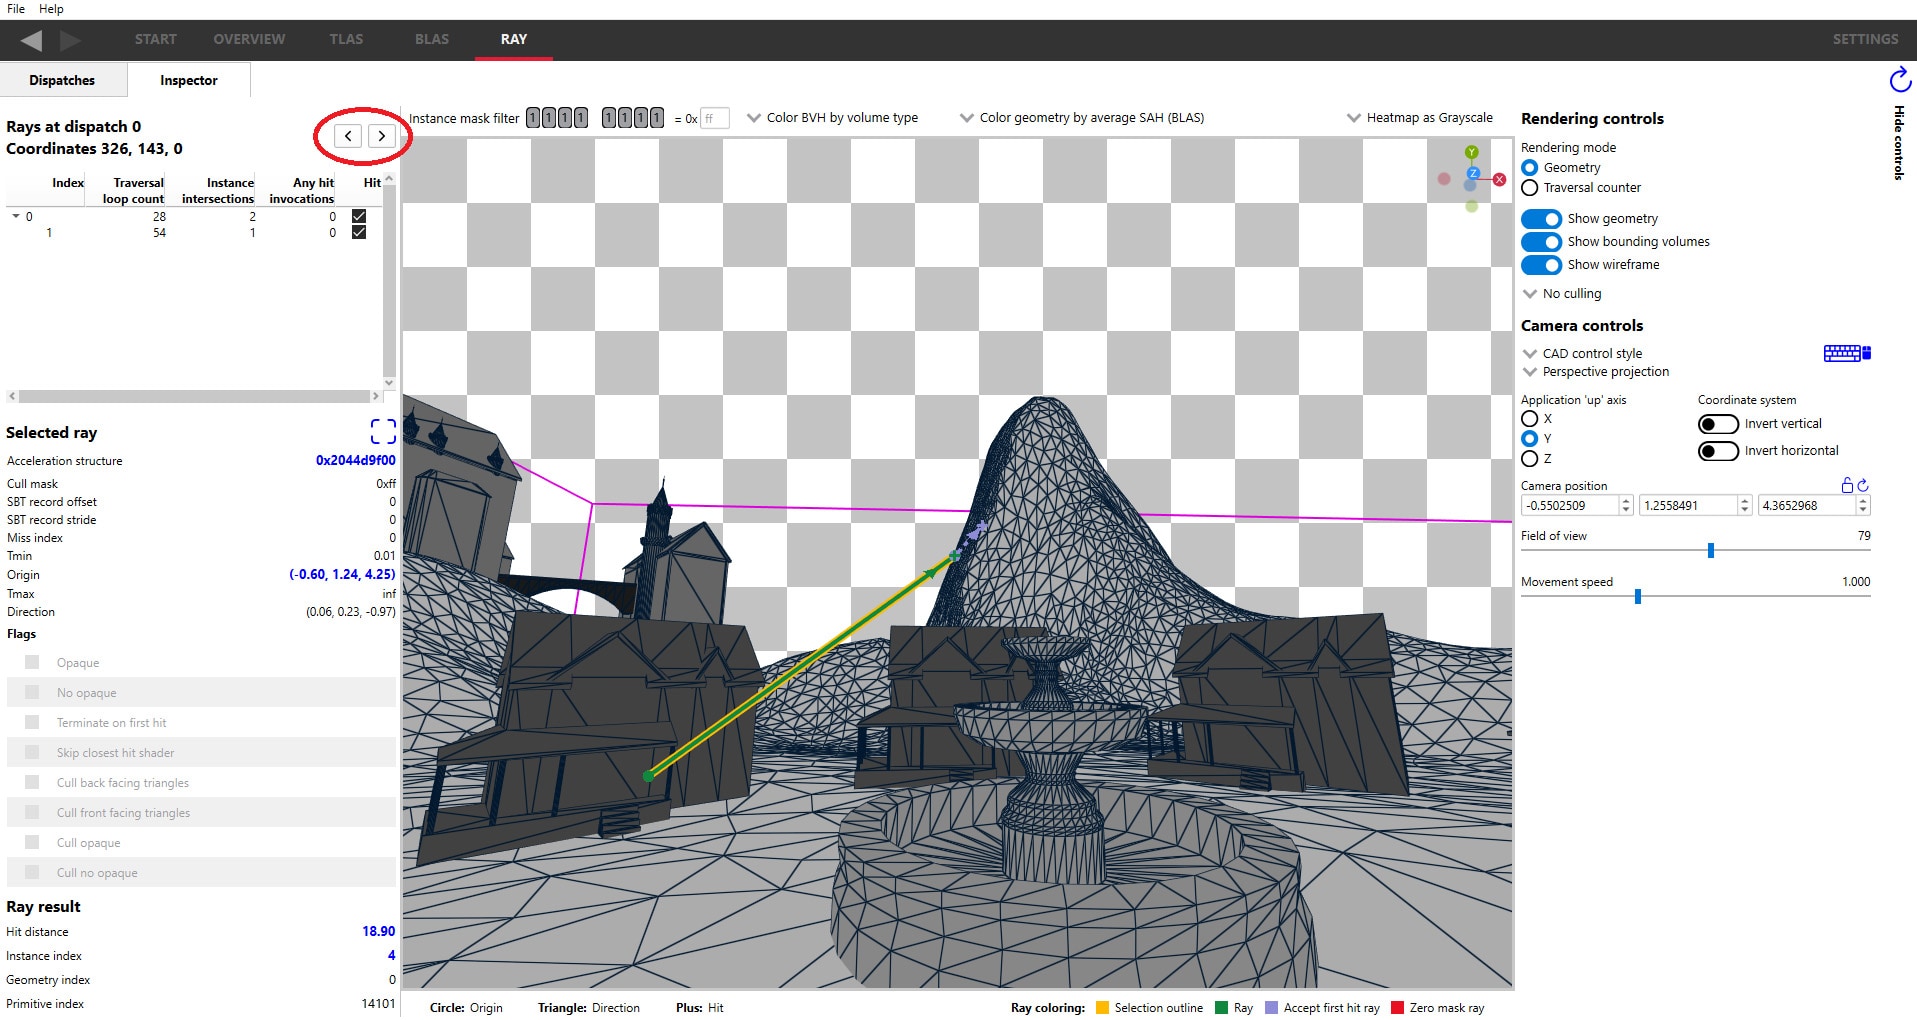
Starting with v1.3, AMD RRA now gives you the ability to see individual rays and how they interact with the scene, showing intersections, misses and the shaders called on those rays, including additional rays generated from the initial ray.
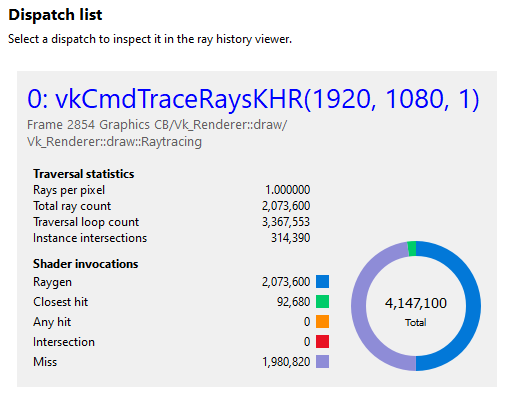
Select a “pixel” from the table or heatmap ..
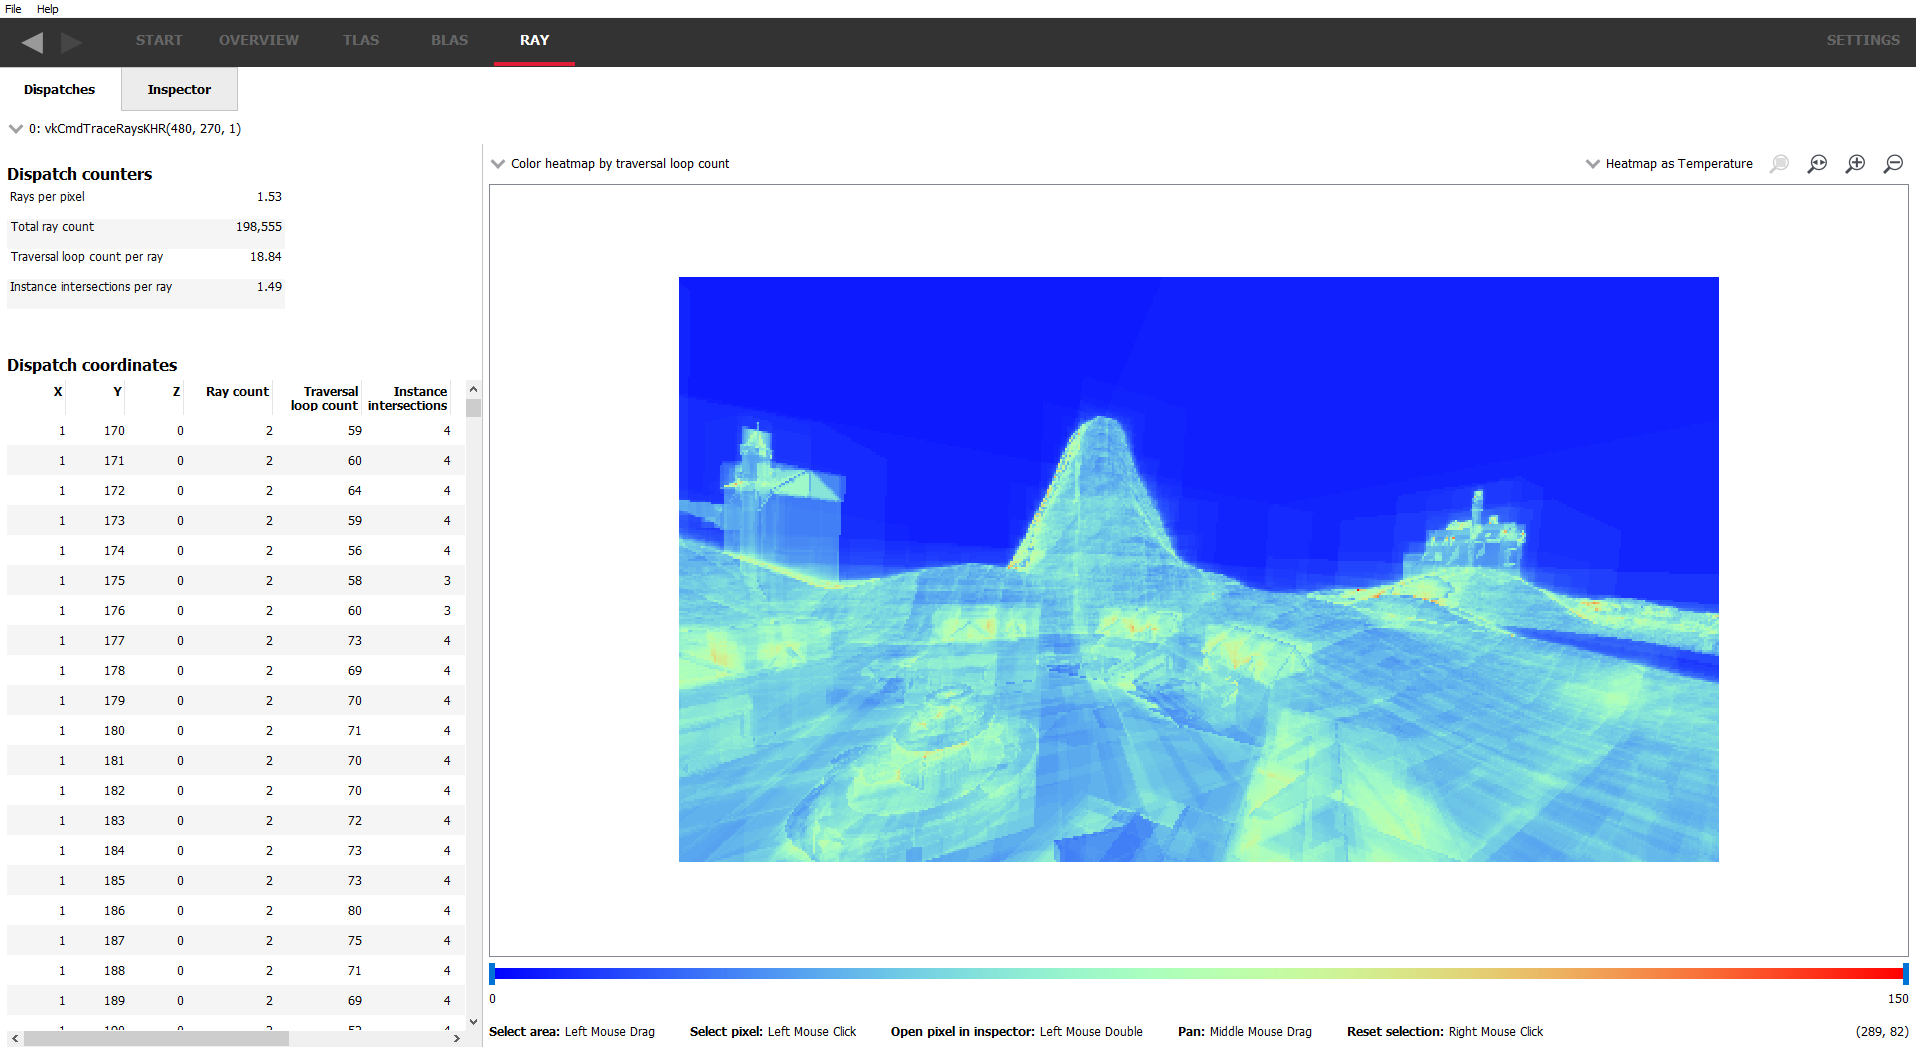
.. and see the rays that are shot from that pixel.