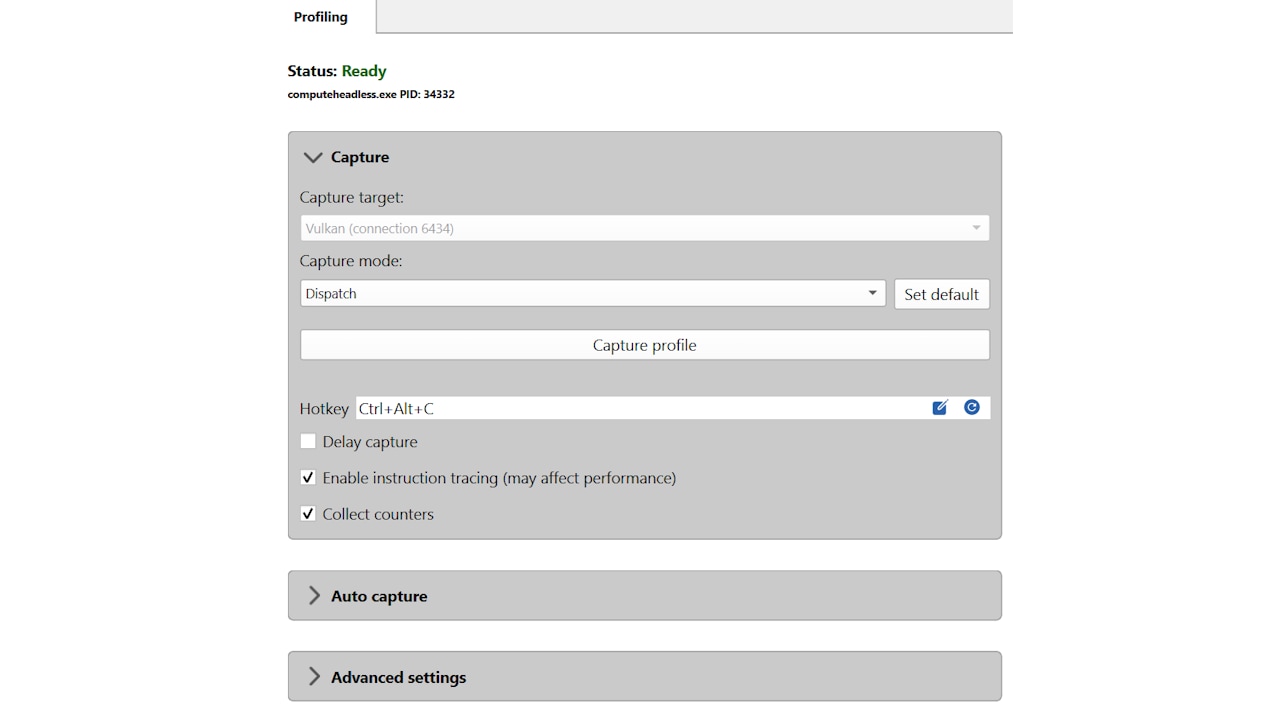
AMD Radeon™ Developer Panel
The RDP provides a communication channel with the Radeon™ Adrenalin driver. It generates event timing data used by the Radeon™ GPU Profiler (RGP), and the memory usage data used by the Radeon™ Memory Visualizer (RMV).
The AMD Developer Tools team is happy to announce a new release of the AMD Radeon™ Developer Tool Suite. This release includes the following new versions of the tools contained in the suite:
Across the tool suite, we have added support for the latest AMD Radeon™ RX 9000 Series GPUs, including the recently released AMD Radeon™ RX 9060 XT, the AMD Radeon™ RX 9070 GRE, and the AMD Radeon™ AI PRO R9700.
Below, you can find details for new features introduced by each tool for this release.
In AMD Radeon™ GPU Detective v1.5, you can augment the crash analysis output file with high-level information about in-flight shaders, including the source file name and the HLSL source code. This requires providing the tool with the paths to the PDB files, which can be done via AMD RDP or the AMD RGD command line
Please check out the AMD RGD blog post for more information.
In AMD Radeon™ GPU Profiler v2.5, we have several improvements that we hope you will find useful. We have improved the interoperability between the AMD Radeon™ GPU Analyzer and the AMD Radeon™ GPU Profiler, especially when dealing with raytracing or compute pipelines made up of multiple shaders.
Counter collection and display is now supported for several recent APUs based on AMD RDNA™ 3.5 architecture. This functionality requires at least “AMD Software: Adrenalin Edition™ 25.6.1” (or an equivalent 25-10-based driver).
We have some minor improvements in our Work Graphs support, including the display of Work Graphs pipelines in the Pipelines Overview pane.
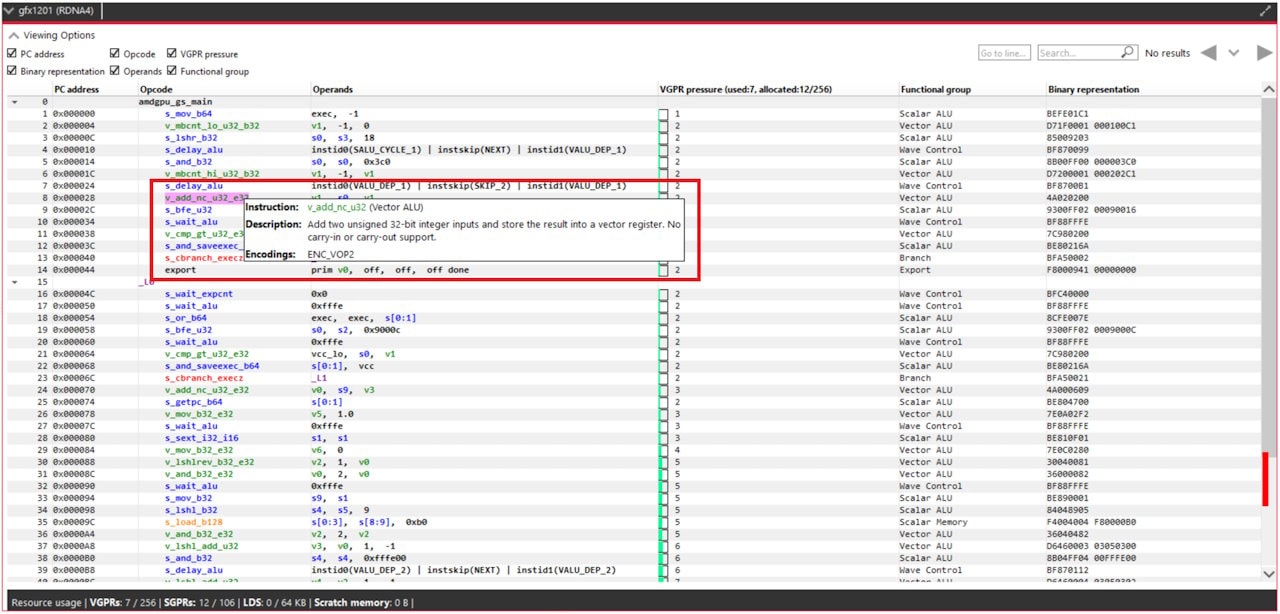
We have also improved the instruction latency tooltip in the Instruction timing pane. It will now show a color legend to help new users better understand what is represented in the latency bar in the user interface.
For DirectX® 12 events launched from the ExecuteIndirect API, there will now be some additional annotations on the child events shown in the event tree view in the Event timing pane and in the Pipeline state pane.
And finally, we have some important bug fixes for AMD Radeon™ RX 9000 Series GPUs, including several fixes that provide more precise timing data. We have also improved the performance when loading a profile with a large number of events.
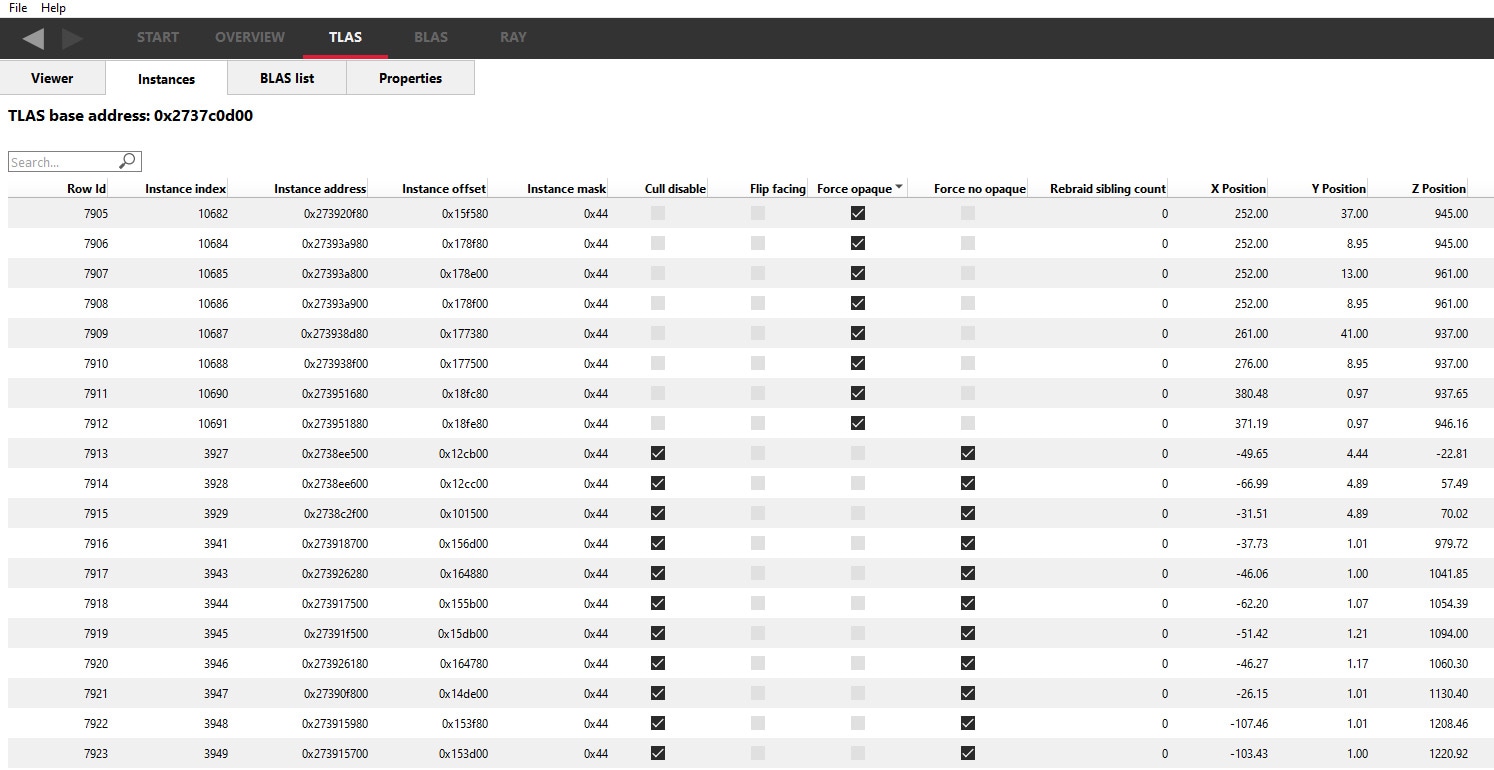
With AMD Radeon™ Raytracing Analyzer v1.9, the TLAS and BLAS tables now have an index column that doesn’t change, even if the table sorting is changed. This allows you to quickly count the number of rows containing a particular attribute. For example, we may be interested to know how many instances use ‘fast build’. Simply sort the table by ‘build type’. Find the first and last instances of ‘fast build’, making a note of the row index. Subtracting the two indices and adding one will give the number of rows.
In the example below, the TLAS instances table is sorted by ‘Force opaque’. It can be clearly seen that there are 7913 instances that have this flag set (indices 0 .. 7912).
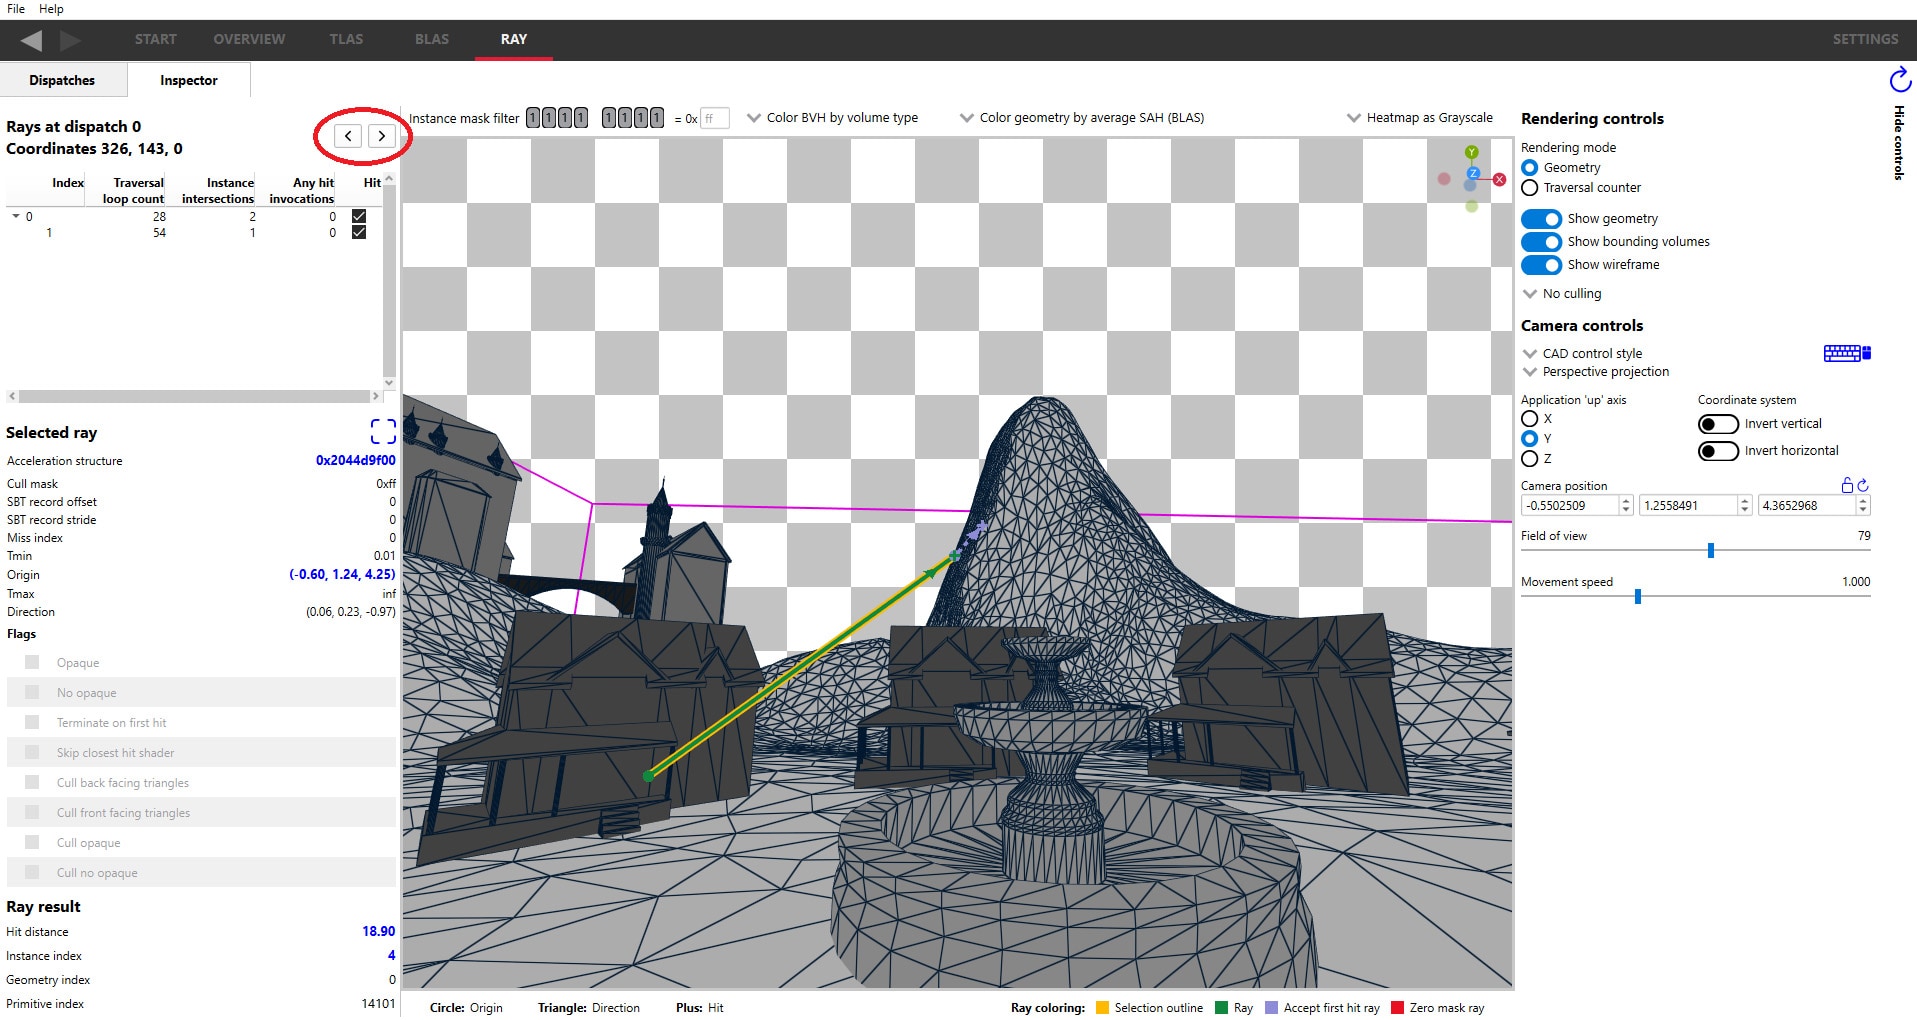
There is also the option to select the previous and next ray directly from the ray inspector pane, rather than jumping back to the Dispatches pane to sets things up. Start at the dispatches pane and sort the dispatch coordinates table as desired. A typical use case is to sort by traversal loop count, as seen here:
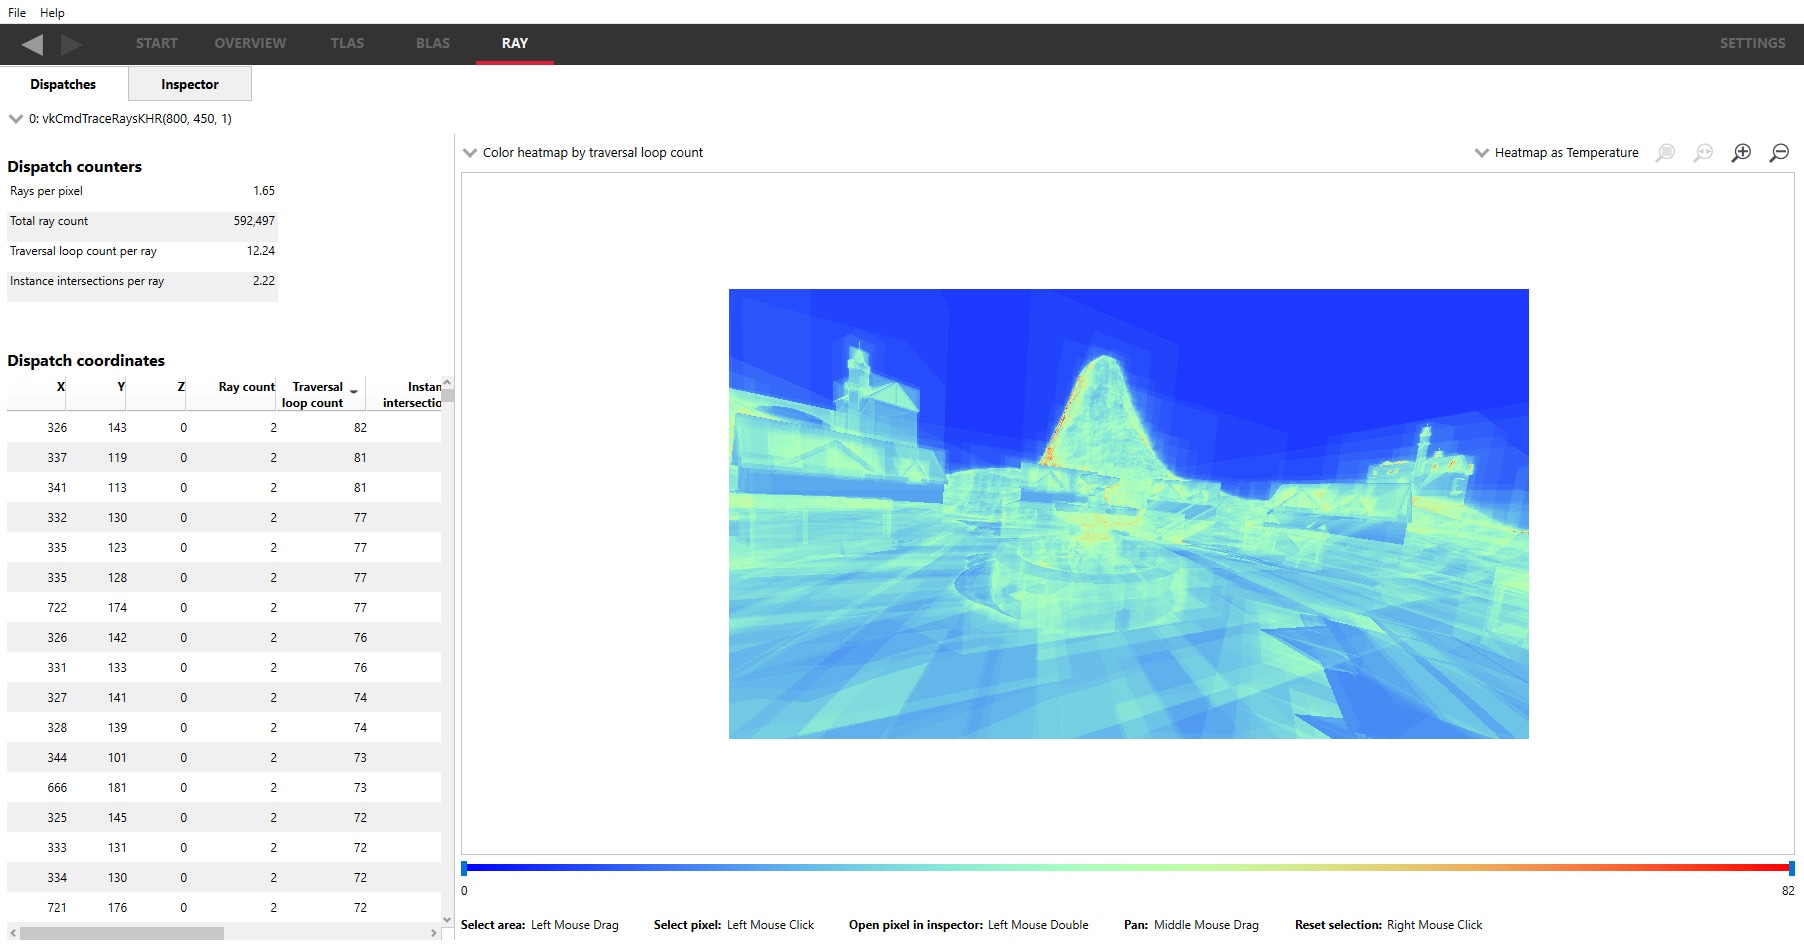
Double-click the mouse button to see the selected ray in the Inspector pane. Clicking the < and > buttons will perform the same functionality as going back to the Dispatches table and double-clicking on the next or previous table entries.
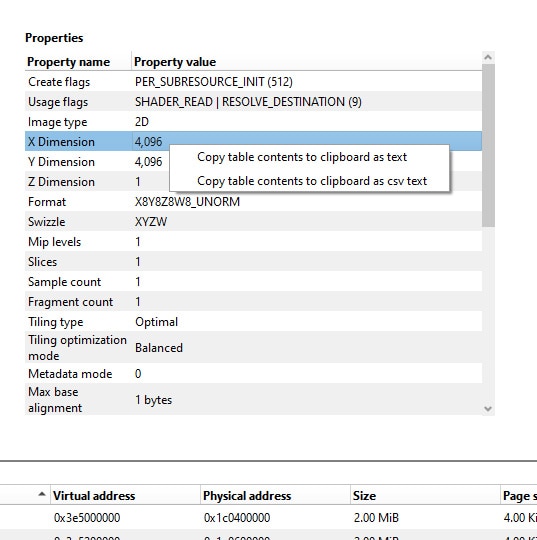
With the AMD Radeon™ Memory Visualizer v1.13, you can now copy the resource details to the clipboard, either as raw text or as comma-separated values so they can be pasted into a text file or spreadsheet, respectively. Simply choose the resource you are interested in and right-click the mouse on the ‘properties’ table. This will bring up a context menu as shown below:
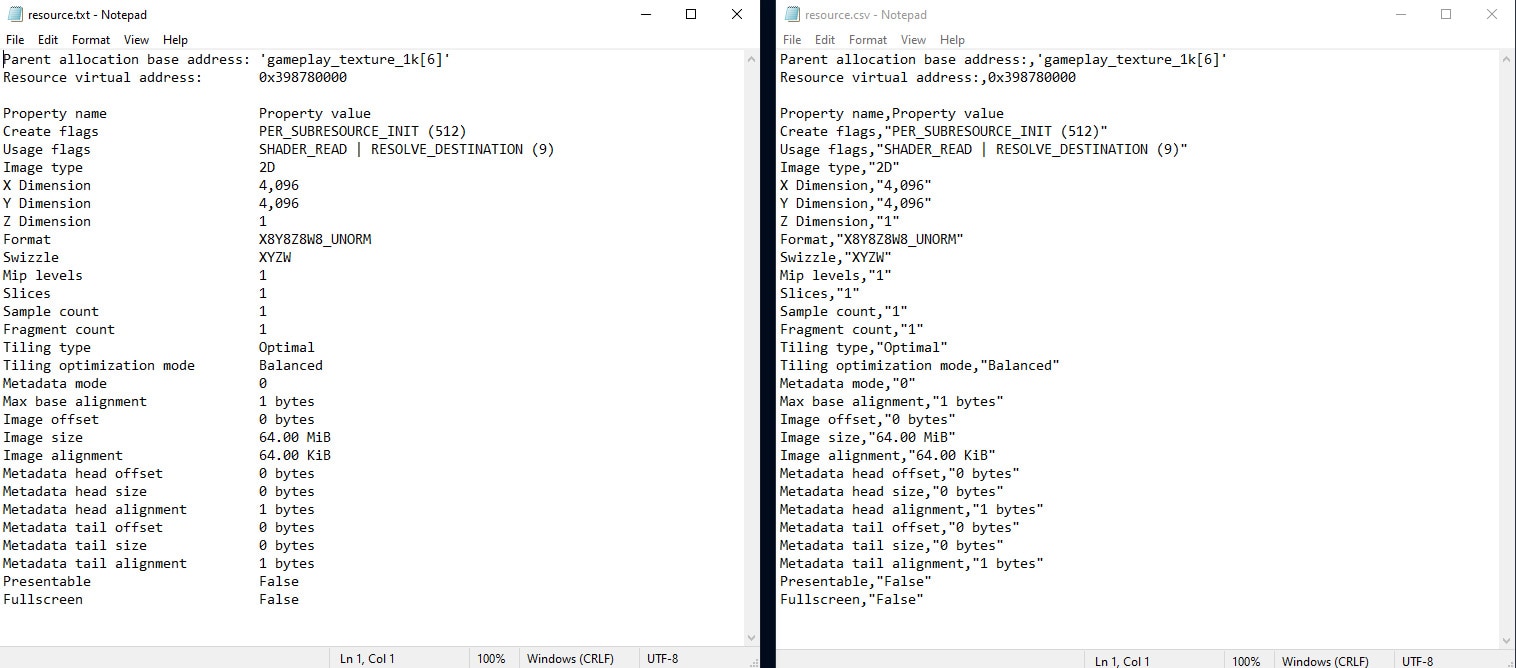
Select the option you prefer, open up a text editor and paste in the results:
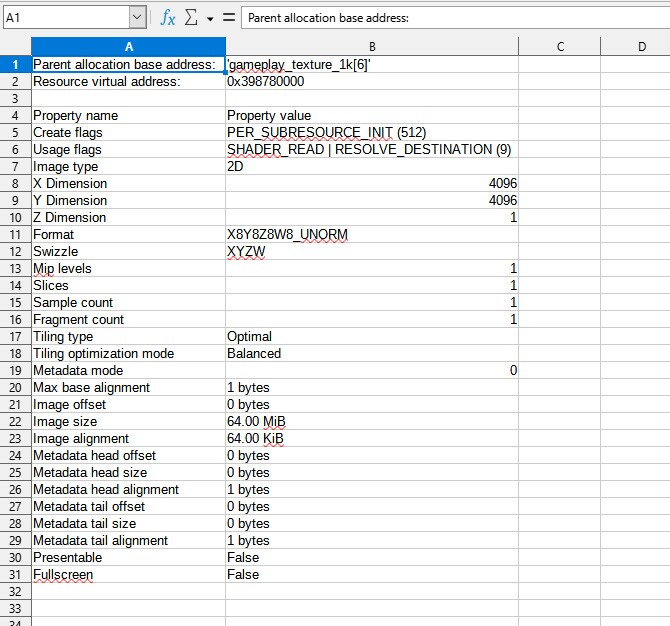
The file can then be saved for later use or (for csv text files) loaded into a spreadsheet application:
As part of our support for the latest AMD Radeon™ RX 9000 Series GPUs, the AMD Radeon™ GPU Analyzer v2.13 enables gfx1200 RDNA™ 4 architecture as a compilation target across all of AMD RGA’s modes.
The Binary Analysis mode now supports Vulkan® mesh shading pipelines and Vulkan raytracing pre-compiled Code Objects.
In addition, all Vulkan offline modes (vk-offline, vk-spv-offline and vk-spv-txt-offline) now support mesh shading pipeline compilation.
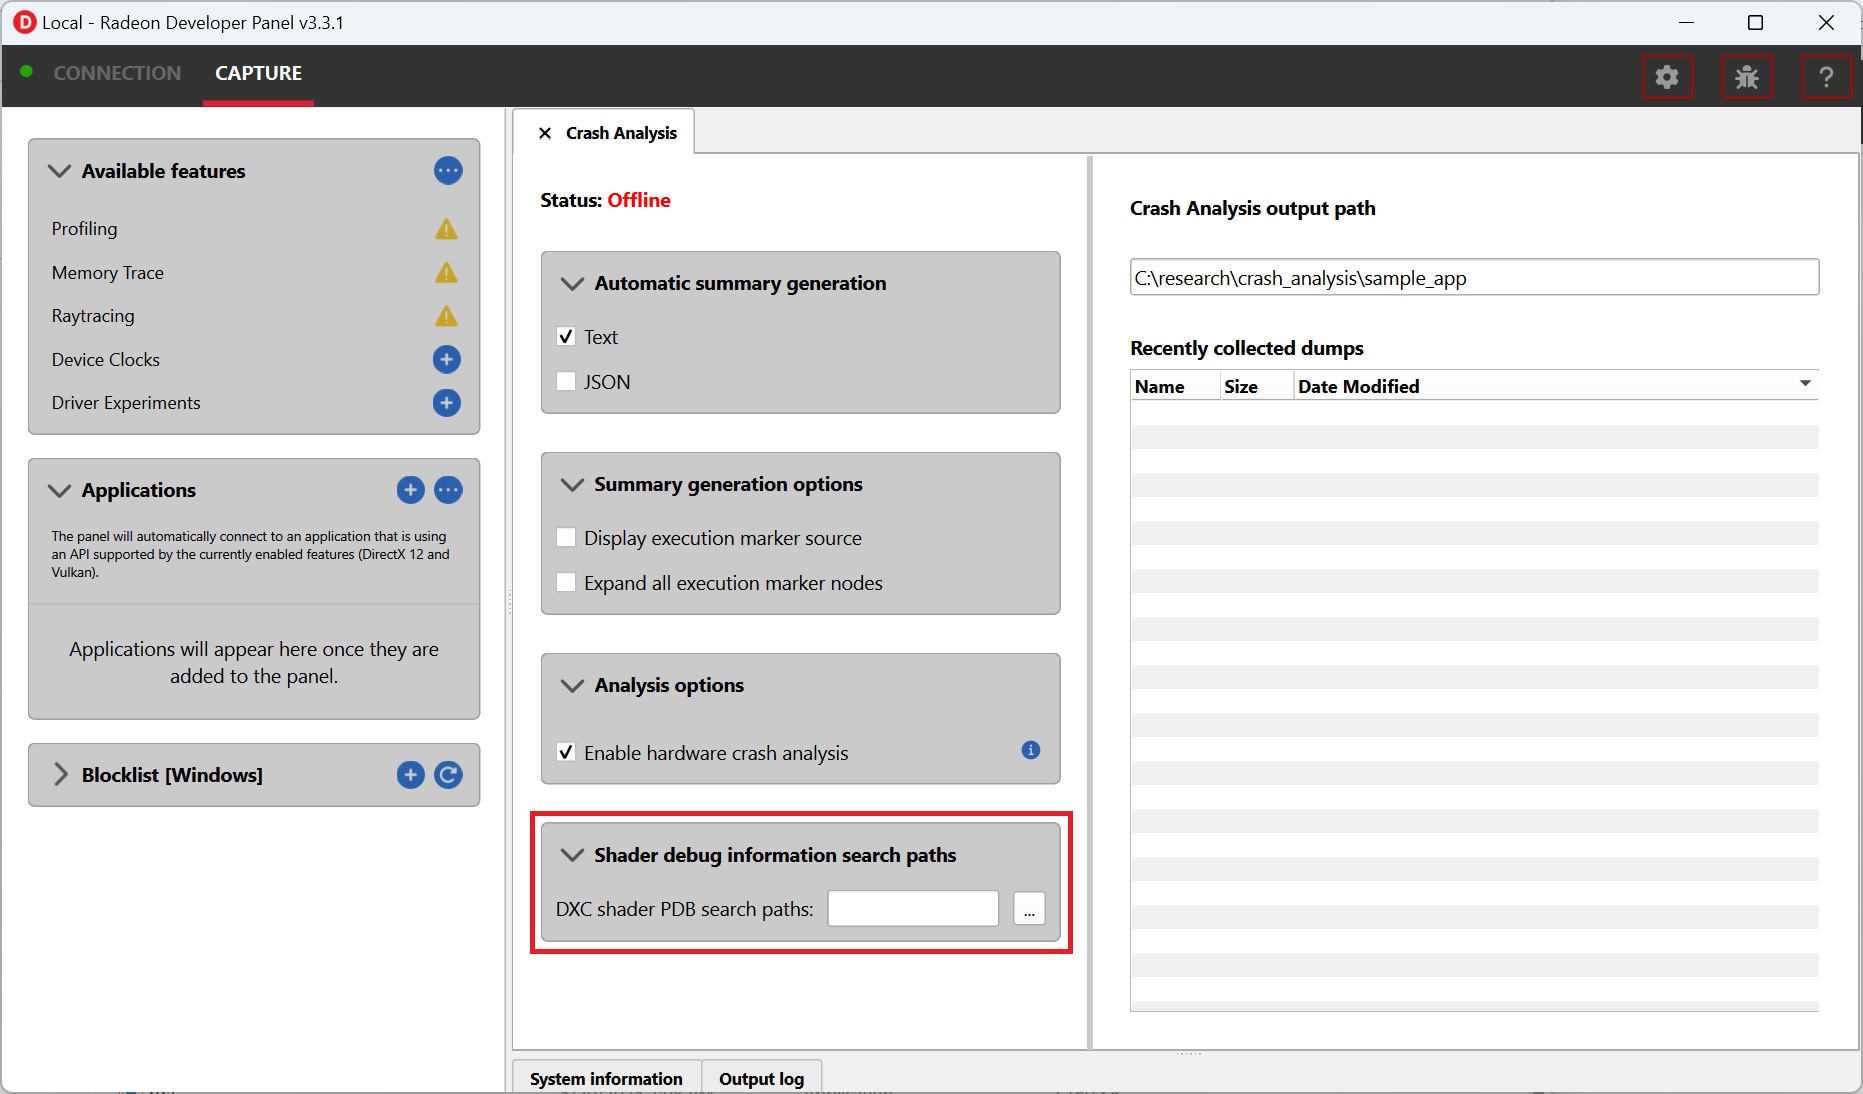
v3.3.1 is a minor release for the AMD Radeon™ Developer Panel. The new version supports the new Debug Information feature for AMD Radeon™ GPU Detective. As mentioned earlier, please read about this new support in the AMD RGD blog post.
As always, please head over to /tools/ to download the latest release!