New AMD Radeon Developer Tool Suite update brings shader source code, Extended PIX Markers, and command-line capture

Analyze. Adjust. Accelerate. Now available as part of the AMD Radeon™ Developer Tool Suite.

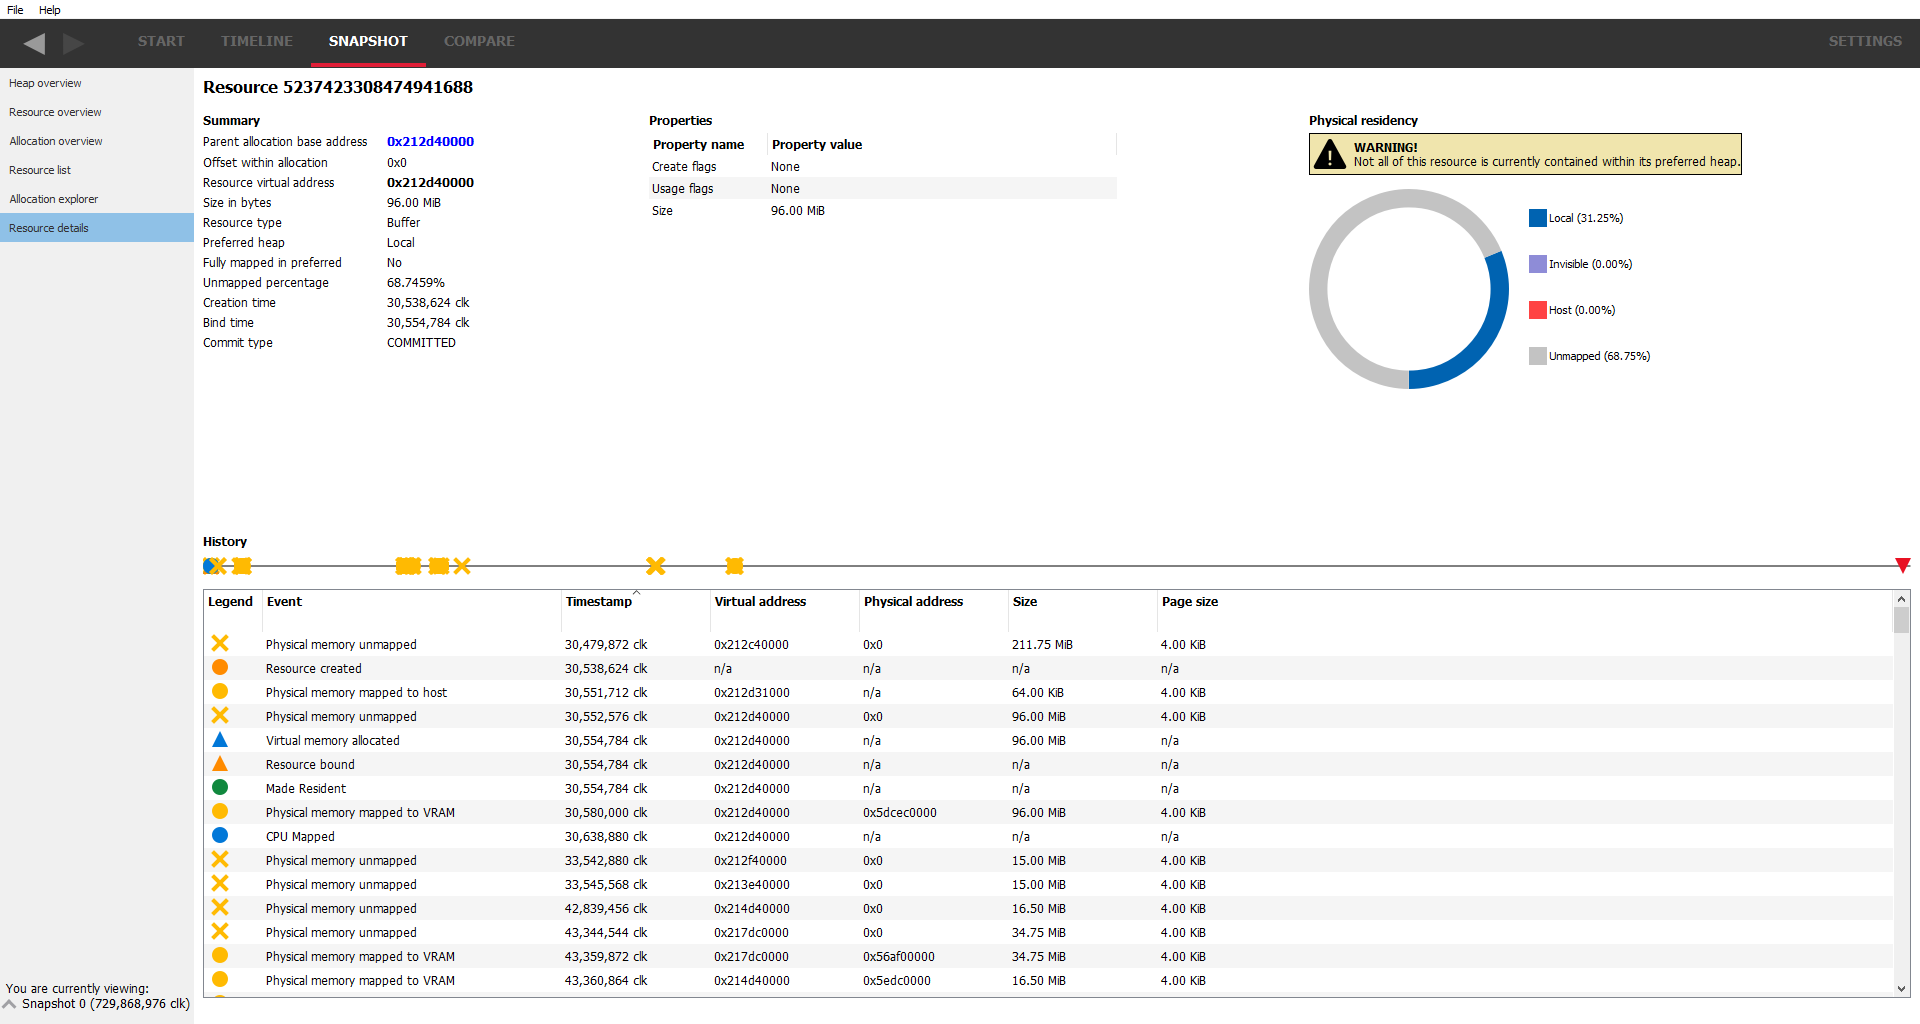
AMD Radeon™ Memory Visualizer (RMV) is a tool to allow you to gain a deep understanding of how your application uses memory for graphics resources.
By instrumenting every level of our AMD Software: Adrenalin Edition™ driver stack, AMD RMV is able to understand the full state of your application’s memory allocation at any point during your application’s life.
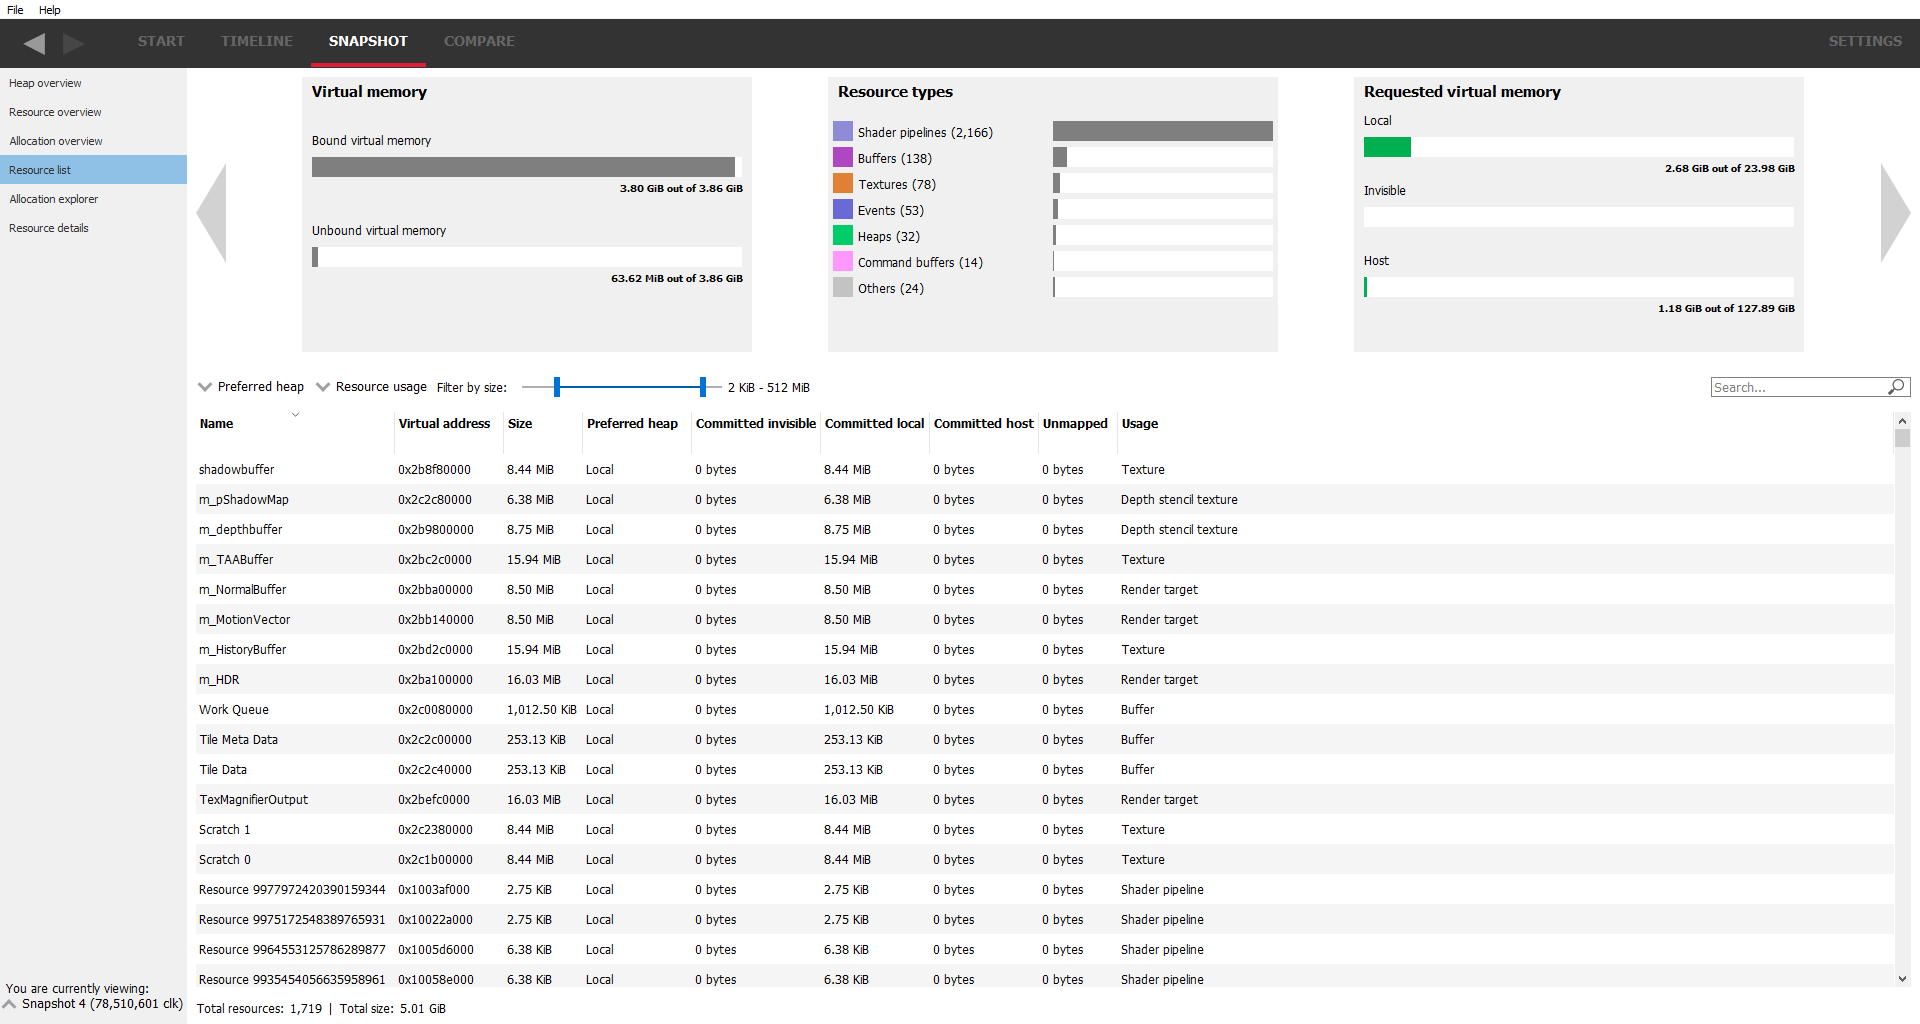
The quick, simple interface tells you if you are over-subscribing a heap, and how the driver stack has reacted. Quickly find resources which are not in the optimal heaps.
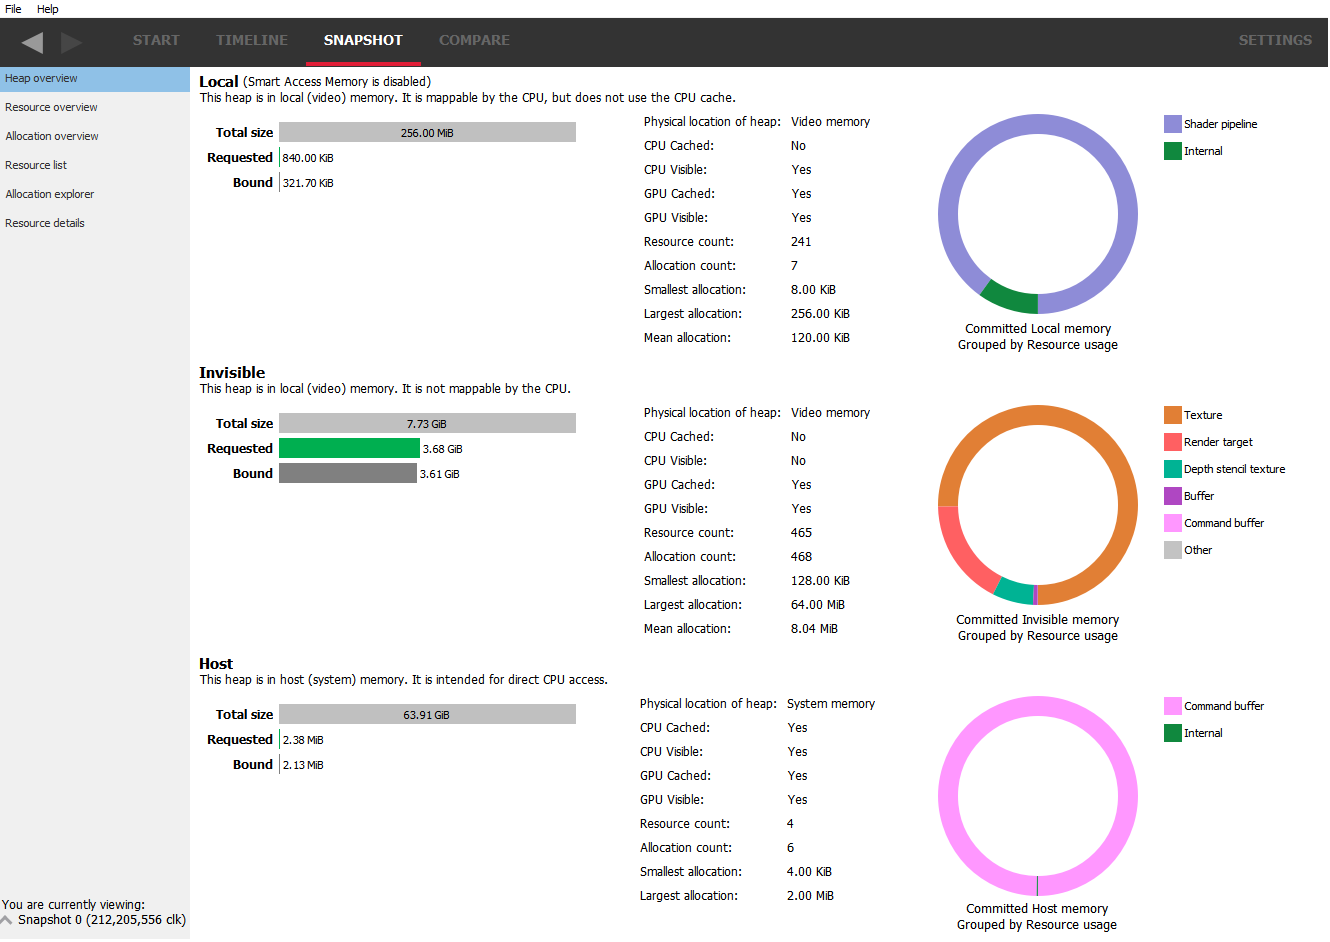
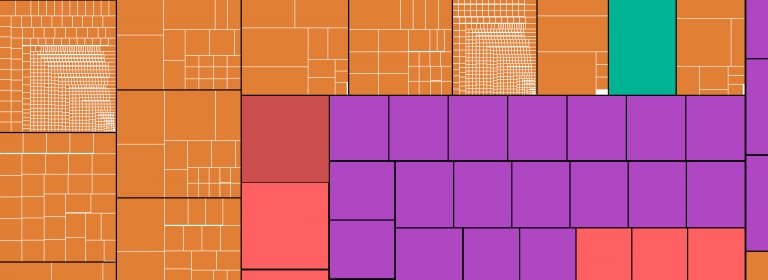
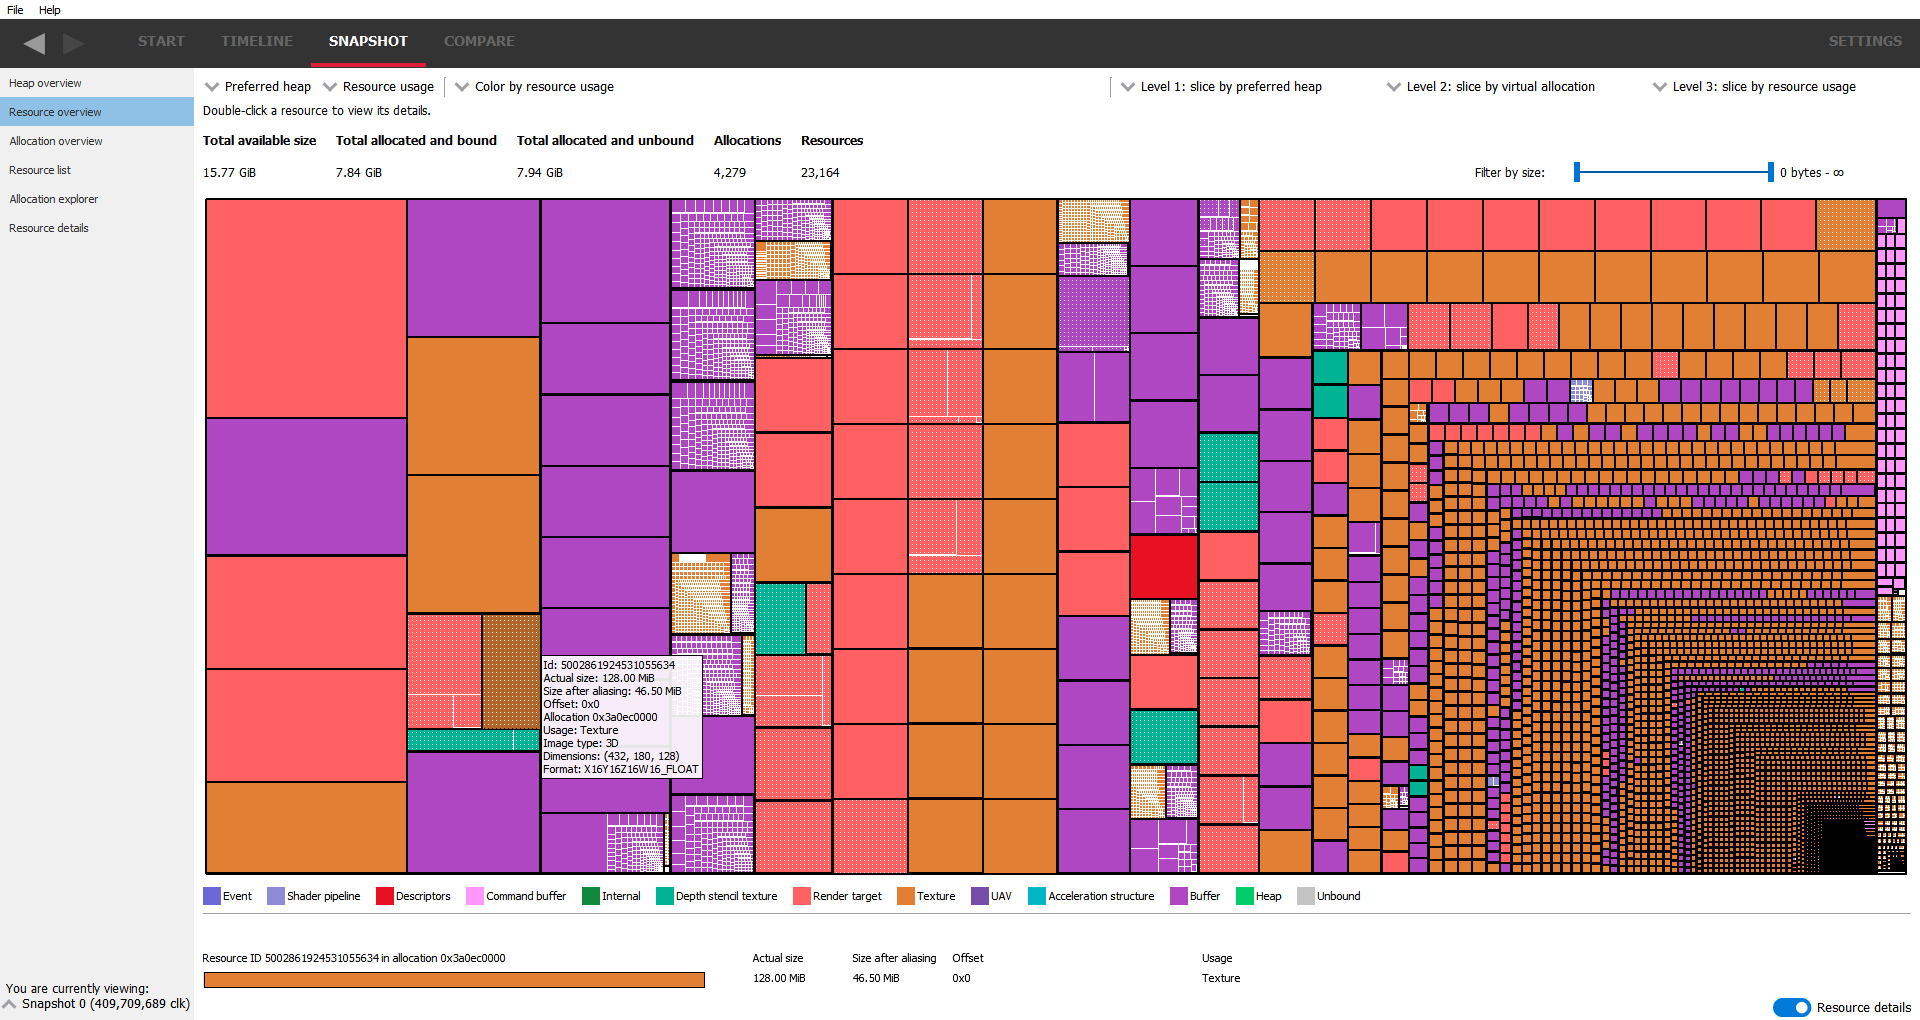
Understand which resources require the most memory, which heaps they are in, and how your heaps are sub-allocated. Rapidly detect patterns in how your application is behaving.
Use the DirectX® 12 or Vulkan® API to customize the names of your resources then search and view the details in the Resource list.
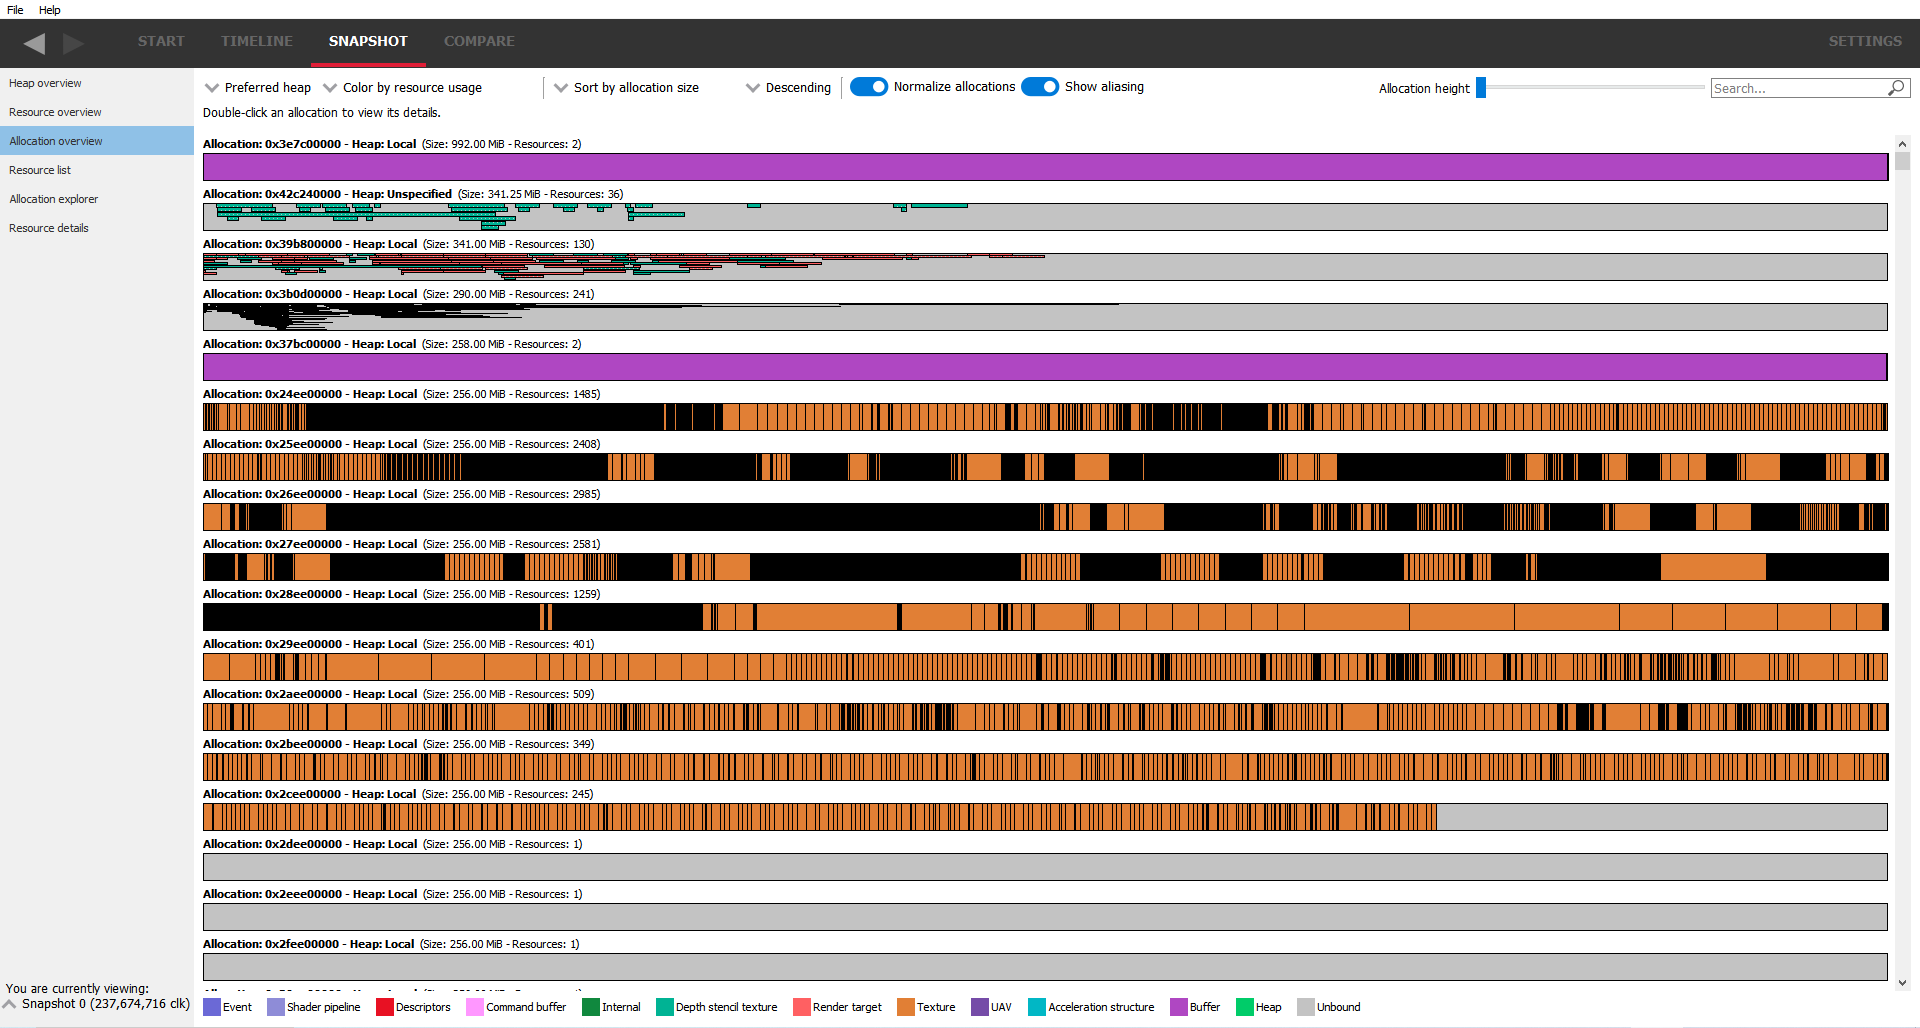
Look for fragmentation, and understand how you are managing memory in each heap you create. Understand the balance between dedicated and placed resources.
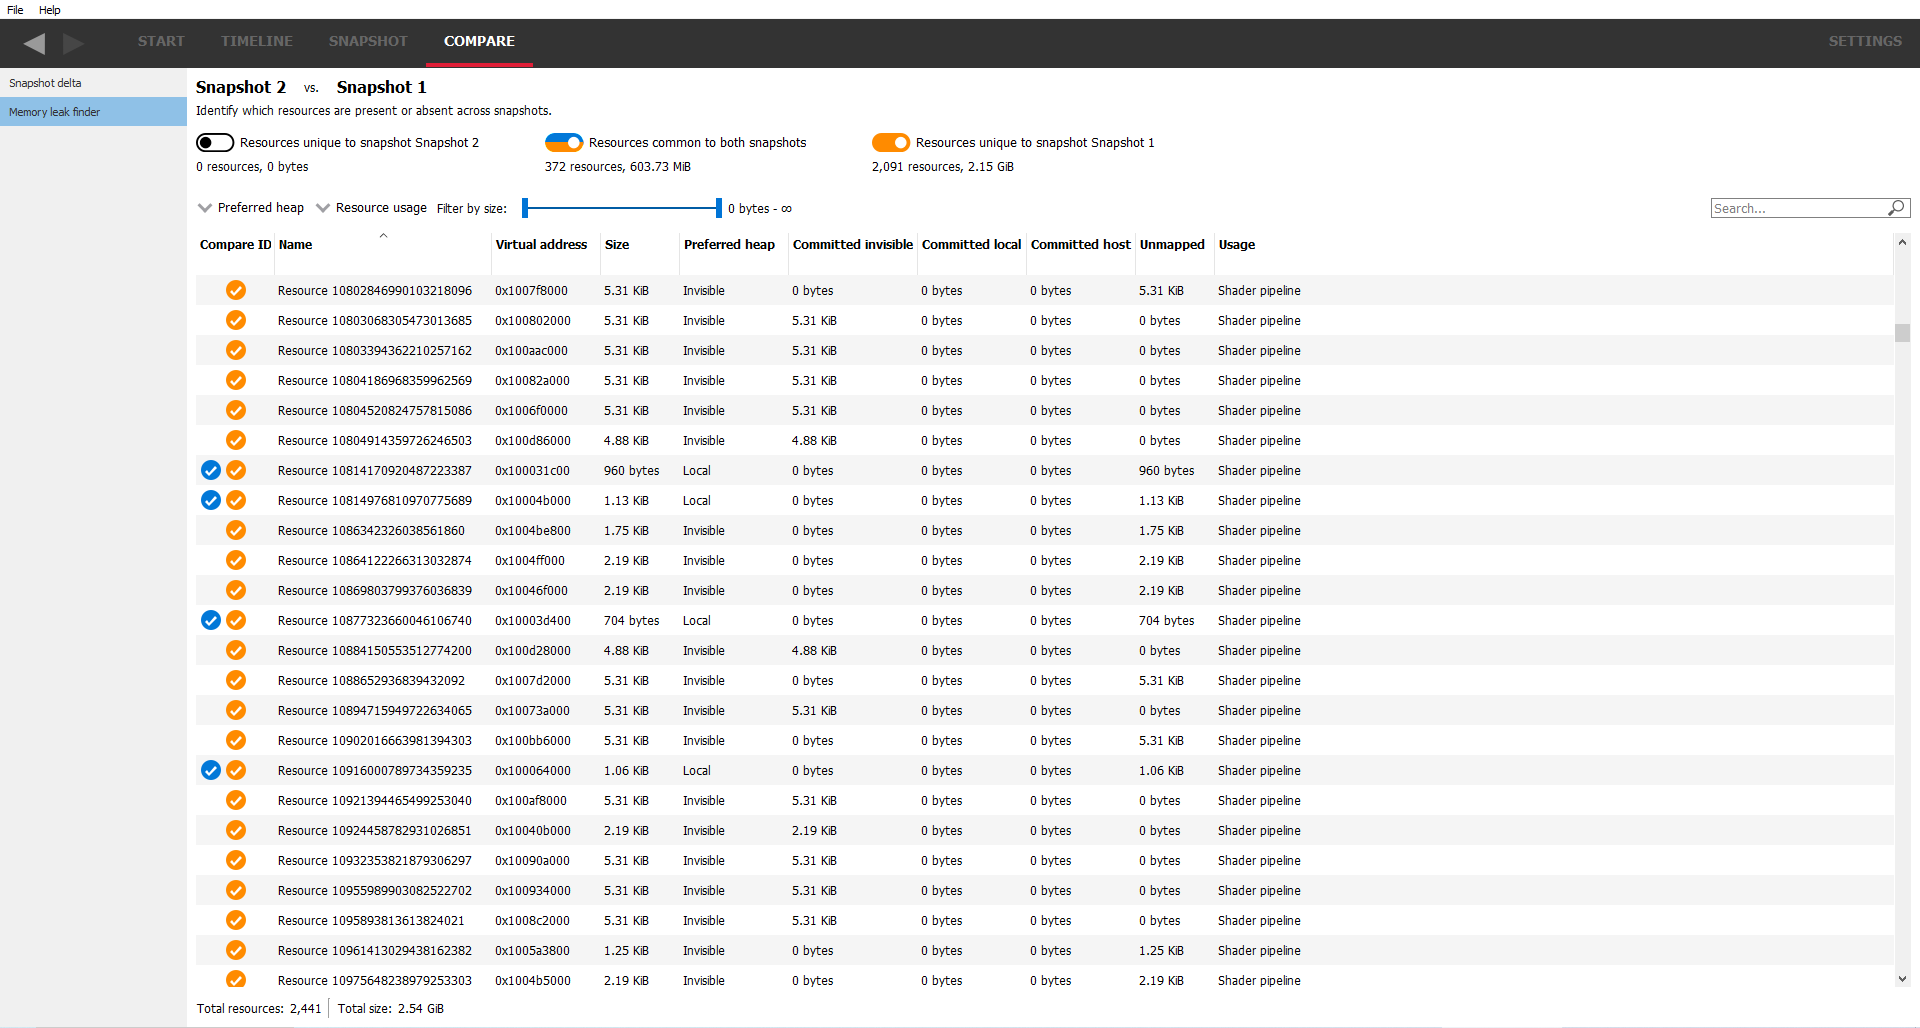
Easily find memory leaks in your application by comparing snapshots.
Dig into how resources have been treated over their lifetime. Understand how the operating system and driver have managed the physical backing for your resources, including paging during times of heap over subscription.