Radeon™ Memory Visualizer (RMV) is a tool to allow you to gain a deep understanding of how your application uses memory for graphics resources.
Radeon™ Memory Visualizer (RMV) is a tool provided by AMD for use by game engine developers. It allows engineers to examine, diagnose, and understand the GPU memory management within their projects.
With the introduction of DirectX®12 and Vulkan®, memory became a resource that required explicit management by game engines. For years, graphics developers did not have tooling available to assist with this. RMV addresses the needs of engineers who need to know what their games are doing with memory at any point in time in order to solve problems.
In order to use RMV, you need to use a driver with appropriate support. Please refer to the RMV page to get the latest supported driver and package for RMV.
With RMV, we’re introducing our new Radeon™ Developer Panel (RDP), which changes workflow slightly from what you may be used to if you have previously used RDP for Radeon™ GPU Profiler tracing. It’s very similar, however has one significant change as we will outline below. If you are already familiar with setting up RDP 2.0, you can skip forward to “Running your application”.

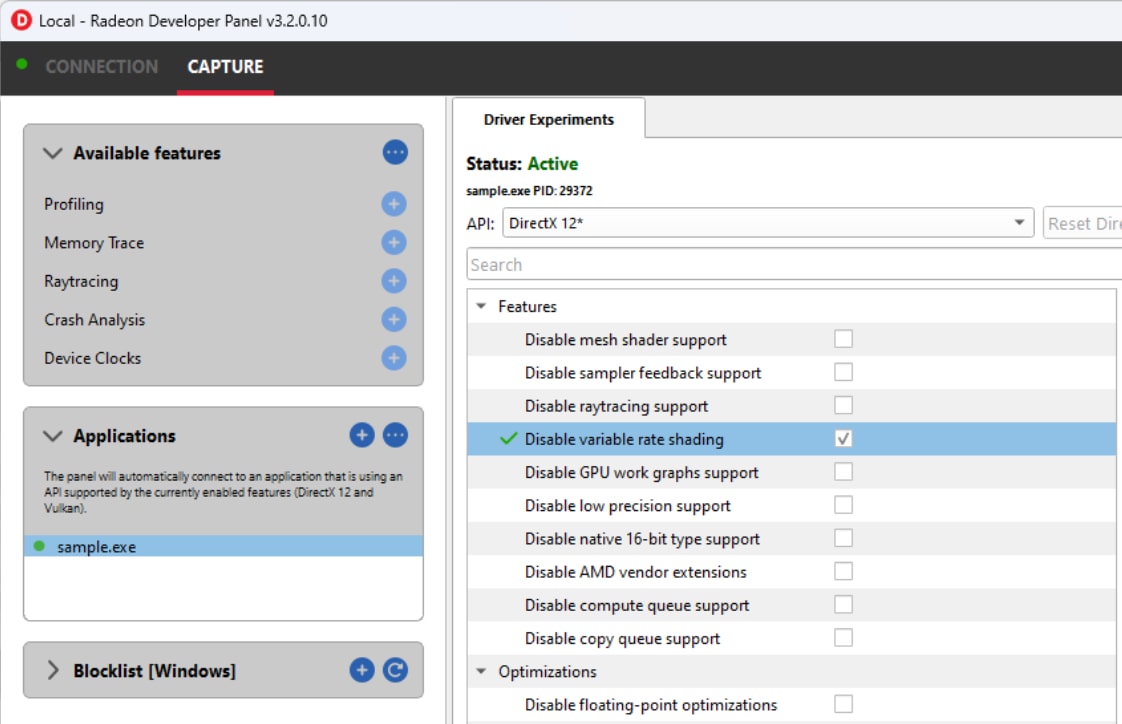
Run the Developer Panel, and allow it to pass the Windows® Firewall if prompted. Data is transferred via a network loopback interface, which is why you may see the firewall prompt. With the new Panel, you need to add the executable you want to trace via the system tab. Look up your application name and click Add so that it’s listed below in the My Applications list. It should have API set to Auto, with Workflow set to Memory Trace.

The graphics application we are running is a Vulkan® Radeon™ Cauldron sample. We select a few different scenes, before exiting from it. You will know if memory tracing is active from the Radeon™ Developer Panel HUD which appears over the rendering window. It should state ” RMV Tracing: Active “. If you do not see this, ensure the correct application path is listed in the Application tab of the Radeon™ Developer Panel, and that you are using a Radeon™ Graphics Driver package which supports RMV.

When you exit the app, a memory trace will be automatically dumped and listed in the Recently collected traces area. Double clicking should open the trace – if it does not, ensure the path to Radeon™ Memory Visualizer is correct, which is listed on the same panel under Trace settings.

Upon opening the trace with RMV, it will bring you to the TIMELINE overview. It shows resource size over time, and the color of blocks show the type of resource. Using the drop-down combo box, you can select to show resource counts instead of sizes – if that is what you are more interested in. For now, we keep it at Resource usage size. Given this is a timeline, it is very easy to gauge what is happening:

In order to inspect memory further, we need to create a Snapshot. A snapshot is a moment in time, derived from what has been recorded by the memory trace up until that point. It allows for in-depth analysis of our resources, memory usage, and importantly – how those resources are mapped onto physical memory.
Right click the timeline when you want to further inspect, selecting Add snapshot at . This will be created and added to the snapshot list under the timeline. Double-click a snapshot to open it.

The first thing you will see is the Heap Overview. This lays out basic information about the makeup of memory at this point. It shows Local, Invisible and Host memory heaps and some specification about the heaps, such as how CPU and GPU caching is handled between them. There is also minimum and maximum allocation data listed, along with a donut chart of what resource types are allocated within the heap. From here you can instantly see where most of your resource types reside.

This window can also show warnings around heap oversubscription issues. These should be taken seriously, and steps taken to mitigate high memory utilization in order to prevent stuttering and other issues associated with oversubscription.

The next area is the Resource Overview subwindow. This tries to show a map of resources which can be colored or filtered by various statuses. It is a good view to instantly see what is taking the most memory, but also can be used to find possible issues regarding residency.

As an example, we may want to see if there are any resources being used which are not fully mapped to VRAM. For this, Command Buffers are an easy example. We select only Command buffer from the Resource usage drop down and Color by not all in preferred heap.
An important aspect about memory to understand is that parts of resources can be located where we want them to be, and other parts paged out, or not mapped at all. When we set these resource options, we see there are three Command Buffers listed, but two are red in color signifying they are not fully in their preferred heap location. Double-clicking the first one brings us to the Resource details pane, with a warning immediately showing us that not all the resource is in the preferred heap which was requested on creation. Only 53% of this resource was mapped to the preferred HOST heap, with the rest unmapped.

In this case, our command buffer is only being used within the mapped area. But if this a render target for a rarely used effect, we may see performance implications like a stutter when the effect was used.
Another useful visual aid are resources displayed with a stippled/dithered effect. This means the resource is aliased and sharing memory with another resource.

The last views are for exploring allocations, and the resources that exist within them. Here you can see information about how your allocation strategies are working – among them, fragmentation levels of resource memory within allocations.

One of the more interesting features RMV has is snapshot comparisons. This allows you to select two snapshots in the timeline view and compare the memory state between them. This can be very useful for debugging issues before and after asset loading or changing of gameplay states.
A basic test is to run your game and leave it for a long time. In the example below, we have run our Vulkan® test for nearly 20 minutes – but you can leave it longer if need be.
An important aspect of RMV capture is that it is a low-overhead process. You can run your title for hours and the trace file output will only amount to a few hundreds of megabytes. Memory issues can take long times to appear, so it was an important consideration in the design that you can capture and perform analysis on very long runs.

In this trace, we see the timeline looks static apart from a quick loading spike in the first seconds. Given our trace was taken with our Cauldron GLTV sample just loaded into a scene with no other changes, this is what we would expect. Any increase in memory requirements in this test could be a potential bug. To confirm this, we can take two snapshots – one just after loading, the other near the end of our test – and compare them.

Selecting the two snapshots, right-clicking can take you to the COMPARE window. This view shows a delta comparison initially, with basic changes in resource types and memory. In our example, there is no change to virtual memory, or to resource counts. This confirms our game has not increased its memory footprint during the 20-minute capture.
Another test we can do is to load into scene A, back out into scene B, and then reload scene A for a second time. After performing this in our example game and opening the RMV trace file, we can see the tell-tale signs of scene loading and teardown from our timeline view. After the loading spikes, resource sizes remain stable while we leave the application to render the static scene for some seconds. We can use the compare window to ensure our second loading of scene A creates the same number of resources as the first load – and that there are no dangling resources left which over from previous scenes, which in time could lead to memory leaks and errors.

We create our snapshots at relevant points and compare them again. For this example, we will not delve into the actual memory size delta, but the resource type delta is important. In our case, we can see there are two more Render targets – why? Let us find out!

There is another view within the COMPARE mode in RMV – Memory leak finder. This allows you to easily identify common resources between snapshots, but also resources which appear only in one of them. We can also narrow down the resource usage to list only Render targets, as we know the delta for those was +2.

When we do this, we get a list of resources. At this point, we should mention that RMV has support for the Vulkan® VK_EXT_debug_util extension. If your app uses this to name Images, the names will appear in the resource list instead of numeric IDs – greatly aiding engineers having to track down these issues.
Ones that have two tick marks under compare ID are those which exist in both captures, so we are not interested in those. However, when we also include Resources unique to Snapshot 1 we can see two extra entries for “BlurHorizontal” that only exist in the second snapshot. These are our additional Render Targets!

Looking in the code for our example, we find where the BlurHorizontal render target is created. It’s a temporary render target for our blur effect. Knowing from our snapshot compare that this resource is not being destroyed as required, we see from our destructor code that the OnDestroy() call for this resource is missing. We add this back in and on a second memory trace we will see that the leaking render target resources are no longer listed.
In real game engines this part of tracing the leak can be harder, but RMV gives you a huge head-start that was not available to graphics engineers previously. You may also have noticed there are additional descriptor resources being created – which we can also narrow down in the same way.
There are many common issues seen in games which can be seen using RMV.
Oversubscription is a term most engine developers will already know; given the need to manually manage your games memory with the new graphics APIs, engineers are comfortable with the idea that you should not be attempting to allocate more VRAM than what is possible. However, there will always be situations where a bug exists which makes oversubscription a reality, and with RMV you can identify and debug these situations.

In the Heap Overview pane, immediate oversubscription issues will lead to warnings in the relevant heap, be it Local, Invisible or Host. When you see this warning, first making sure you are running your game at a quality level suitable for the given GPU and VRAM which is available. Sometimes there are configurations missed, especially on hardware with edge-case specifications.
In cases where a bug is suspected, we can go into the resource overview page and allocations page. You may find allocations that are significantly underutilized, which contribute to the heap oversubscription, or too many temporary RT’s are being created. RMV allows you to investigate. The timeline is also useful here, it is obvious when memory is increasing quickly during level loading but may show slower increases during gameplay which lead to issues.
You can check unbound resources, and limit to a specific heap in the resource overview window. Here we can see at least 50MB of unbound local resources and investigating these will start to bring this oversubscription under control.

In some circumstances we have seen games make tens of thousands of allocations, predominantly with a single resource within them. Vulkan® has this issue more than DirectX®12, as the number of allocations is limited which forces the developer to sub allocate. Our Vulkan® Memory Allocator library can help with management of this.
However, DirectX®12 can still have issues. Creating many committed resources which are marked resident on create and only evicted when destroyed can leave memory budget on the table. Viewing the Allocation Overview and seeing many tens of thousands of single Allocation-Resource relationships can be a sign that using sub-allocation and placed resources could be worthwhile. Our D3D12 Memory Allocator can help in these situations.
This can happen in situations whereby heaps that we wanted our resources to be in are oversubscribed, so we get placed into another heap. In this example here, we see a Local resource be pushed out to Host and be mapped in and out throughout our timeline. This can lead to hitches, so make sure to investigate this behavior.

It has been shown that RMV allows developers to see and ultimately fix a wide range of memory resource related issues. It is a tool which has been sought after for many years since the introduction of explicit graphics APIs which require manual control of memory, and we are very happy to see many game development studios using it in their development processes.
We hope that use of RMV will aid game developers in creating the diverse and rich virtual worlds of tomorrow – with hitch-free experiences for players across the full range of available graphics processors we offer.
Thank you for reading. For more information on the tools we offer graphics developers, please visit our GPUOpen Tools page.
Footnotes
DirectX® is a registered trademark of Microsoft Corporation in the US and other jurisdictions. Vulkan® and the Vulkan® logo are registered trademarks of the Khronos Group Inc. Windows is a registered trademark of Microsoft Corporation in the US and other jurisdictions.
© 2020 Advanced Micro Devices, Inc. All rights reserved.