AMD Radeon™ Developer Panel
The RDP provides a communication channel with the Radeon™ Adrenalin driver. It generates event timing data used by the Radeon™ GPU Profiler (RGP), and the memory usage data used by the Radeon™ Memory Visualizer (RMV).
We are happy to announce a new feature-packed release of the Radeon™ Developer Tool Suite. This release includes the following new versions of the tools contained in the suite:
Let’s review the highlights of this release:
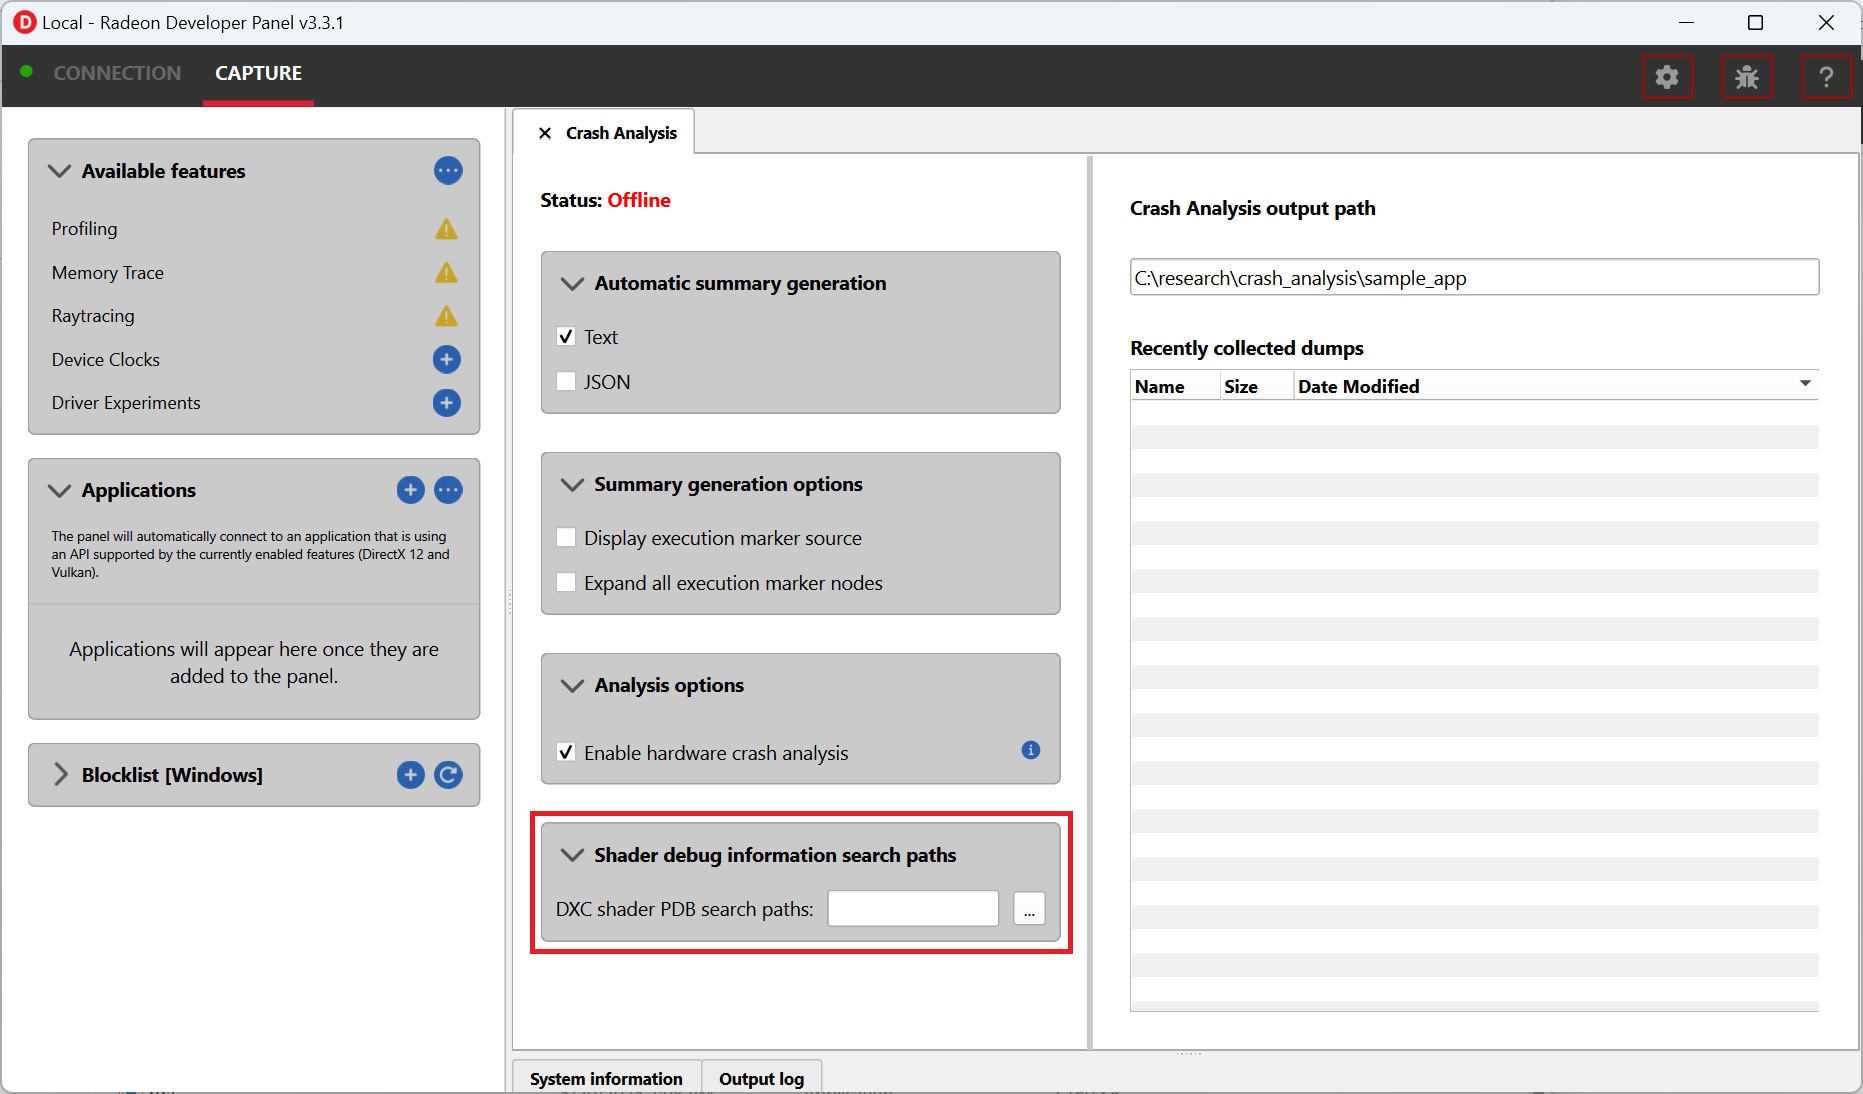
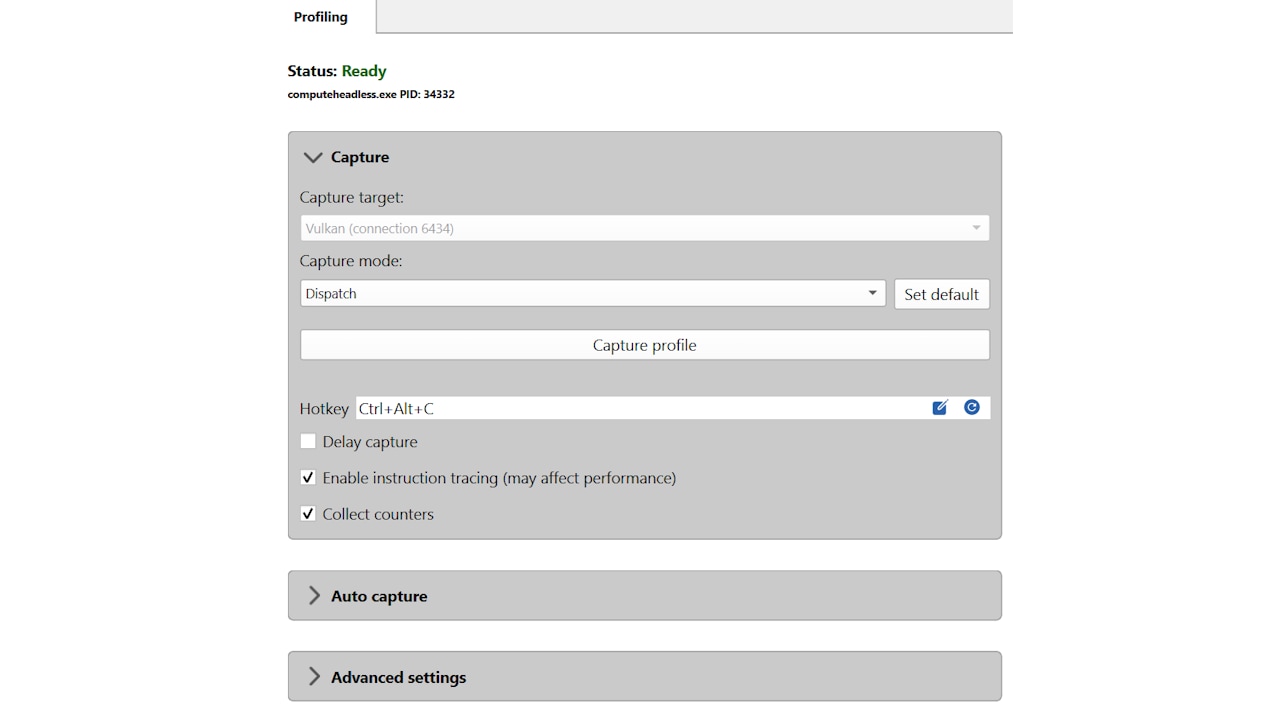
This release introduces a powerful new feature that lets you change the behavior and performance characteristics of your application without modifying its source code or its configuration. This is done using Driver Experiments that modify the low-level behavior of the Radeon Adrenalin™ driver. These experiments control features like raytracing or mesh shader support, compiler optimizations and more, and can be useful in debugging crashes and performance bottlenecks. For more details about this feature see our blog post.
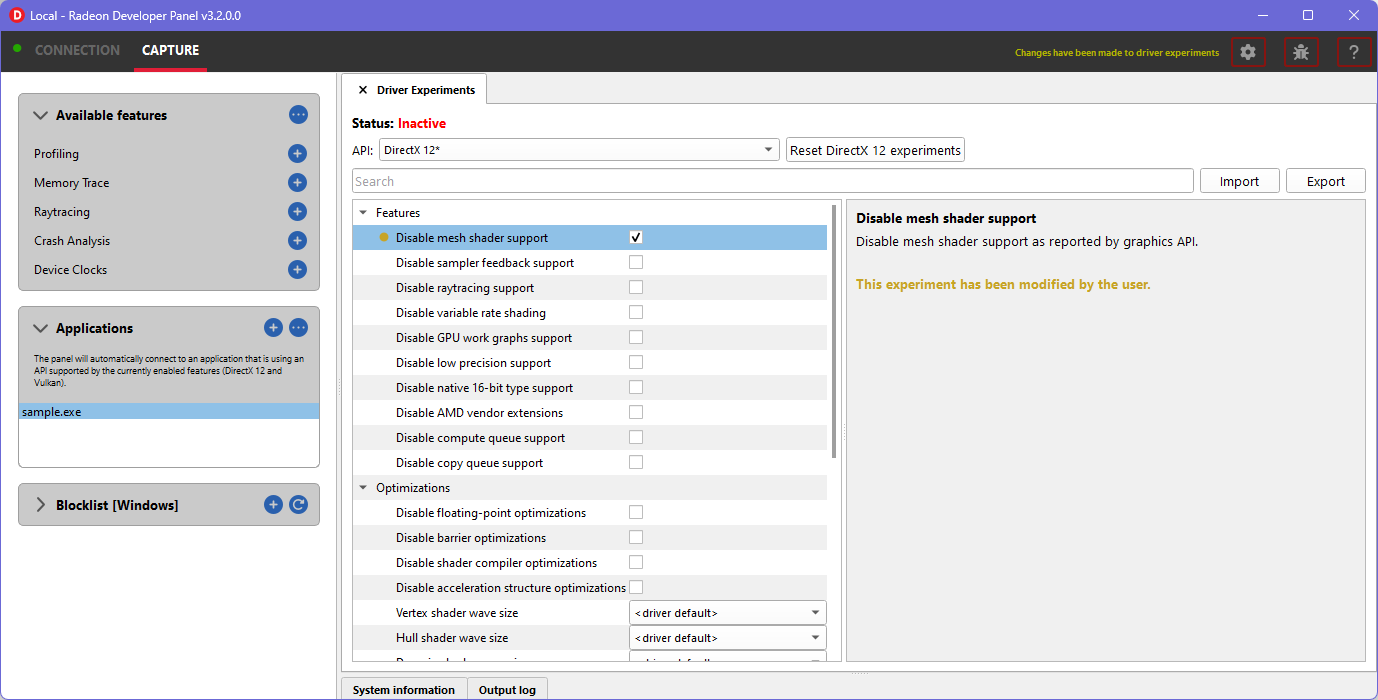
Figure 1 – Activating Driver Experiments in Radeon Developer Panel
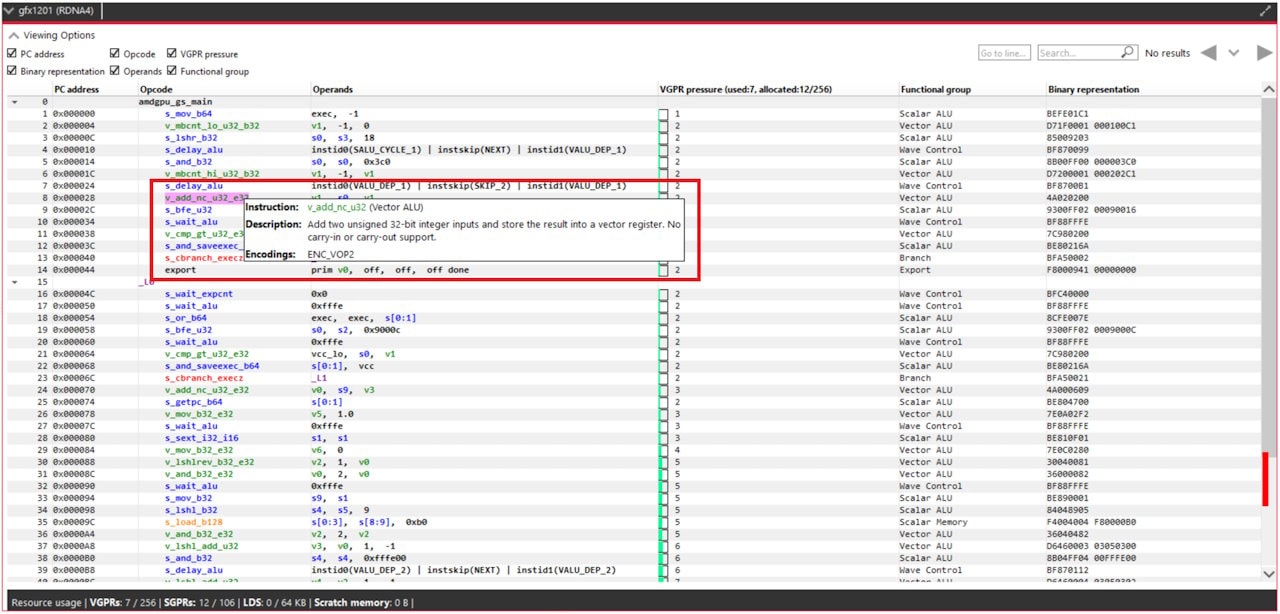
With this release, all the suite tools include dark mode support in their graphical user interface, allowing the user to choose between Light and Dark themes (or have the UI follow the OS theme). To control this behavior, visit the tool’s settings menu.
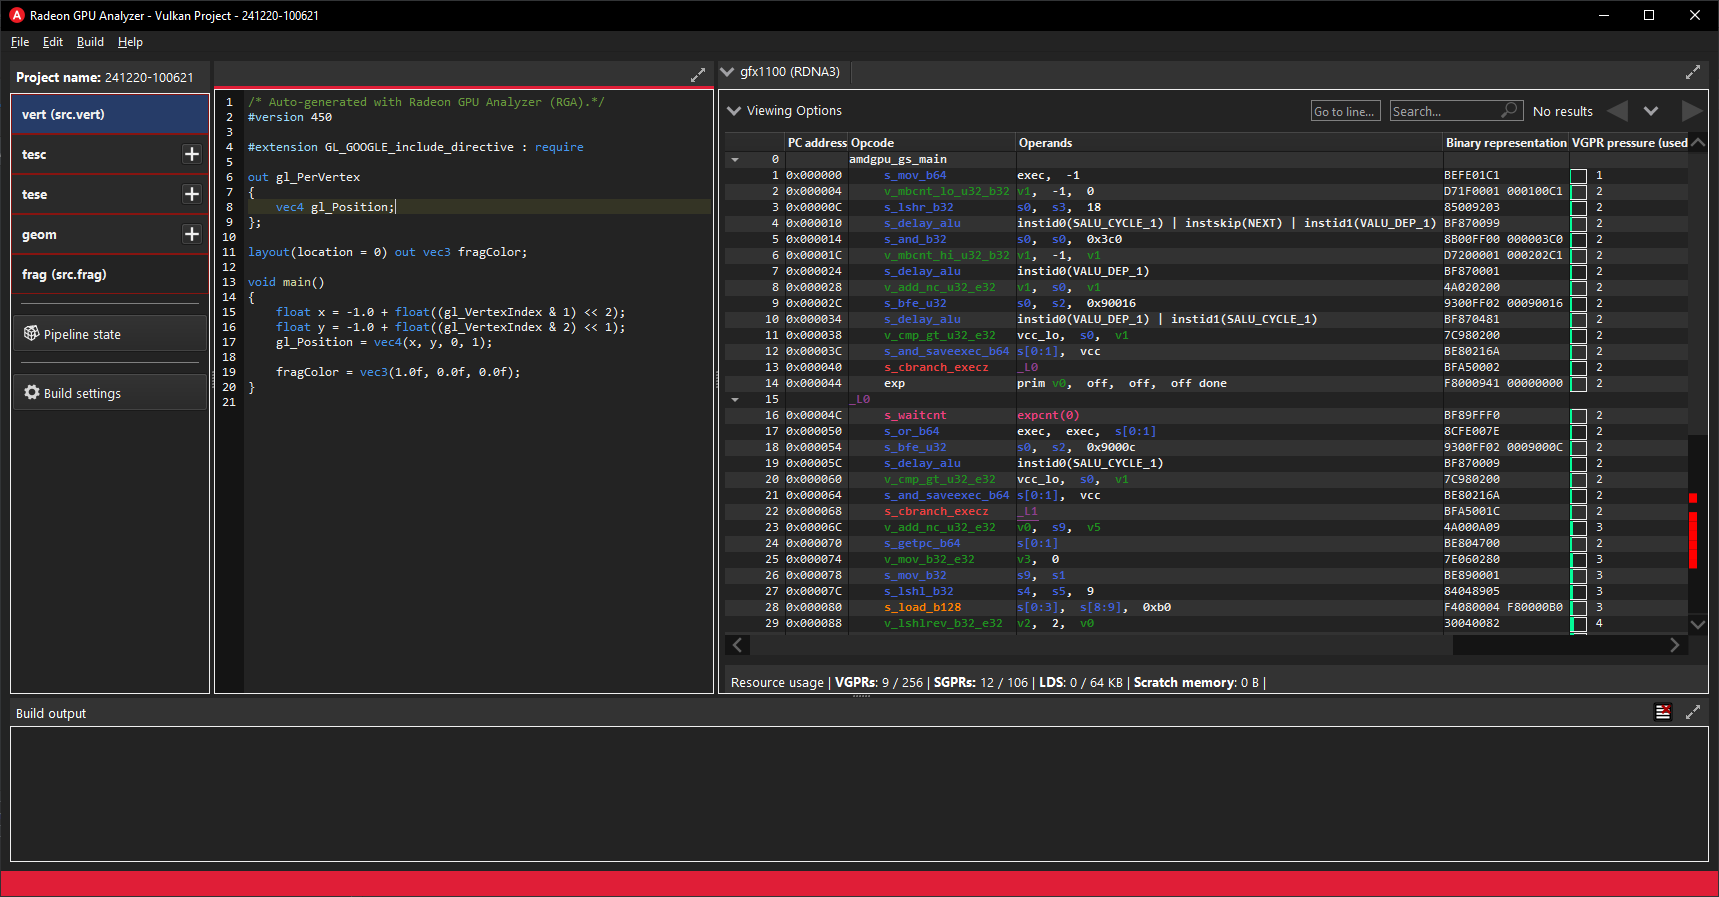
Figure 2 - Dark mode in Radeon GPU Analyzer
With Radeon Adrenalin™ driver version 24.9.2, the AMD compiler includes changes to the way raytracing state objects are being compiled. Use the new Radeon Developer Tool Suite to ensure compatibility with these raytracing compiler updates. Each tool will include specific details on this topic in its release highlights.
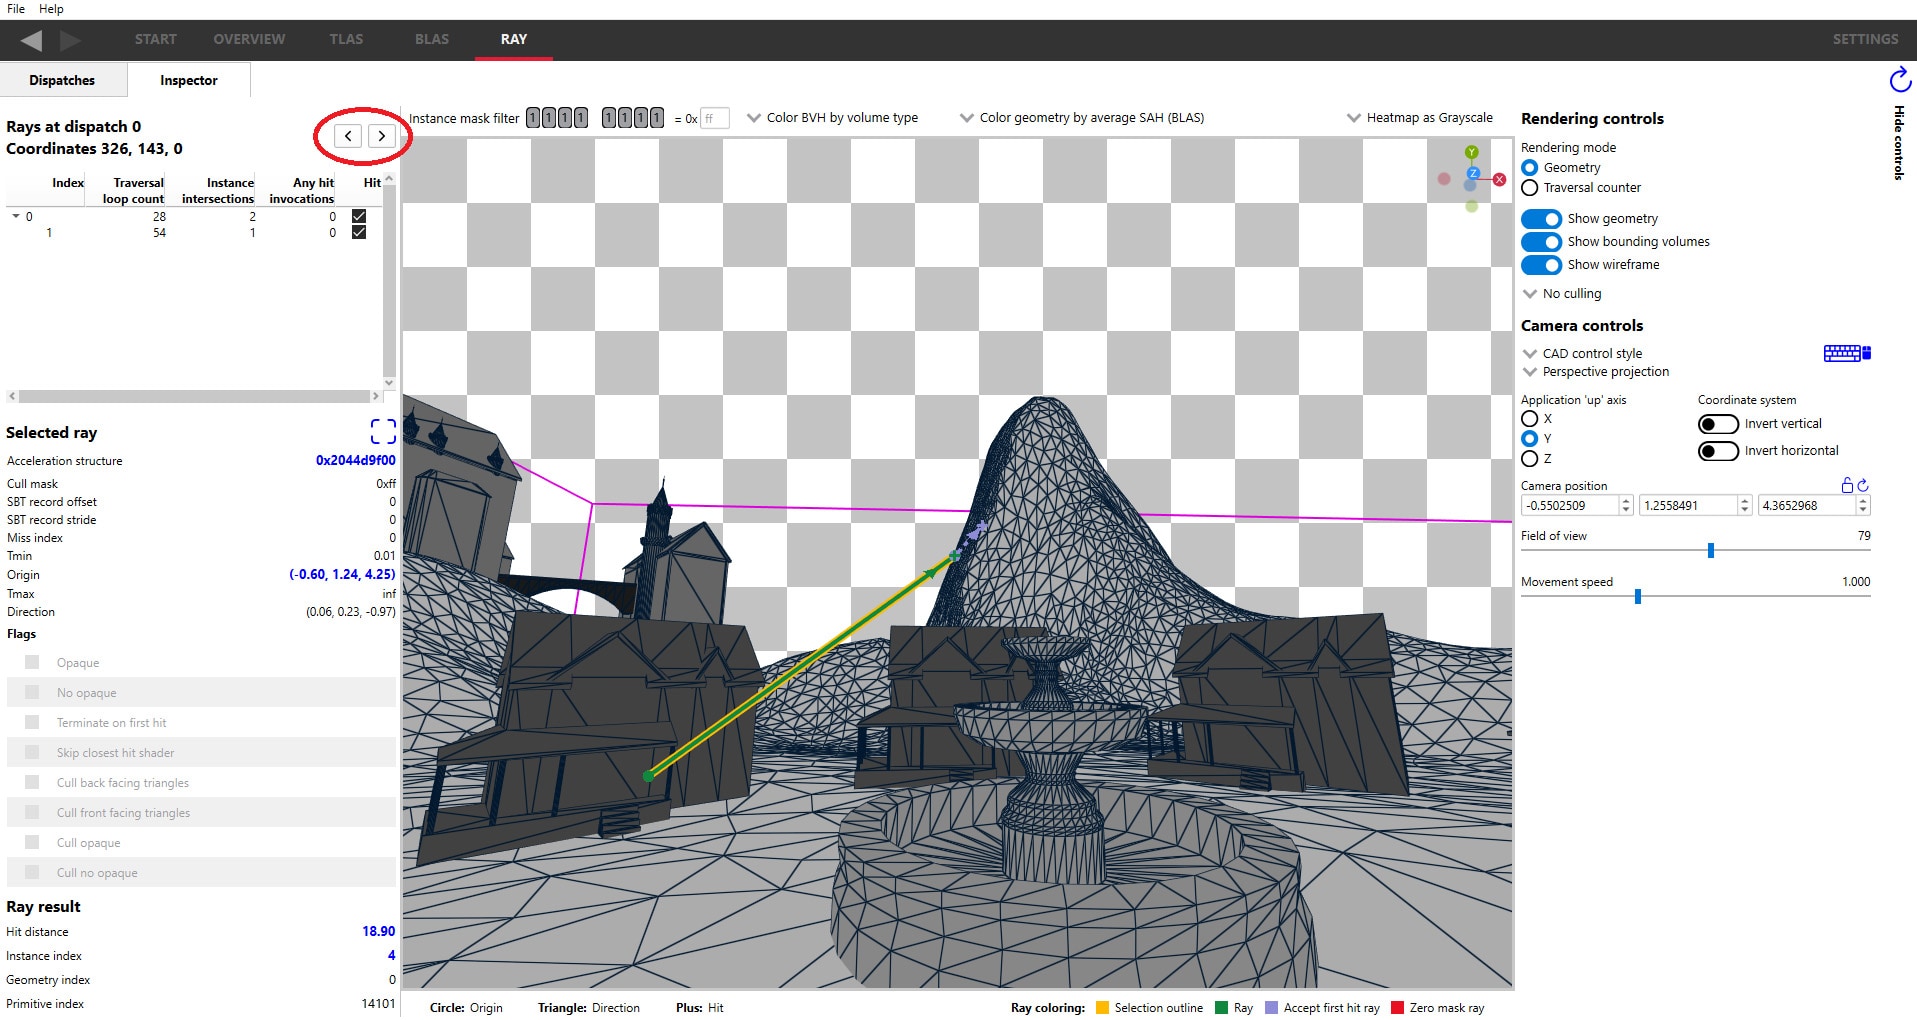
With RRA v1.7, it is now possible to name your ray dispatches in the same way that render passes are named. This enables you to see at a glance which ray dispatches in RRA correspond to which dispatches in your source code. Learn more about this new feature in this blog post.
With RGP v2.3, when profiling an application where multiple indirect draw calls are launched from a single ExecuteIndirect D3D12 call, the event tree view in the Event timing and Pipeline state panes will logically group the individual draw calls under the same parent node. The Wavefront Occupancy and Event timing panes also now have a “Color by indirect command” mode that can help you visualize which waves and which events were launched from the same ExecuteIndirect call.