AMD Radeon™ GPU Detective
AMD Radeon™ GPU Detective (RGD) is a tool for post-mortem analysis of GPU crashes. RGD can capture AMD GPU crash dumps from DirectX® 12 apps.
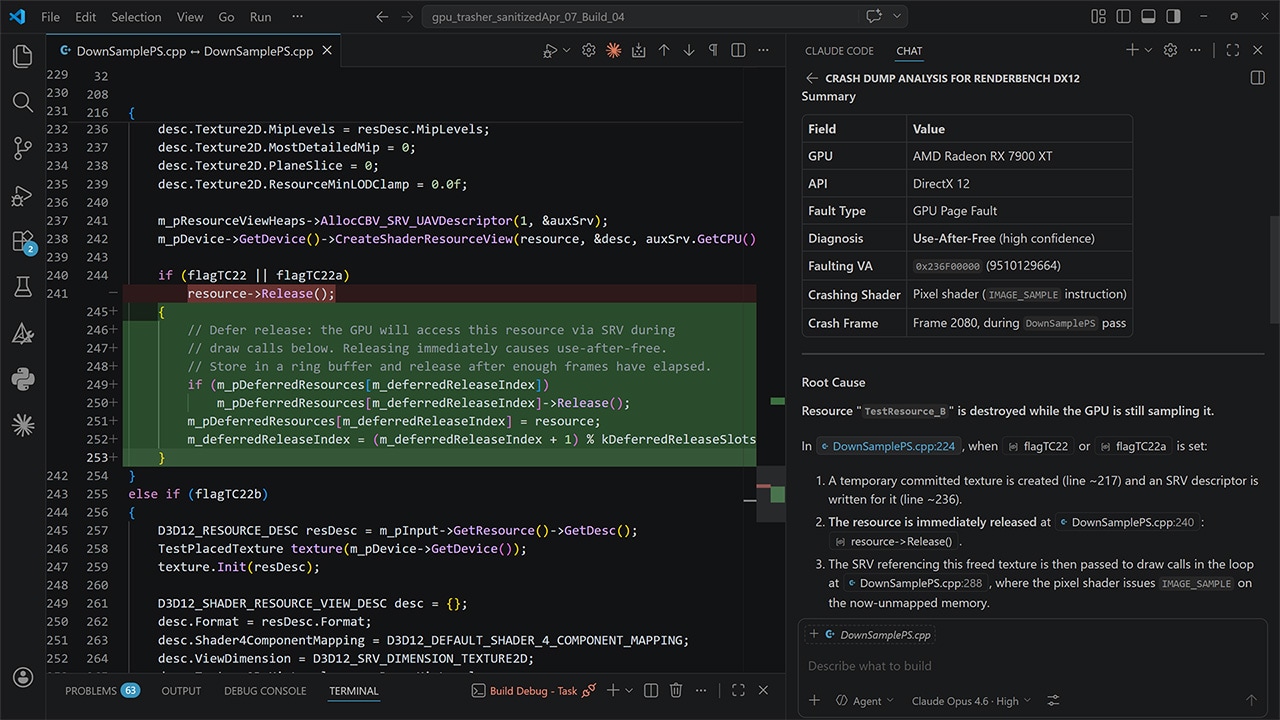
With version 1.5 of AMD Radeon™ GPU Detective (RGD), the AMD tool for post-mortem analysis of GPU crashes, you can now use the debug information that is produced by the Microsoft DirectX® Shader Compiler (DXC) to augment the crash analysis output file with helpful information about offending high-level shaders, including HLSL source code.
AMD RGD v1.4, released earlier this year, introduced a powerful new feature: Hardware Crash Analysis. When enabled, AMD RGD captures low-level details about the GPU’s hardware state at the time of a crash and enhances the Crash Analysis output file with meaningful insights derived from that data.
Here is a sample disassembly of an offending shader that is presented by AMD RGD v1.4’s Hardware Crash Analysis feature for a page fault crash case:
Disassembly=========== . . . s_mov_b32 s13, 0xfff000 // 0000000003B0: BE8D00FF 00FFF000 s_mov_b32 s14, 0x64500000 // 0000000003B8: BE8E00FF 64500000 s_mov_b32 s15, 0x80000000 // 0000000003C0: BE8F00FF 80000000 s_clause 0x8 // 0000000003C8: BF850008> image_sample v[8:11], [v0, v6], s[4:11], s[12:15] dmask:0xf dim:SQ_RSRC_IMG_2D// 0000000003CC: F06C0F05 0C010800 00000006 <-- ***PAGE FAULT SUSPECT (128 waves)*** image_sample v[12:15], [v4, v6], s[4:11], s[12:15] dmask:0xf dim:SQ_RSRC_IMG_2D// 0000000003D8: F06C0F05 0C010C04 00000006 image_sample v[18:21], [v1, v6], s[4:11], s[12:15] dmask:0xf dim:SQ_RSRC_IMG_2D// 0000000003E4: F06C0F05 0C011201 00000006 image_sample v[22:25], [v0, v2], s[4:11], s[12:15] dmask:0xf dim:SQ_RSRC_IMG_2D// 0000000003F0: F06C0F05 0C011600 00000002 image_sample v[26:29], [v4, v2], s[4:11], s[12:15] dmask:0xf dim:SQ_RSRC_IMG_2D// 0000000003FC: F06C0F05 0C011A04 00000002 . . .As shown in the snippet above, AMD RGD displays the AMD RDNA™ architecture disassembly of the shader that triggered the page fault and highlights the offending instruction.
Starting with version 1.5, you can leverage debug information to surface even more actionable details about the shaders that were in flight during the GPU crash:
These details should make it easier to identify the high-level shader that caused the crash.
First, before capturing a crash dump, make sure that Hardware Crash Analysis is enabled in AMD Radeon™ Developer Panel (RDP) to collect low-level information about the offending shaders. This information is being used to correlate the in-flight shaders to their debug information.
DXC can generate debug information that contains the high-level shader source code in 3 ways:
-Zi -Qembed_debug): the debug information is placed in the same file that contains the compiled shader.-Zi -Qsource_in_debug_module -Fd <PDB output path>): a separate “PDB” file is generated containing the debug info.-Zs -Fd <PDB output path>): a separate, minimal, PDB file is created containing only the high-level source code and compile options.AMD RGD v1.5 supports all three debug information formats. All you need to do is point the tool to the path where the file containing the shader bytecode resides. This file will either:
To be clear, even when using separate PDB files, the path to the file containing the shader bytecode must be provided. That is because AMD RGD uses a two-step process to locate the relevant PDB file:
You can point AMD RGD to the search paths in two ways:
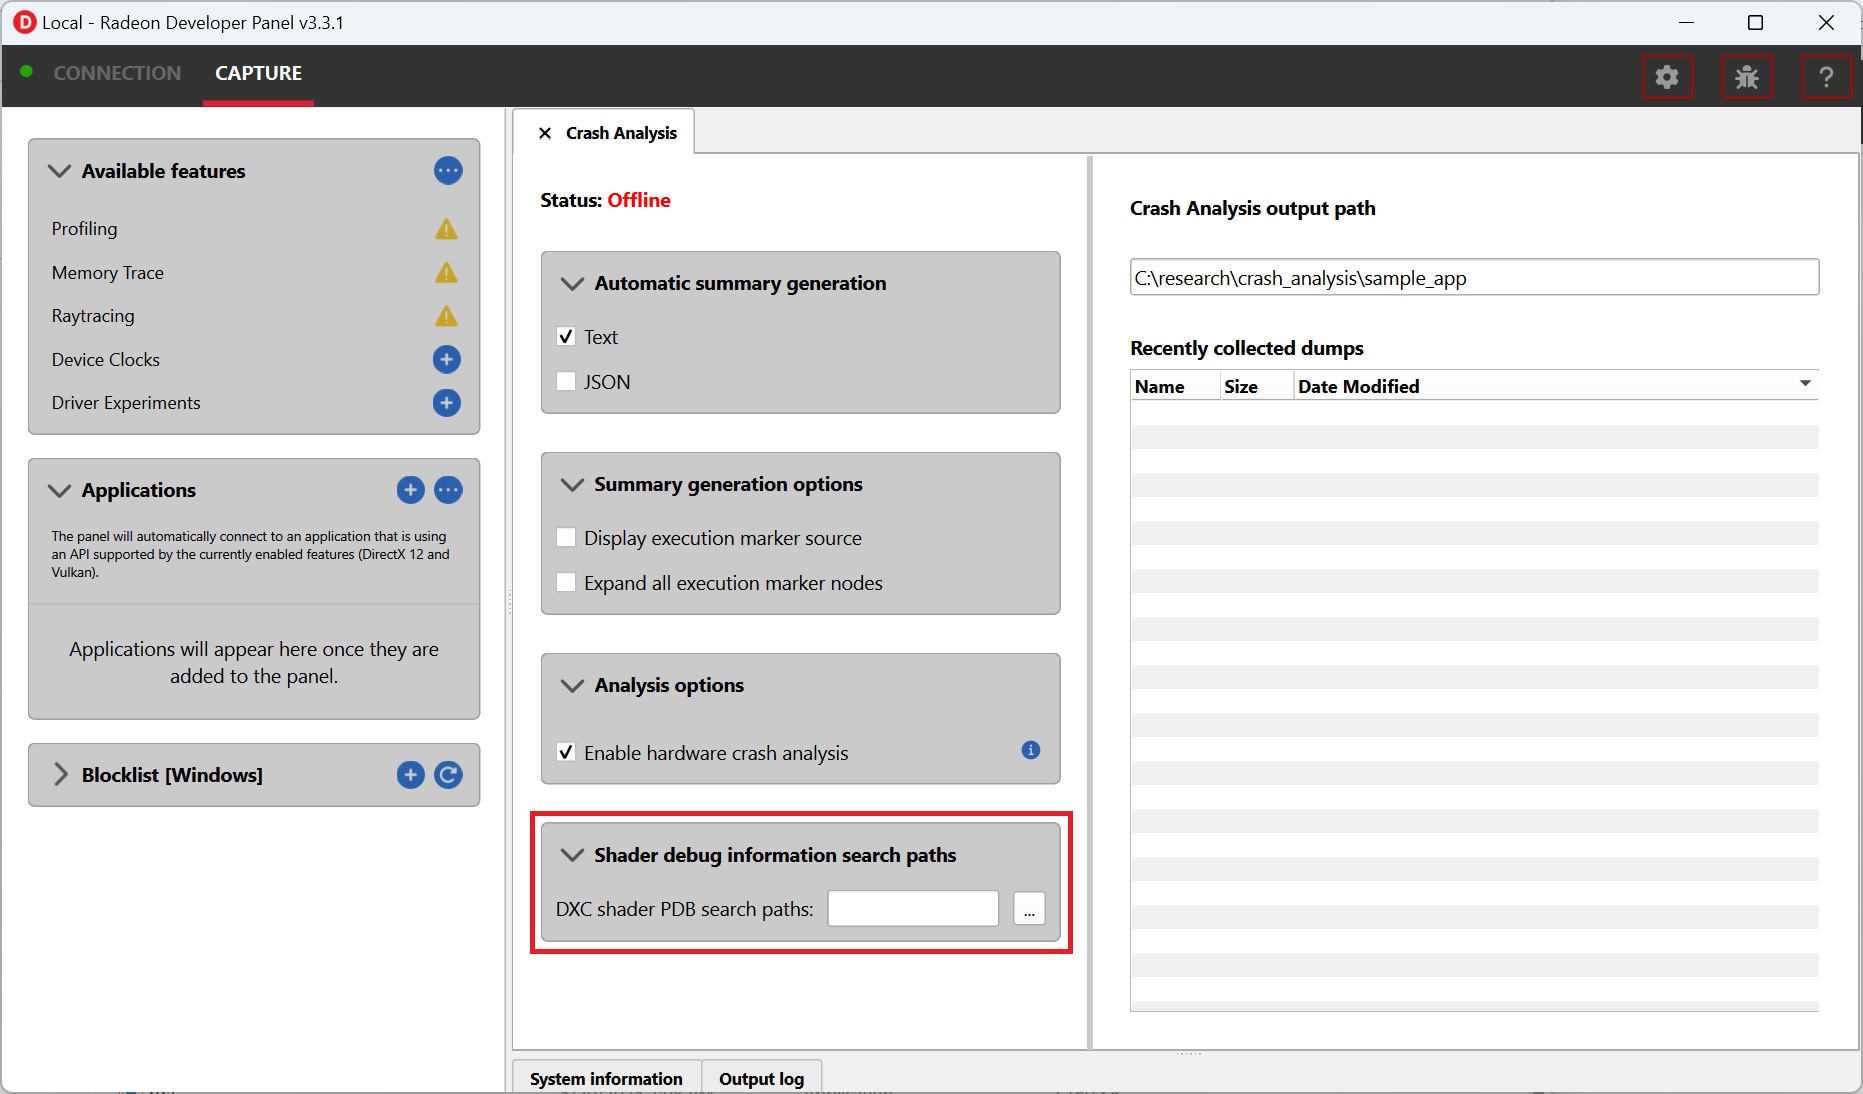
--pdb-path option.You can configure the debug information file search paths using the “Shader debug information search paths” UI in AMD RDP (highlighted in red in the screenshot below):
For information, visit the AMD RGD documentation on GPUOpen.com.
If the tool managed to locate debug information files for offending shaders, the following information will be added to the SHADER INFO section:
File name and Entry point name fields:Shader info ID : ShaderInfoID1API stage : PixelAPI PSO hash : 0xe3204f6b7ea39e98API shader hash : 0x9447bd598a9ffcb7022a22c95d0031c4 (high: 0x9447bd598a9ffcb7, low: 0x22a22c95d0031c4)File name : DownSamplePS.hlslEntry point name: mainPSShader IO and resource bindings section (below is a sample output for a Pixel shader):Shader IO and resource bindings===============================;; Input signature:;; Name Index Mask Register SysValue Format Used; -------------------- ----- ------ -------- -------- ------- ------; TEXCOORD 0 xy 0 NONE float xy;;; Output signature:;; Name Index Mask Register SysValue Format Used; -------------------- ----- ------ -------- -------- ------- ------; SV_Target 0 xyzw 0 TARGET float xyzw;; shader debug name: 1396690ed550686e26be113392120f5b.pdb; shader hash: 1396690ed550686e26be113392120f5b;; Pipeline Runtime Information:;;PSVRuntimeInfo:; Pixel Shader; DepthOutput=0; SampleFrequency=0; MinimumExpectedWaveLaneCount: 0; MaximumExpectedWaveLaneCount: 4294967295; UsesViewID: false; SigInputElements: 1; SigOutputElements: 1; SigPatchConstOrPrimElements: 0; SigInputVectors: 1; SigOutputVectors[0]: 1; SigOutputVectors[1]: 0; SigOutputVectors[2]: 0; SigOutputVectors[3]: 0;;; Input signature:;; Name Index InterpMode DynIdx; -------------------- ----- ---------------------- ------; TEXCOORD 0 linear;; Output signature:;; Name Index InterpMode DynIdx; -------------------- ----- ---------------------- ------; SV_Target 0;; Buffer Definitions:;; cbuffer cbPerFrame; {;; struct cbPerFrame; {;; float2 u_invSize; ; Offset: 0; int u_mipLevel; ; Offset: 8;; } cbPerFrame; ; Offset: 0 Size: 12;; };;; Resource Bindings:;; Name Type Format Dim ID HLSL Bind Count; ------------------------------ ---------- ------- ----------- ------- -------------- ------; cbPerFrame cbuffer NA NA CB0 cb0 1; samLinearMirror sampler NA NA S0 s0 1; inputTex texture f32 2d T0 t0 1;;; ViewId state:;; Number of inputs: 2, outputs: 4; Outputs dependent on ViewId: { }; Inputs contributing to computation of Outputs:; output 0 depends on inputs: { 0, 1 }; output 1 depends on inputs: { 0, 1 }; output 2 depends on inputs: { 0, 1 }; output 3 depends on inputs: { 0, 1 };HLSL source code section with the shader high-level source code:// Copyright(c) 2025 Advanced Micro Devices, Inc.All rights reserved.////--------------------------------------------------------------------------------------// Constant Buffer//--------------------------------------------------------------------------------------cbuffer cbPerFrame : register(b0){ float2 u_invSize; int u_mipLevel;}
//--------------------------------------------------------------------------------------// I/O Structures//--------------------------------------------------------------------------------------struct VERTEX{ float2 vTexcoord : TEXCOORD;};
//--------------------------------------------------------------------------------------// Texture definitions//--------------------------------------------------------------------------------------Texture2D inputTex :register(t0);SamplerState samLinearMirror :register(s0);
//--------------------------------------------------------------------------------------// Main function//--------------------------------------------------------------------------------------
static float2 offsets[9] = { float2( 1, 1), float2( 0, 1), float2(-1, 1), float2( 1, 0), float2( 0, 0), float2(-1, 0), float2( 1,-1), float2( 0,-1), float2(-1,-1) };
float4 mainPS(VERTEX Input) : SV_Target{ // gaussian like downsampling
float4 color = float4(0,0,0,0);
if (u_mipLevel==0) { for(int i=0;i<9;i++) color += log(max(inputTex.Sample(samLinearMirror, Input.vTexcoord + (2 * u_invSize * offsets[i])), float4(0.01, 0.01, 0.01, 0.01) )); return exp(color / 9.0f); } else { for(int i=0;i<9;i++) color += inputTex.Sample(samLinearMirror, Input.vTexcoord + (2 * u_invSize * offsets[i]) ); return color / 9.0f; }}To keep the output concise, only a subset of the source code is shown for large HLSL files. Omitted sections are replaced with vertical . . . markers. The tool attempts to locate the shader’s function signature and includes the surrounding code for context. If you prefer to view the complete shader source, manually run the rgd command-line tool with the --full-source option.
Please note that while the HLSL source code is included in the output file, there is currently no correlation between the offending AMD RDNA™ architecture instruction and the corresponding high-level source lines. We are actively working with our compiler teams to enable this capability and look forward to sharing updates in a future release.
AMD RGD is available as part of the AMD Radeon™ Developer Tools Suite on GPUOpen.com. For download links, documentation and additional materials please visit the AMD RGD product page. The tool source code is also available on GitHub.com.