AMD Radeon Developer Tool Suite updated with new GPU support and significant RGP enhancements

Analyze. Adjust. Accelerate. Now available as part of the AMD Radeon™ Developer Tool Suite.

Meet the AMD Radeon™ GPU Profiler, a ground-breaking low-level optimization tool that provides detailed information on AMD Radeon™ GPUs.
Unlike the black box approach of the past, PC game developers now have unprecedented, in-depth access to a GPU and can easily analyze graphics, async compute usage, event timing, pipeline stalls, barriers, bottlenecks, and other performance inefficiencies.
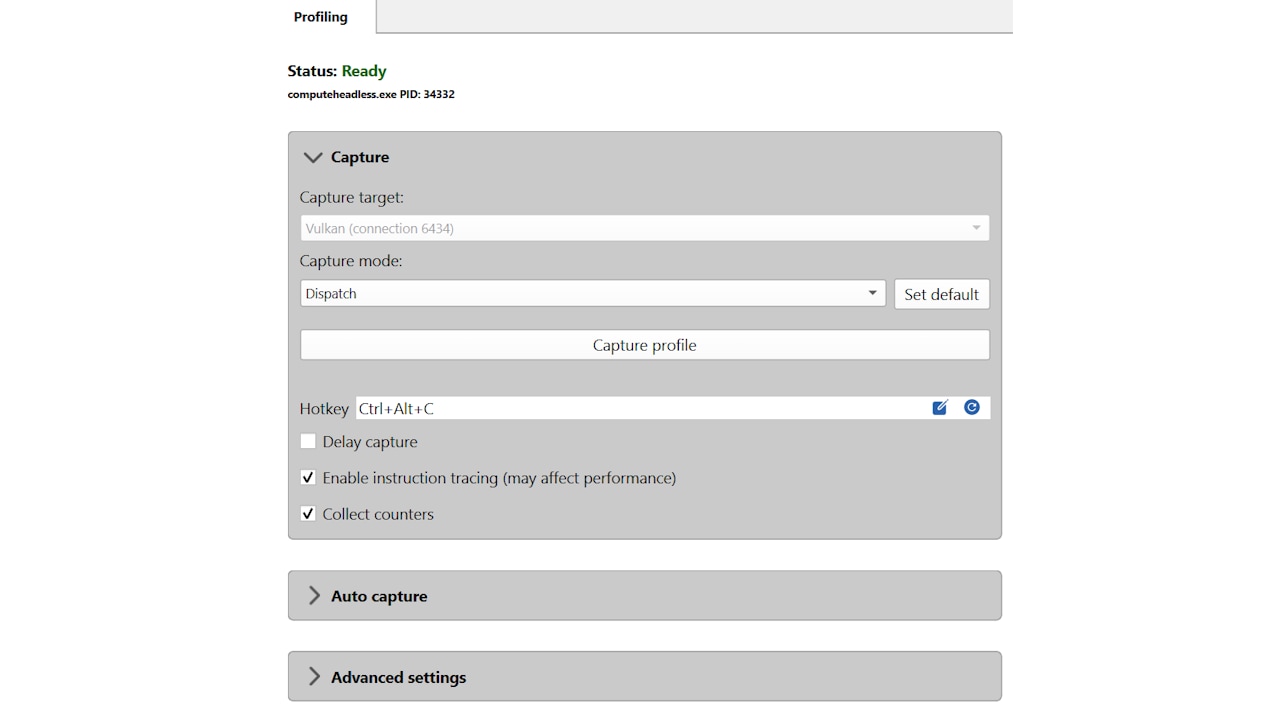
This unique tool generates easy to understand visualizations of how your DirectX® 12, Vulkan®, OpenCL™, and HIP applications interact with the GPU at the hardware level. Profiling a game is both a quick and simple process using the AMD Radeon™ Developer Panel and our AMD Software: Adrenalin Edition™ driver.
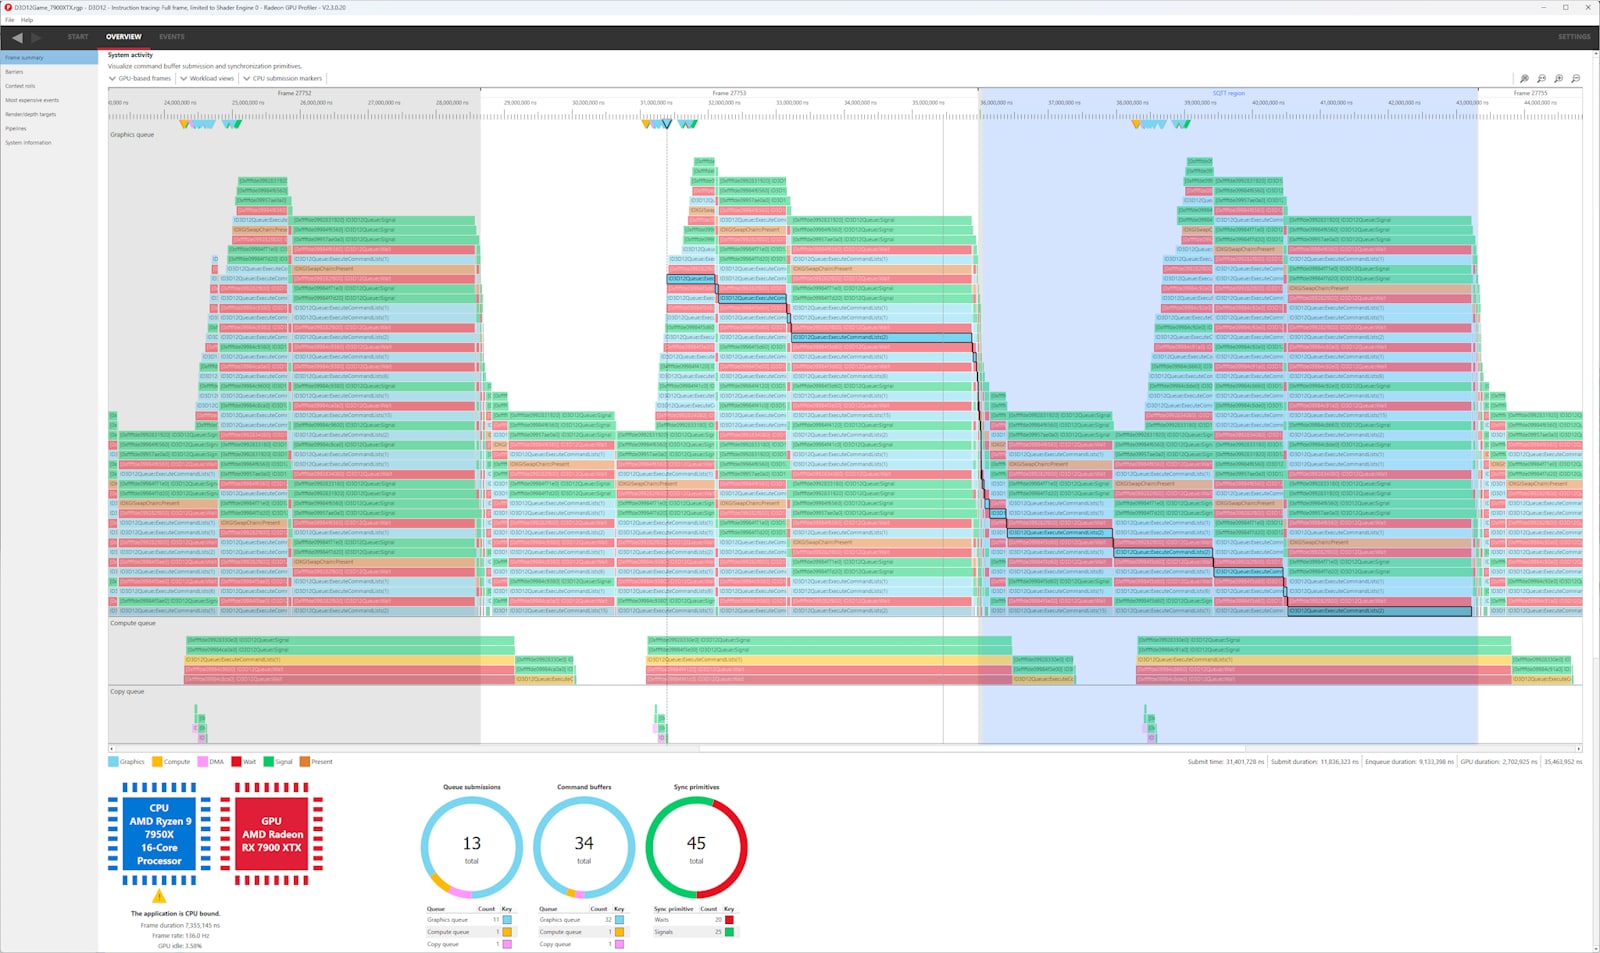
Get a bird’s eye view of how your command buffers got submitted to each GPU queue.
Understand how your graphics, async compute, and copy workloads interact and synchronize.
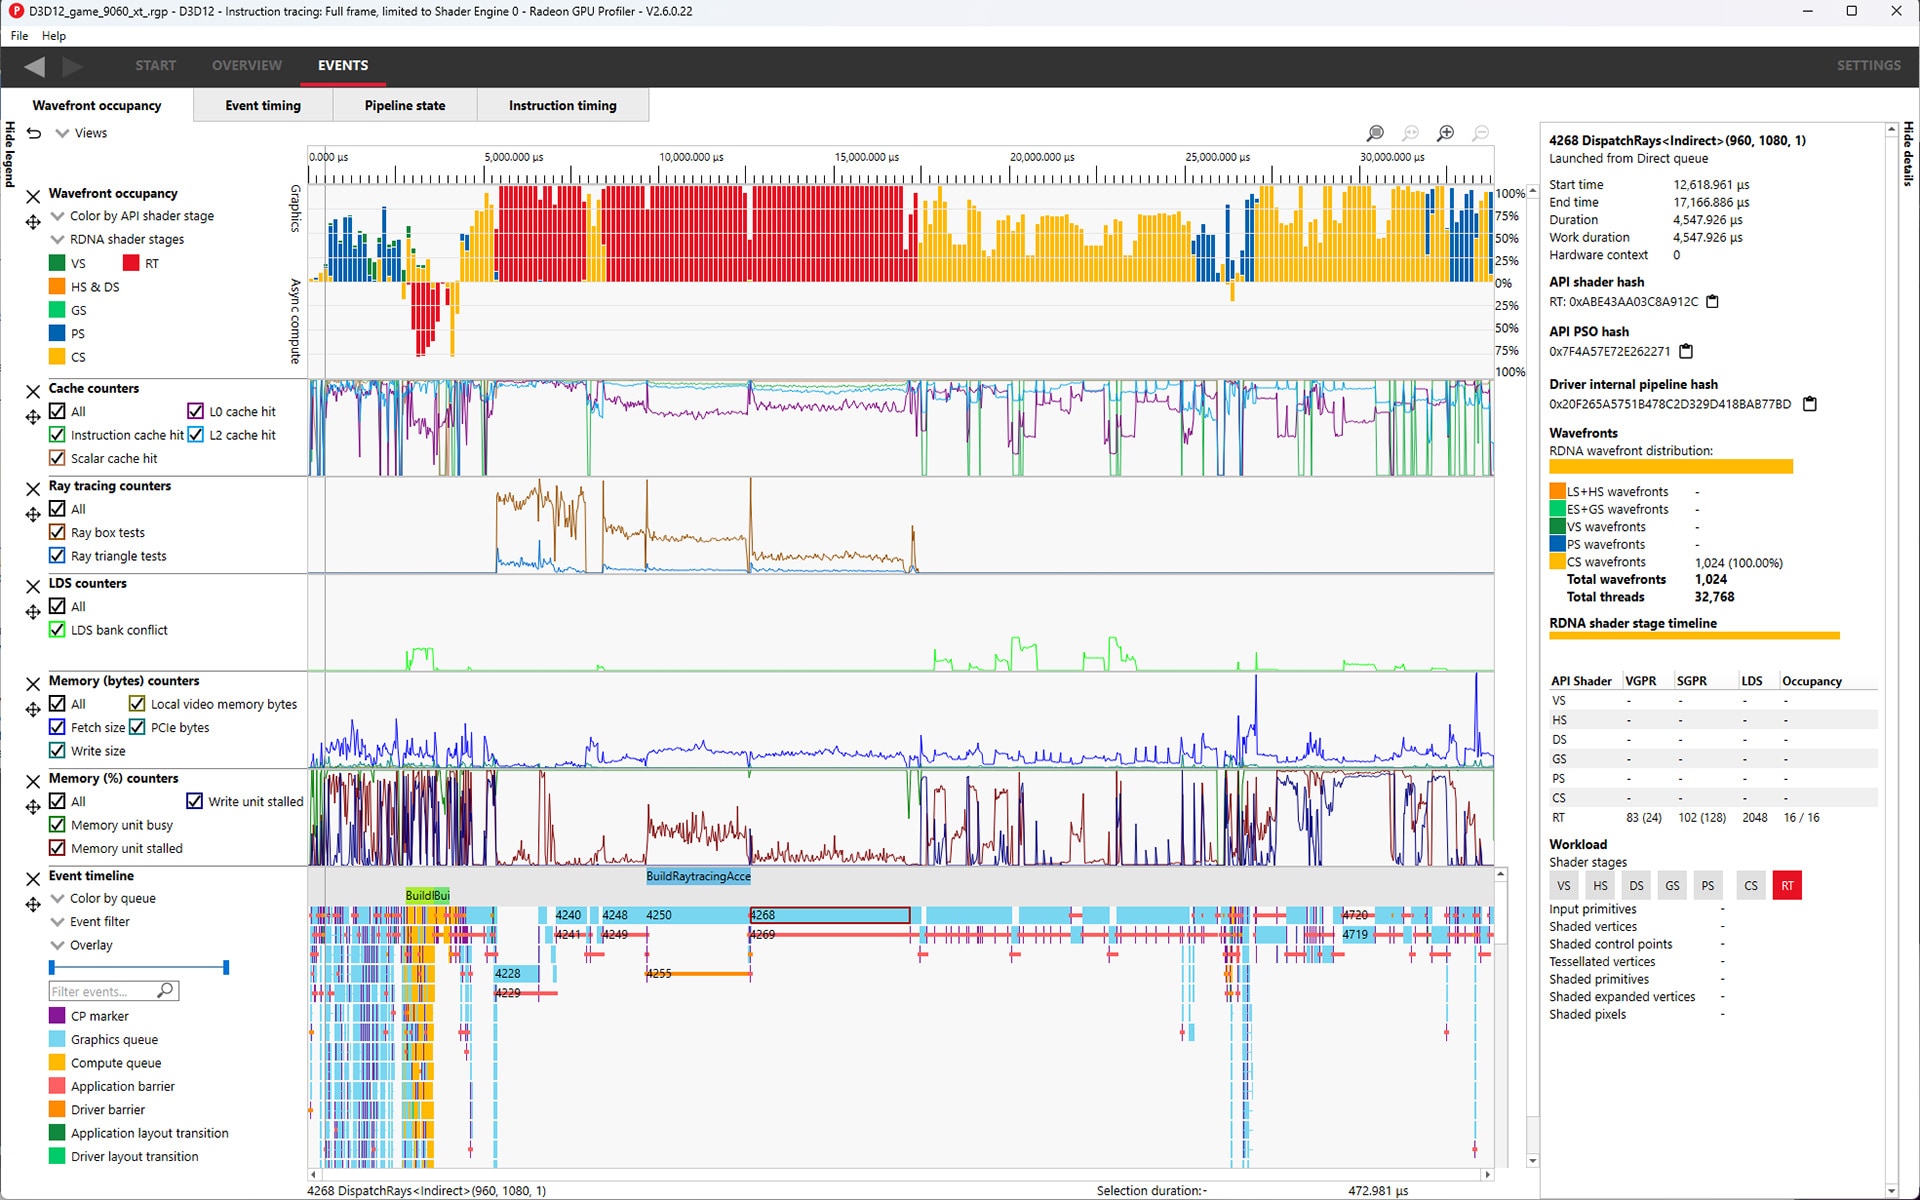
Understand how your wavefronts were pushed through the GPU. We can also correlate between wavefronts and the GPU events which launched them and provide insight into how your frame utilizes the various GPU memory caches.
The data displayed in this view is highly filterable, groupable, and includes a side panel with added detail about user selections.
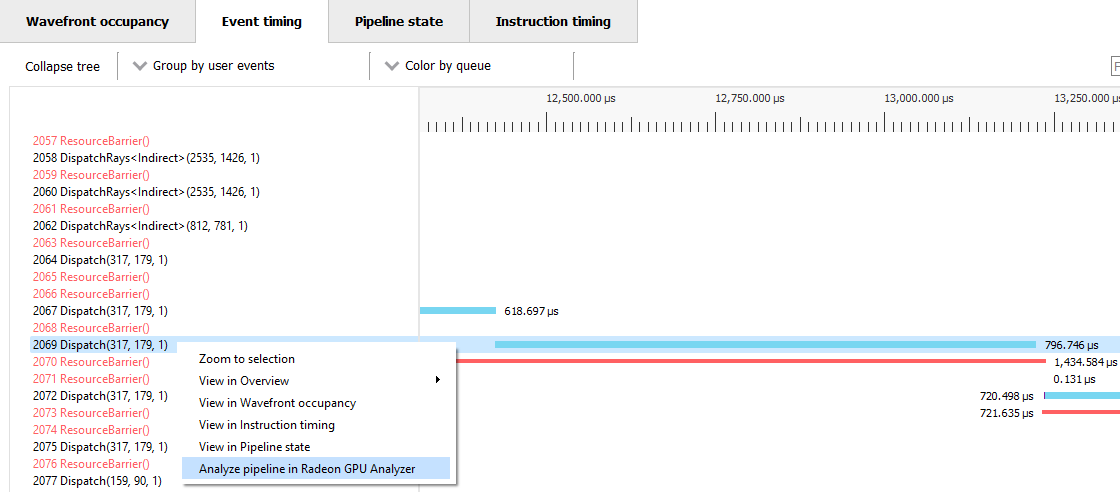
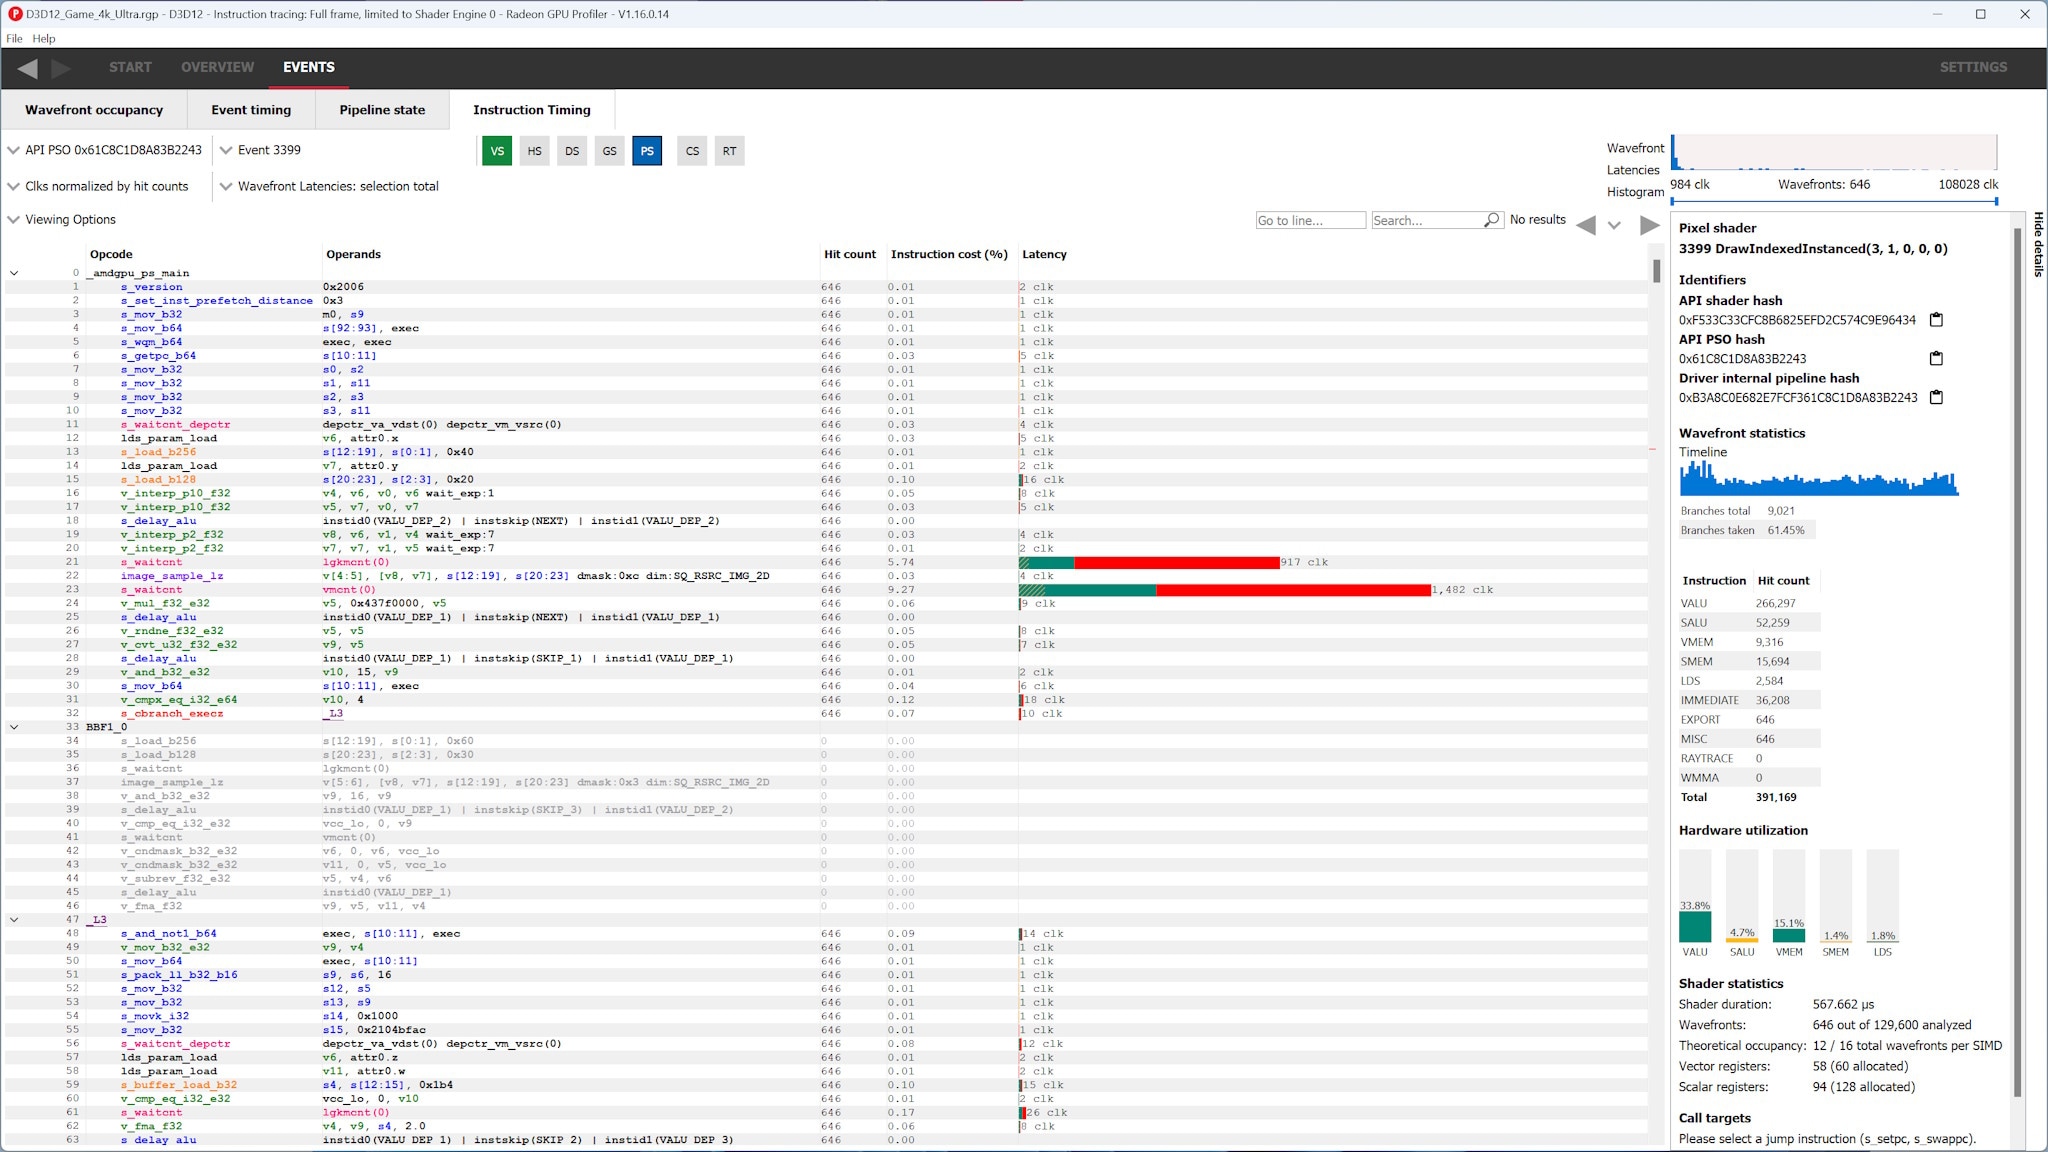
Quickly and easily find hotspots in your shaders using the instruction timing view.
Each instruction in your AMD RDNA™ arcitecture ISA has a bar showing its average latency, allowing you find the right things to optimize.
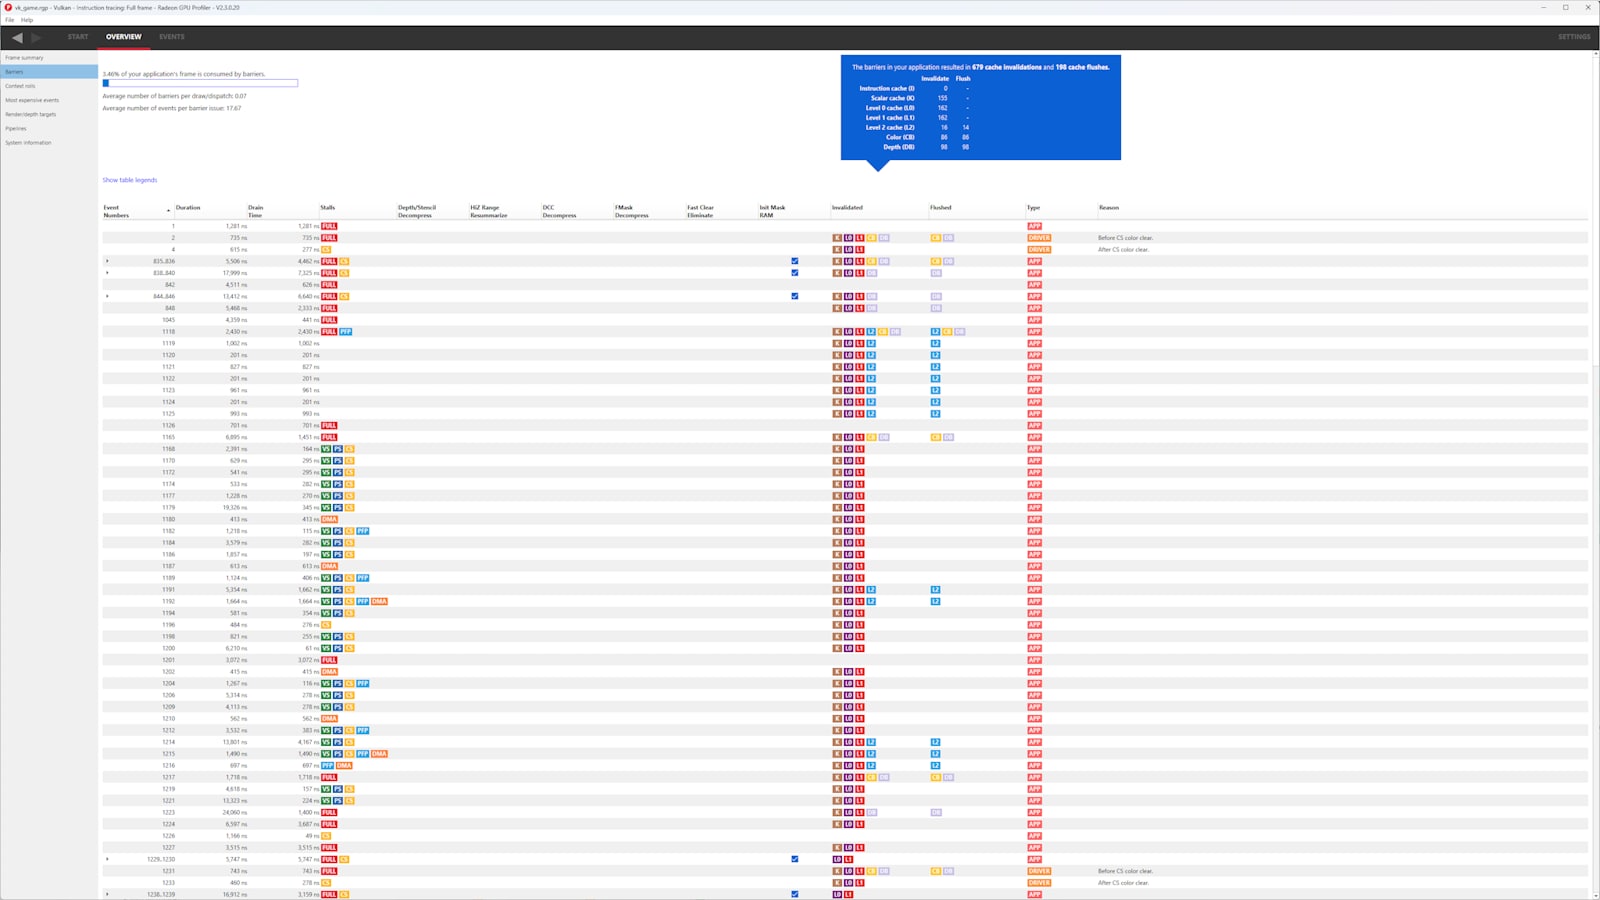
Find out which barriers flushed caches, caused a synchronization point or even ran their own, internal shaders.
Burst those pipeline bubbles and claim back your performance.
Support for additional AMD RDNA™ 4 architecture hardware (AMD Radeon™ RX 9060 GPUs).
Support for additional AMD RDNA 3.5 architecture-based APUs (AMD Ryzen™ AI 5 330 Processor with AMD Radeon 820M Graphics).
Added support for the ROG Xbox Ally X.
Profiles captured on AMD RDNA 3 or RDNA 4 architecture-based hardware will now include additional memory-related counters.
The pipeline state pane will now indicate if dynamic VGPR allocation is used in a shader (for profiles captured on AMD RDNA 4 architecture-based hardware).
Bug and stability fixes.