AMD Radeon™ Raytracing Analyzer
AMD Radeon™ Raytracing Analyzer (RRA) is a tool which allows you to investigate the performance of your raytracing applications and highlight potential bottlenecks.
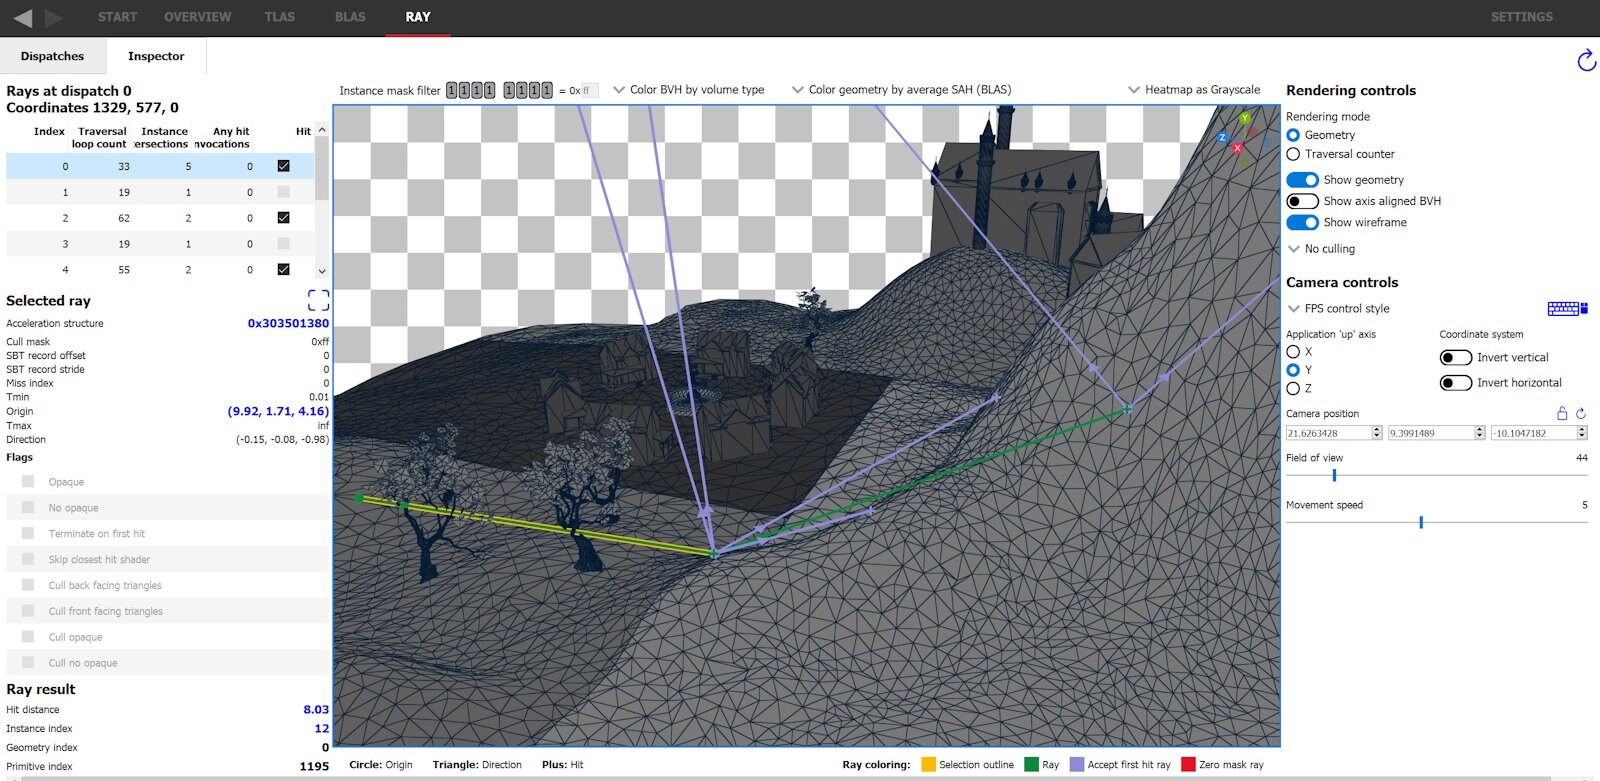
Ray tracing using the DirectX or Vulkan API consists of first building acceleration structures then tracing rays by traversing those acceleration structures. Up until now, Radeon Raytracing Analyzer (RRA) only provided mechanisms for inspecting acceleration structures but did not have a way to view traversal data about the rays that traversed these acceleration structures. With RRA 1.3 there is a new Ray tab that shows ray traversal statistics and as well as the ability to inspect each casted ray in 3D.
The TLAS and BLAS tabs already allow switching to traversal render mode to simulate traversal costs of the acceleration structure, but this can vary significantly from the actual cost incurred by the captured application. The simulated view casts a single ray per pixel from the viewport camera, whereas applications are free to cast any number of rays per pixel that don’t need to originate at the camera and can each have unique ray flags, cull masks, and Tmin/Tmax. The Ray tab allows viewing all the casted rays and their parameters. This information is displayed as a heatmap in the Dispatches tab and each ray can be viewed in 3D via the Inspector tab.
We will look into solving some common problems using the new ray features.
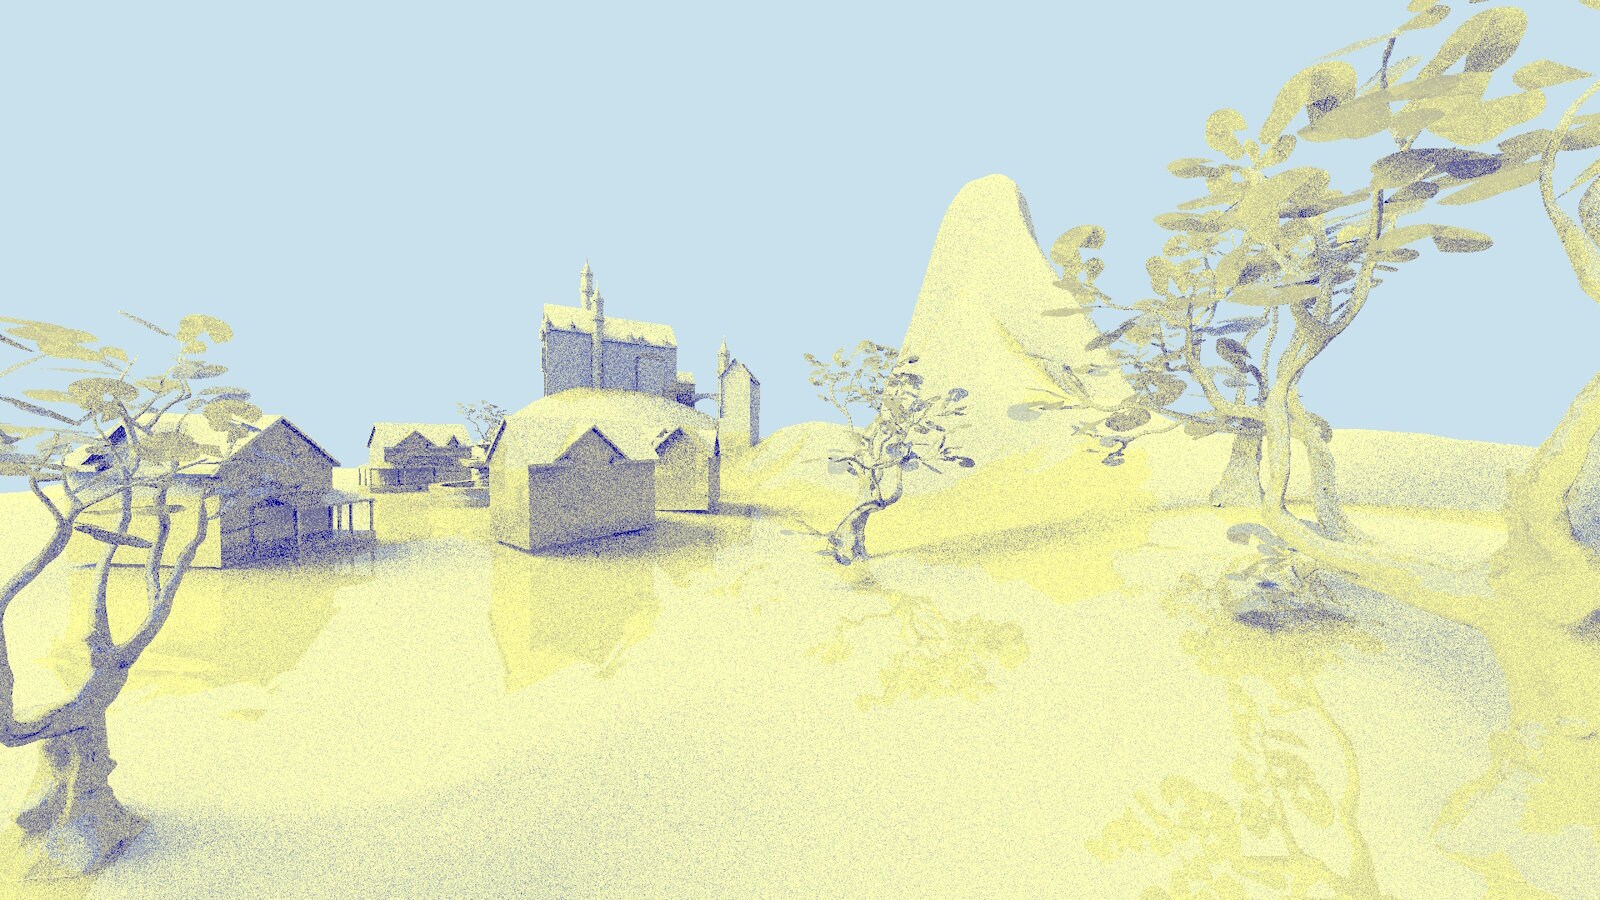
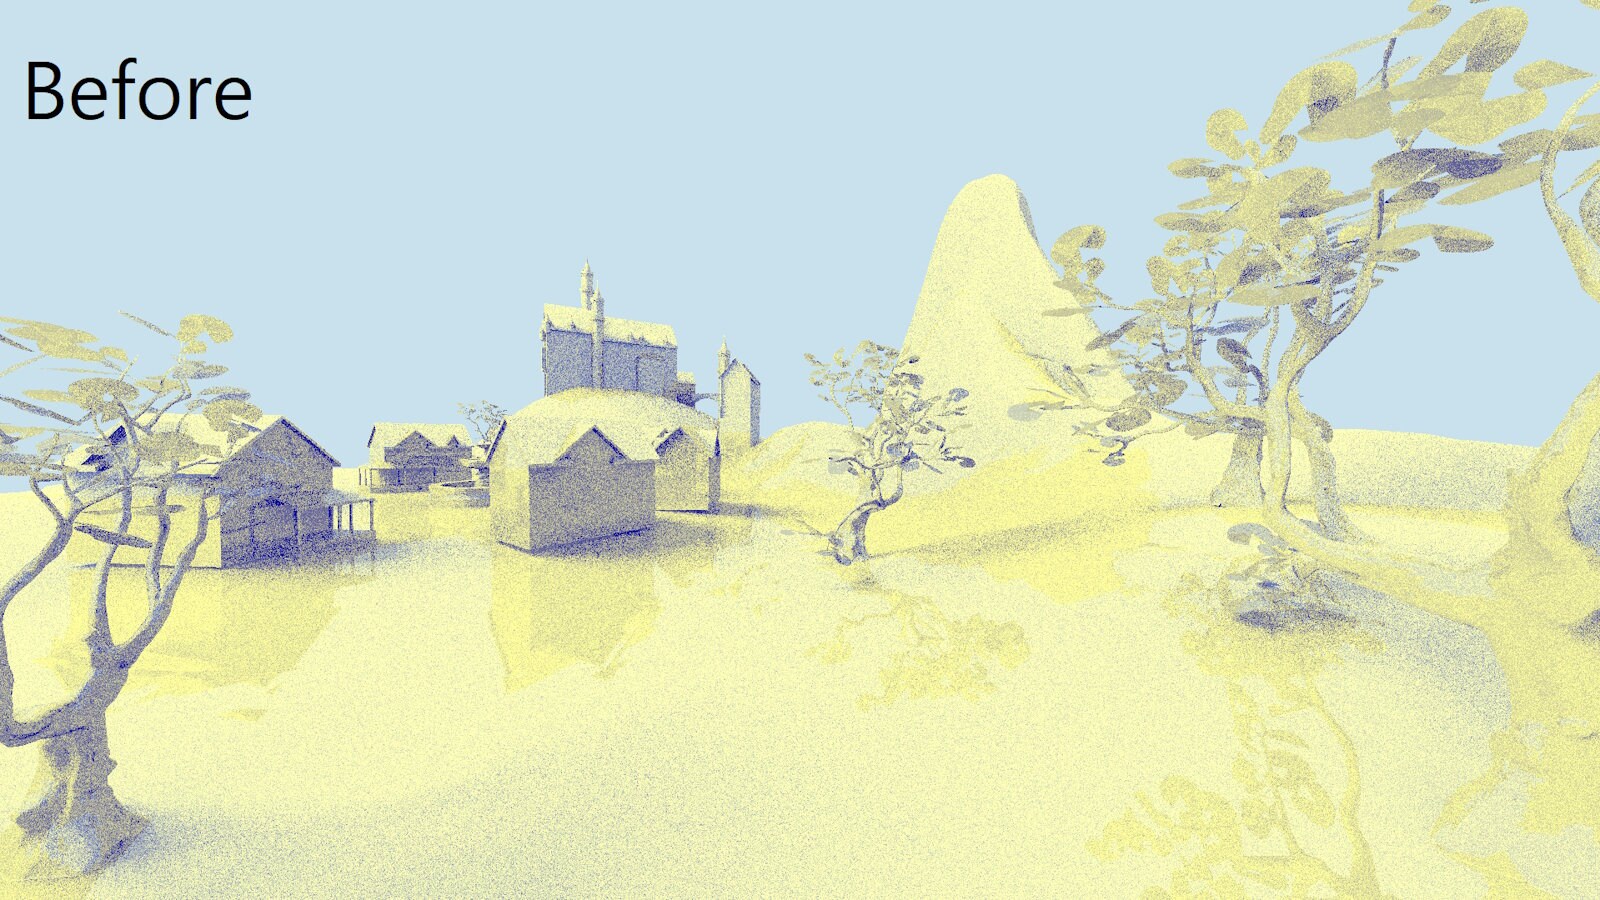
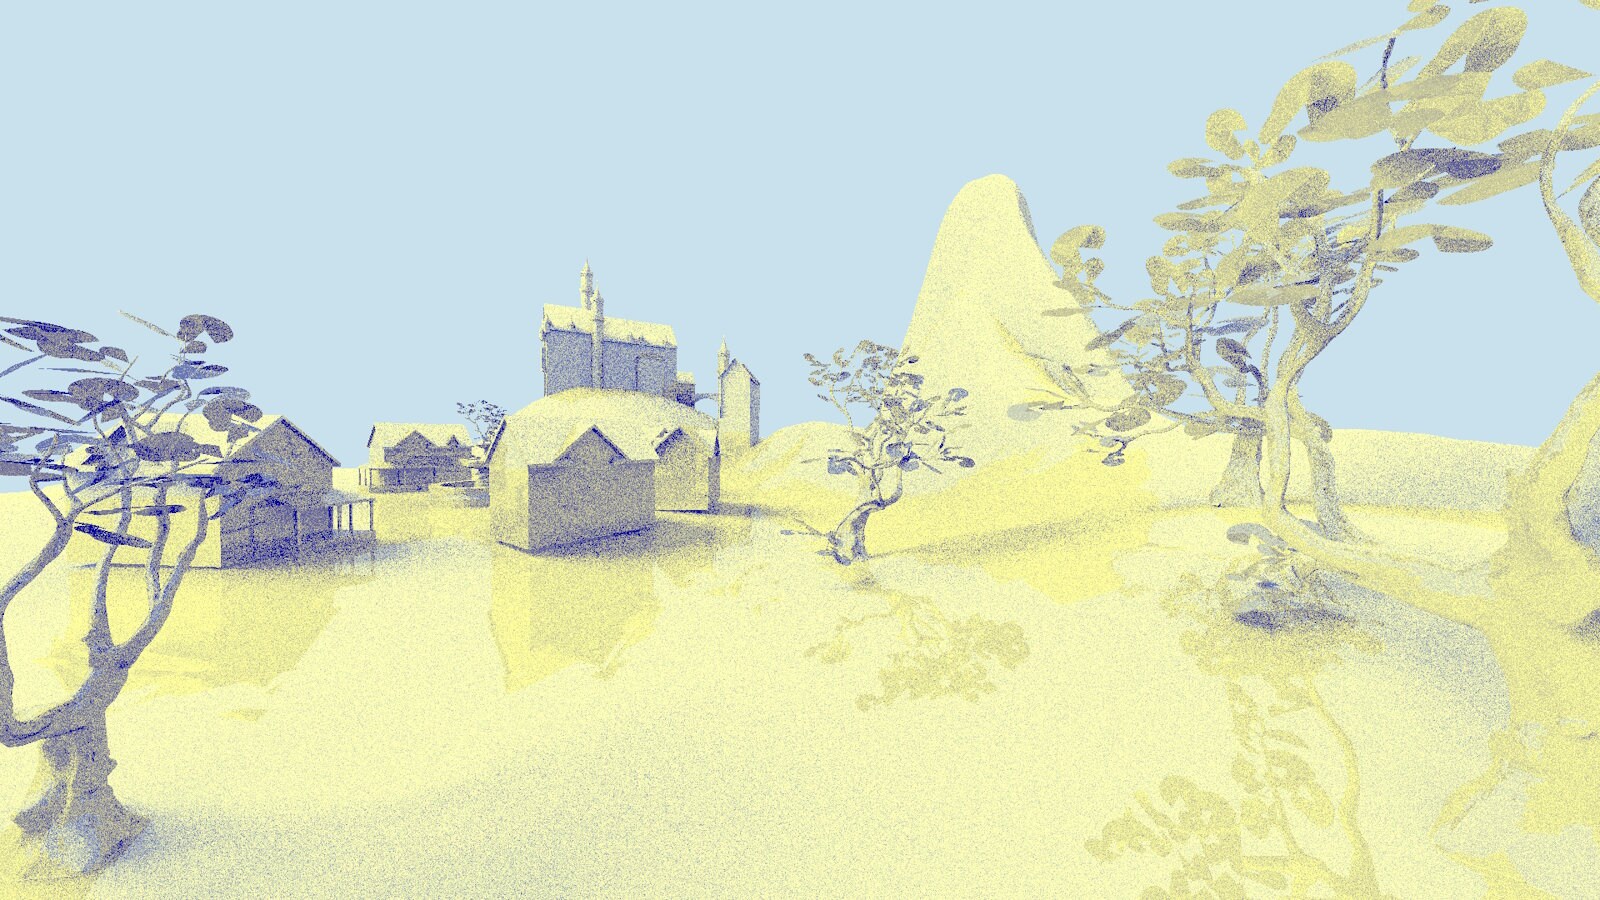
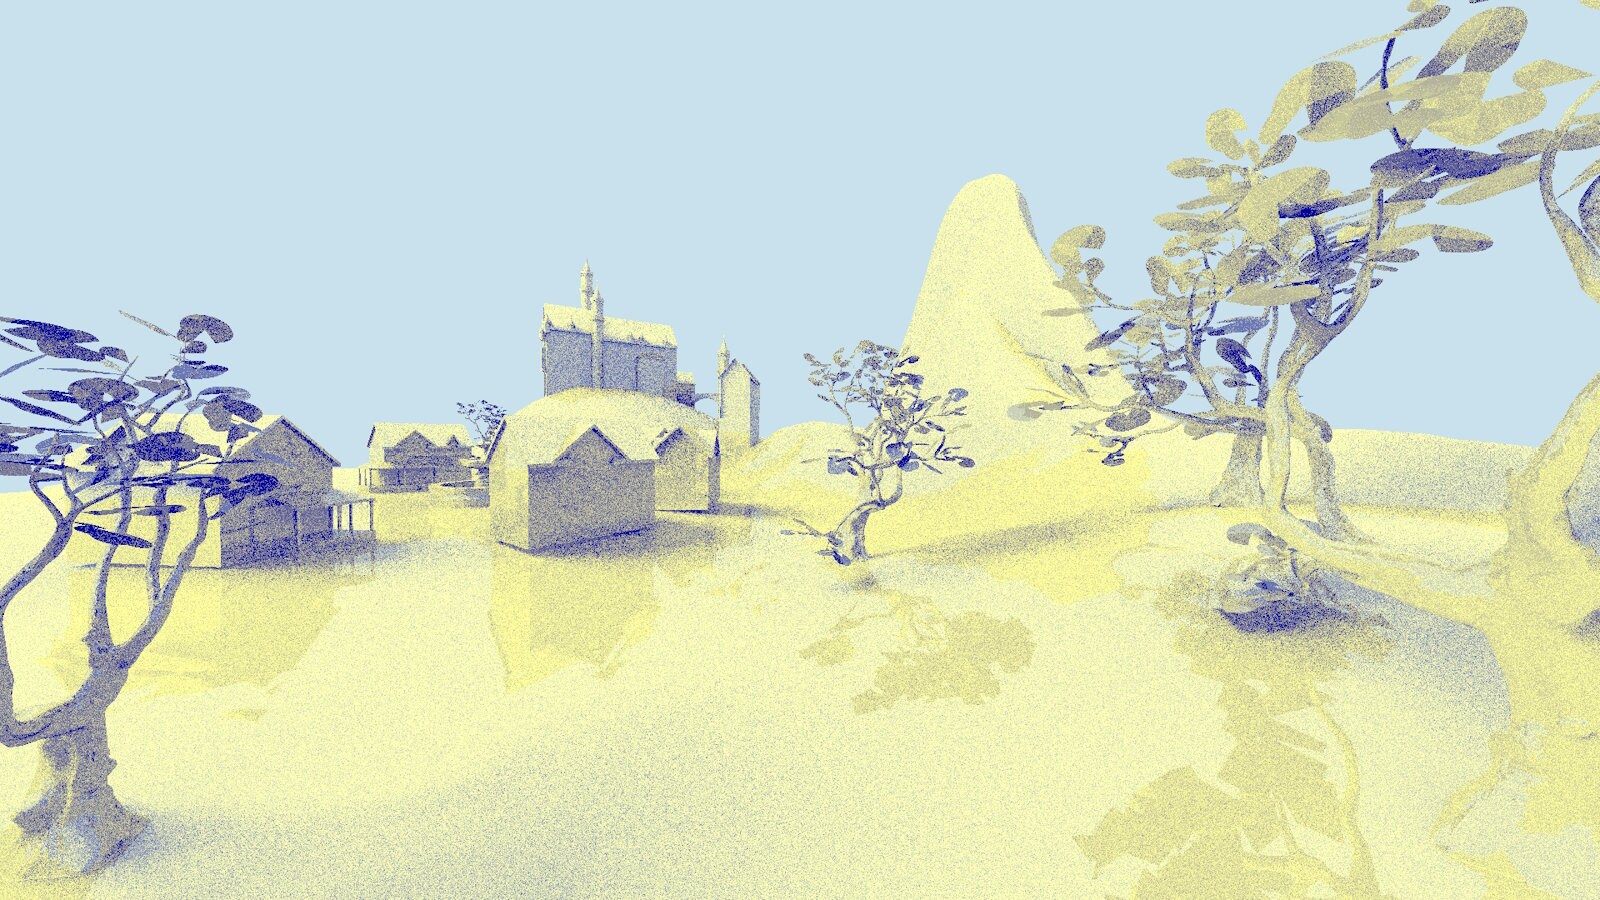
The above image shows the final ray traced image in the captured sample ray tracing render engine. Most games that use ray tracing cast their rays sparingly, which is a reasonable thing to do considering ray tracing is a costly process. To test RRA, we developed a sample engine that renders the scene completely using ray tracing, features soft shadows, and reflections, to cast multiple rays per pixel.
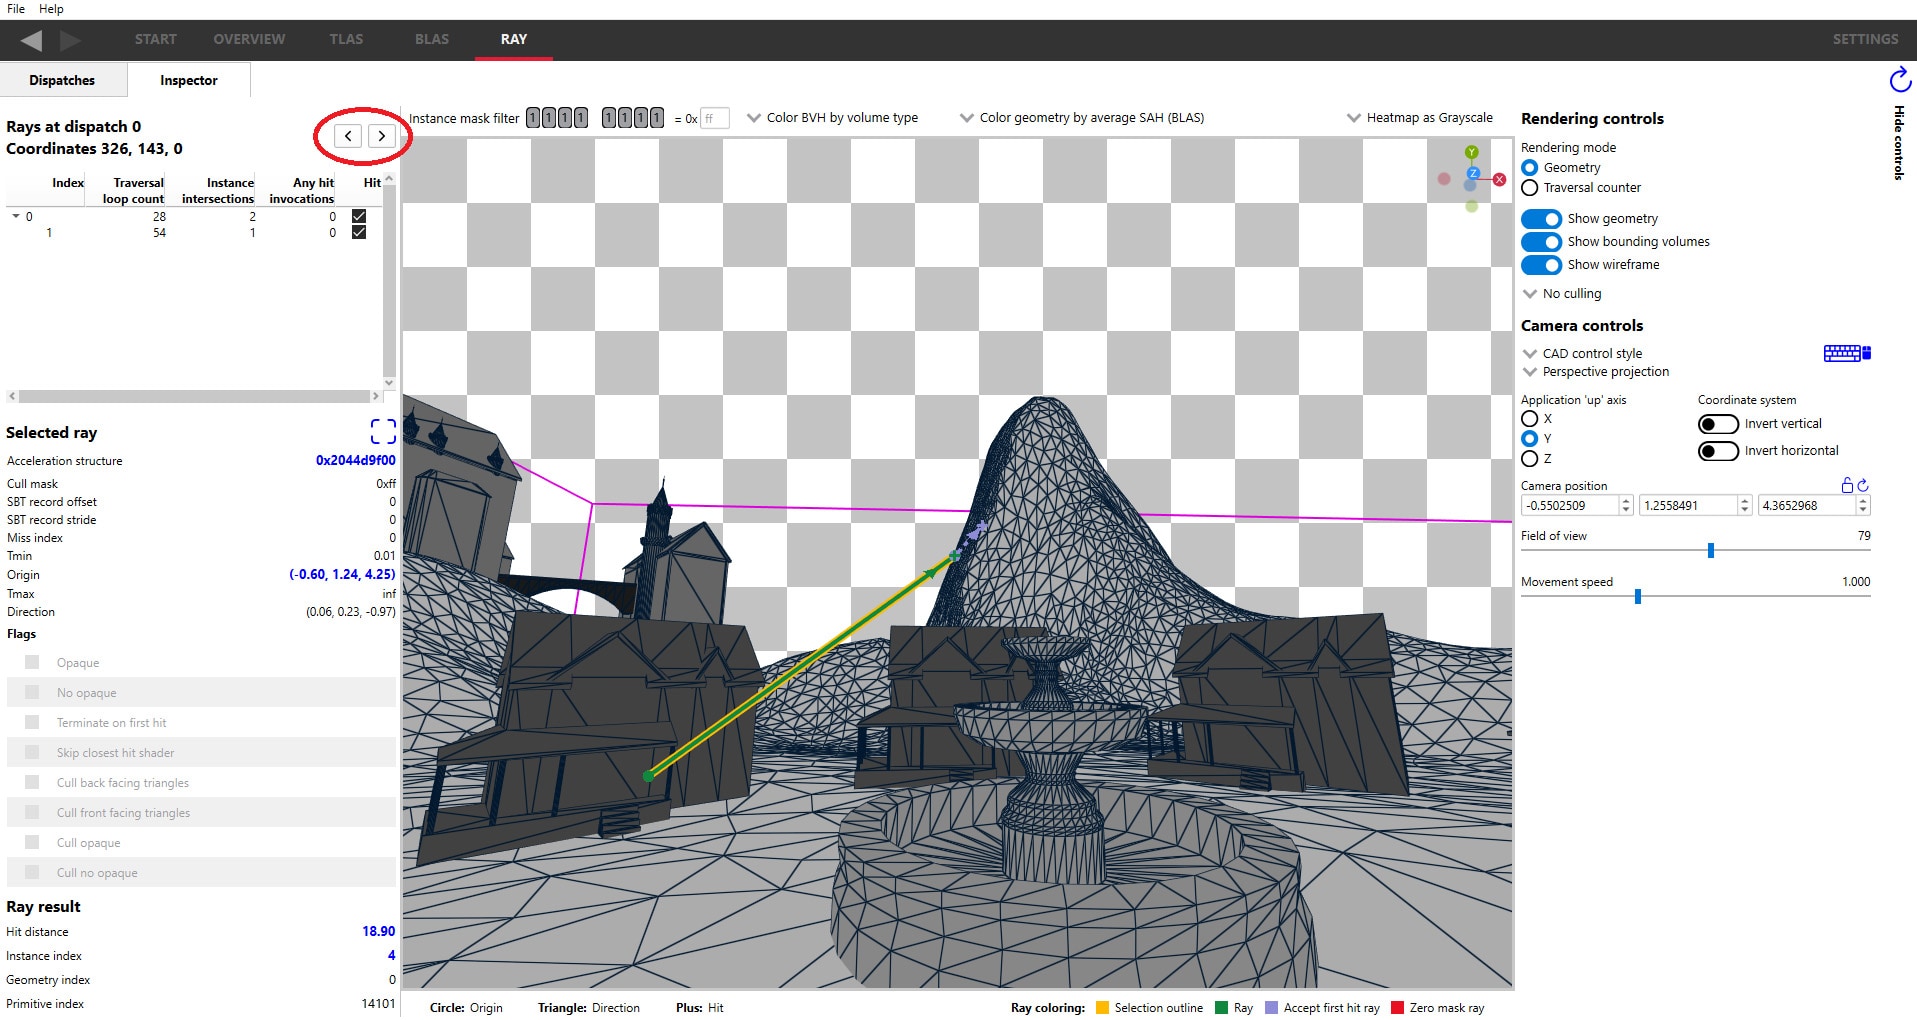
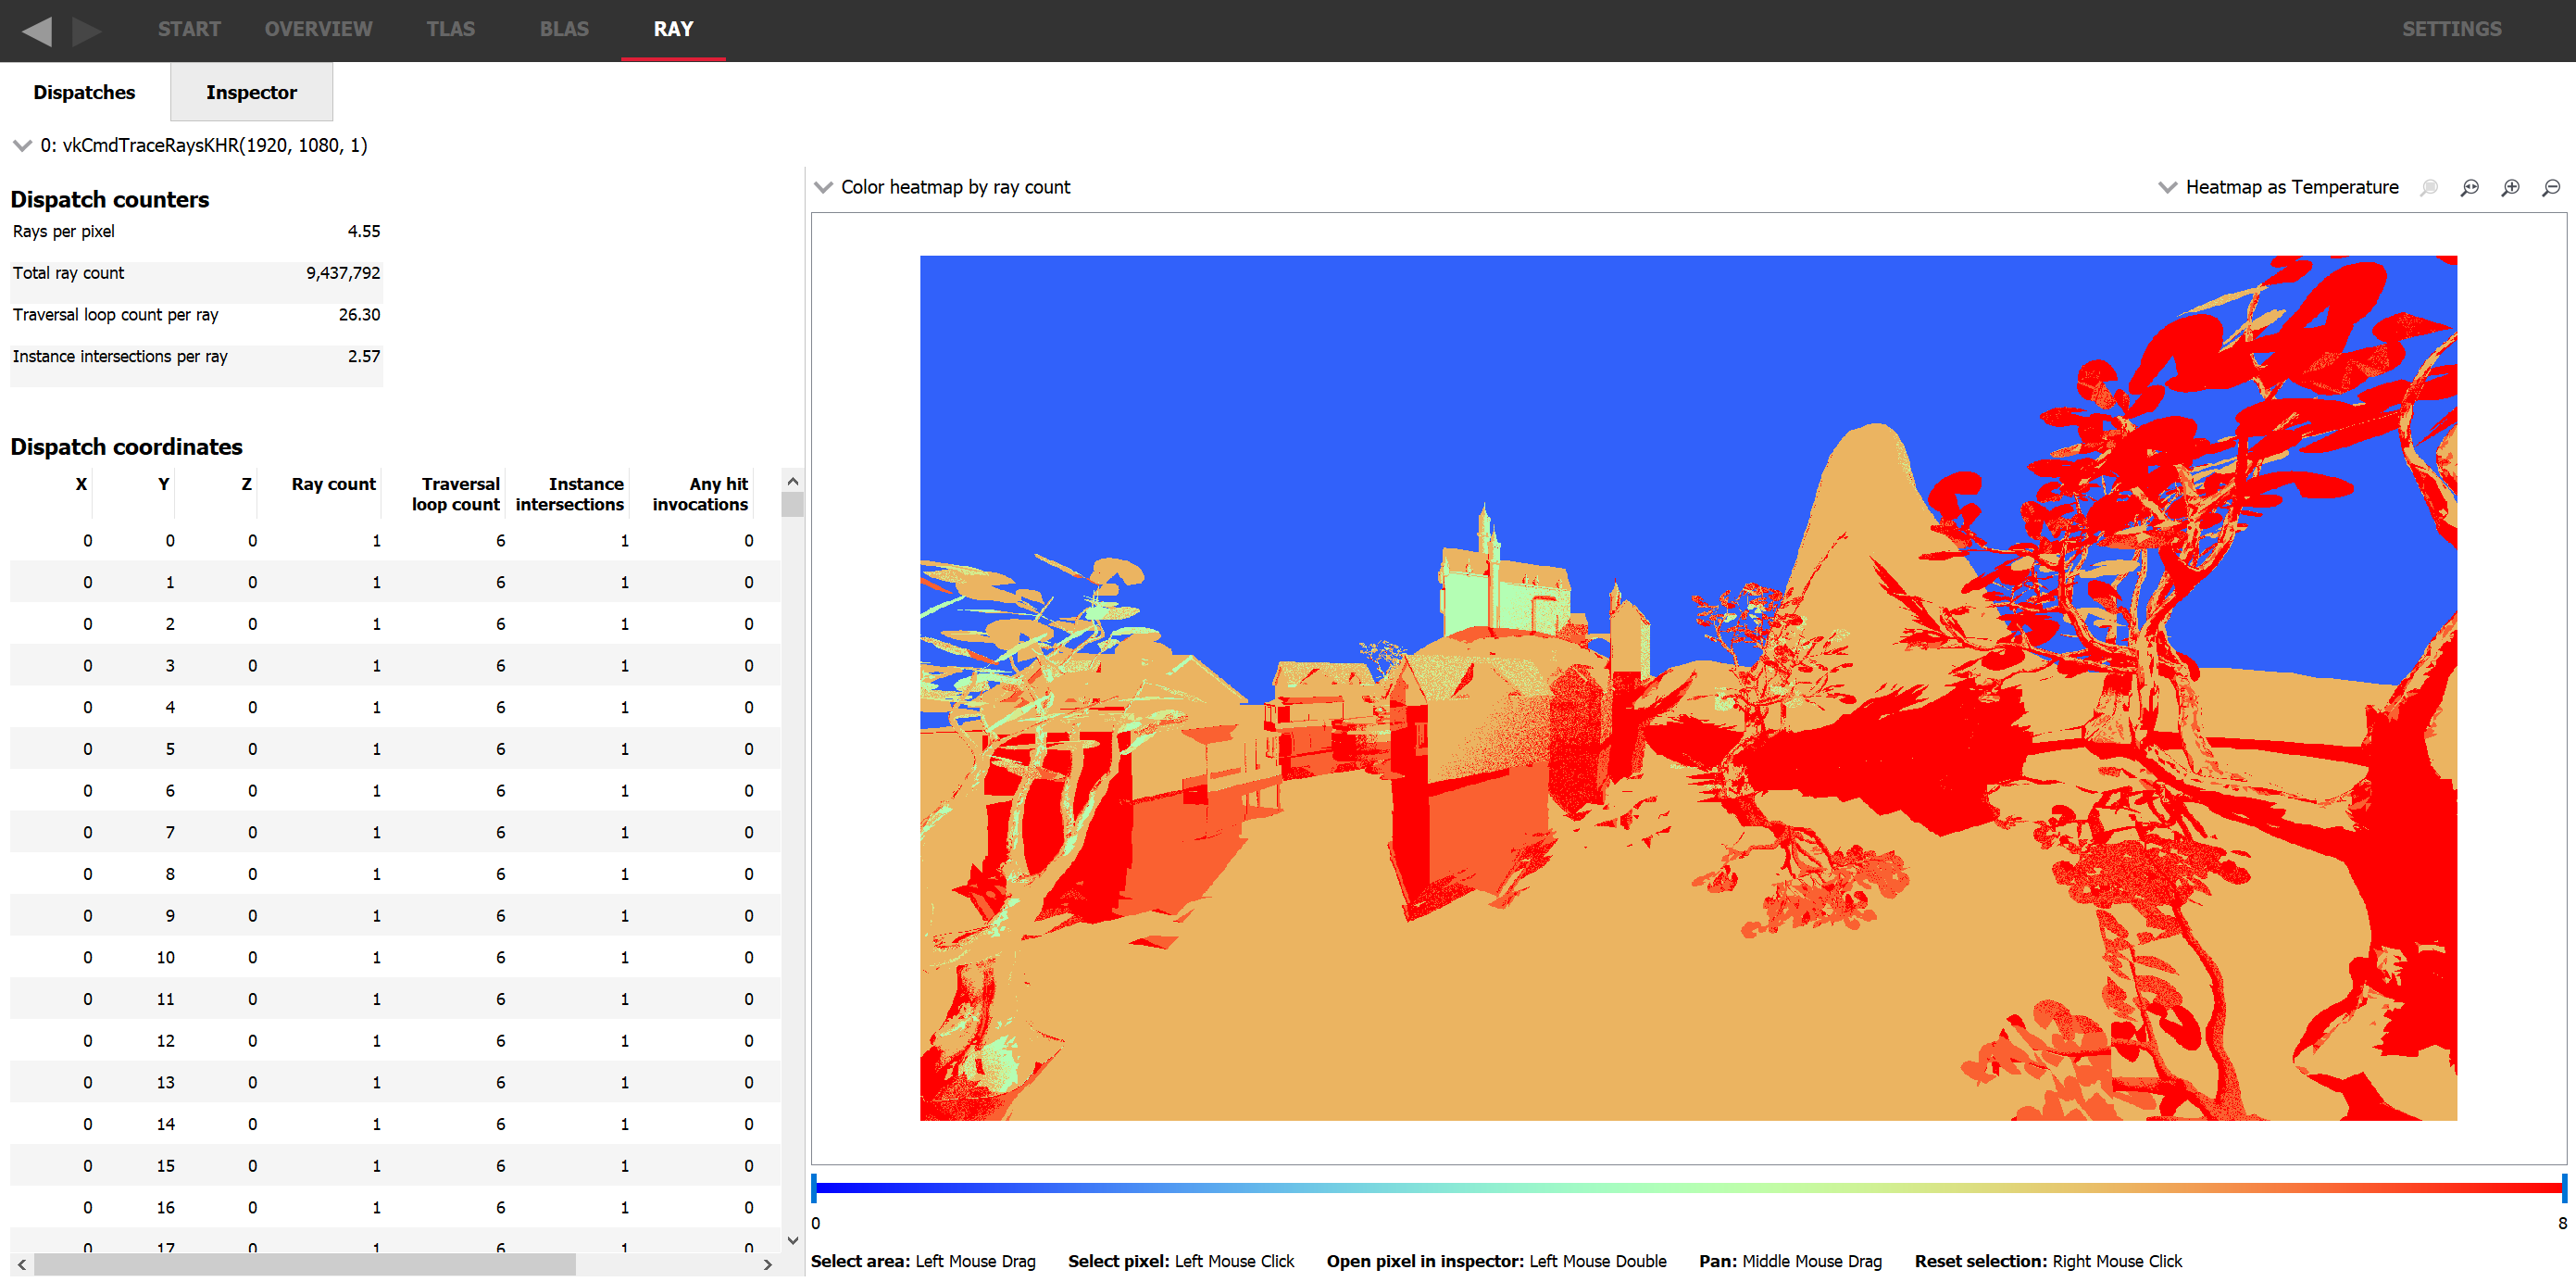
On opening the Ray pane of a trace with ray data, there will be a heatmap image visualizing traversal statistics for this dispatch. The specific statistic it shows is set by a dropdown above it. A list of each dispatch coordinate is shown on the left with numbers corresponding to the heatmap. Note that each pixel in the heatmap often corresponds closely to a pixel in the rendered image, unless upscaling or a non 1-to-1 mapping such as a 1D dispatch is used. If 1D dispatches are used, they can be remapped to any given dimension as long as there is a non-sparse mapping.
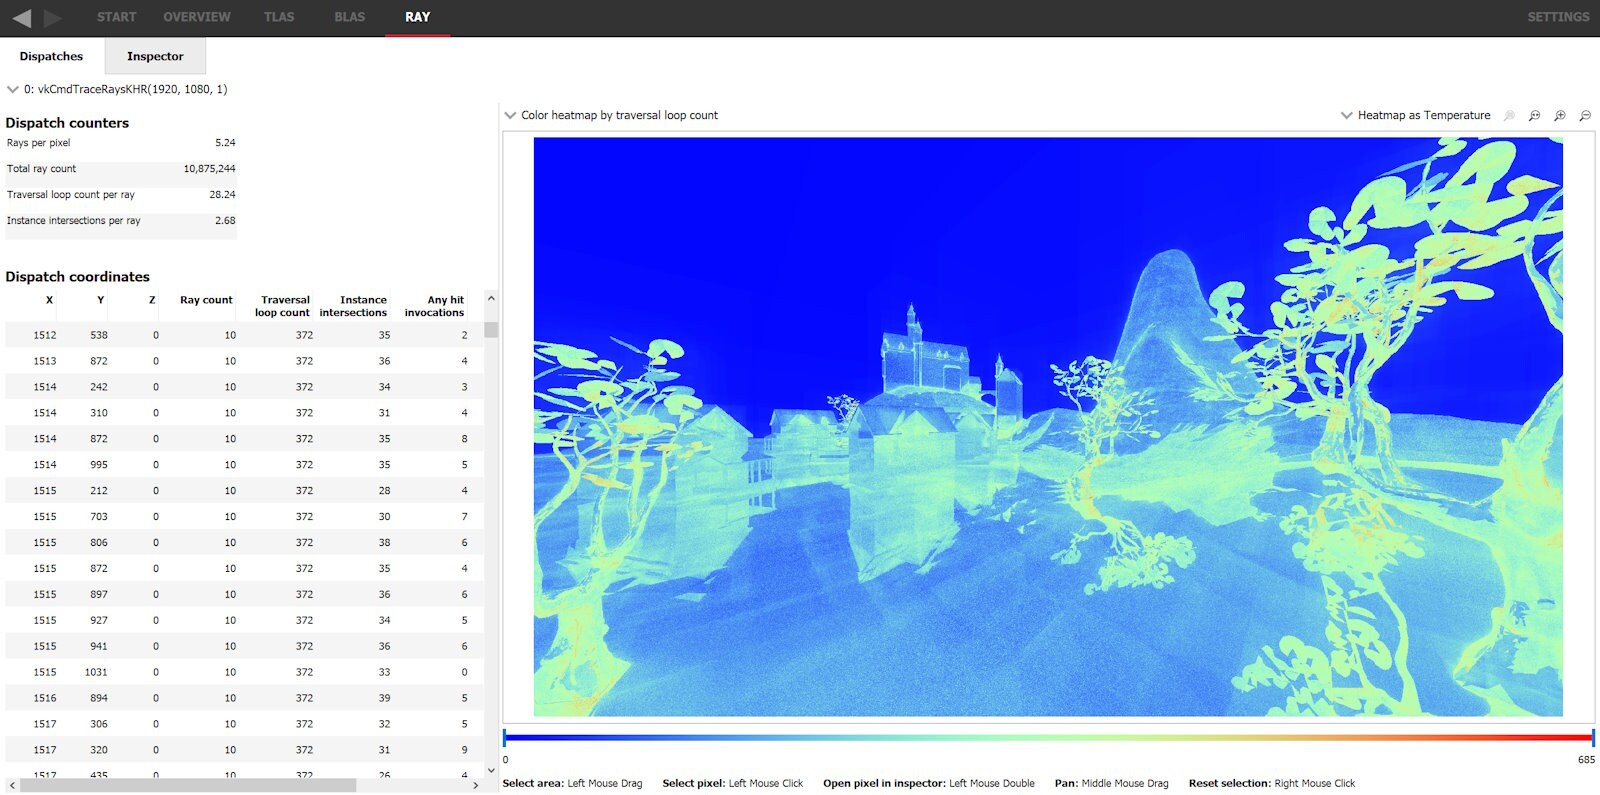
The heatmap looks reminiscent of the traversal render mode in the TLAS and BLAS panes, except this view is not simulated like the traversal render mode and doesn’t allow changing the perspective by moving or rotating the camera; it is the actual recorded data from the rays cast in the captured application.
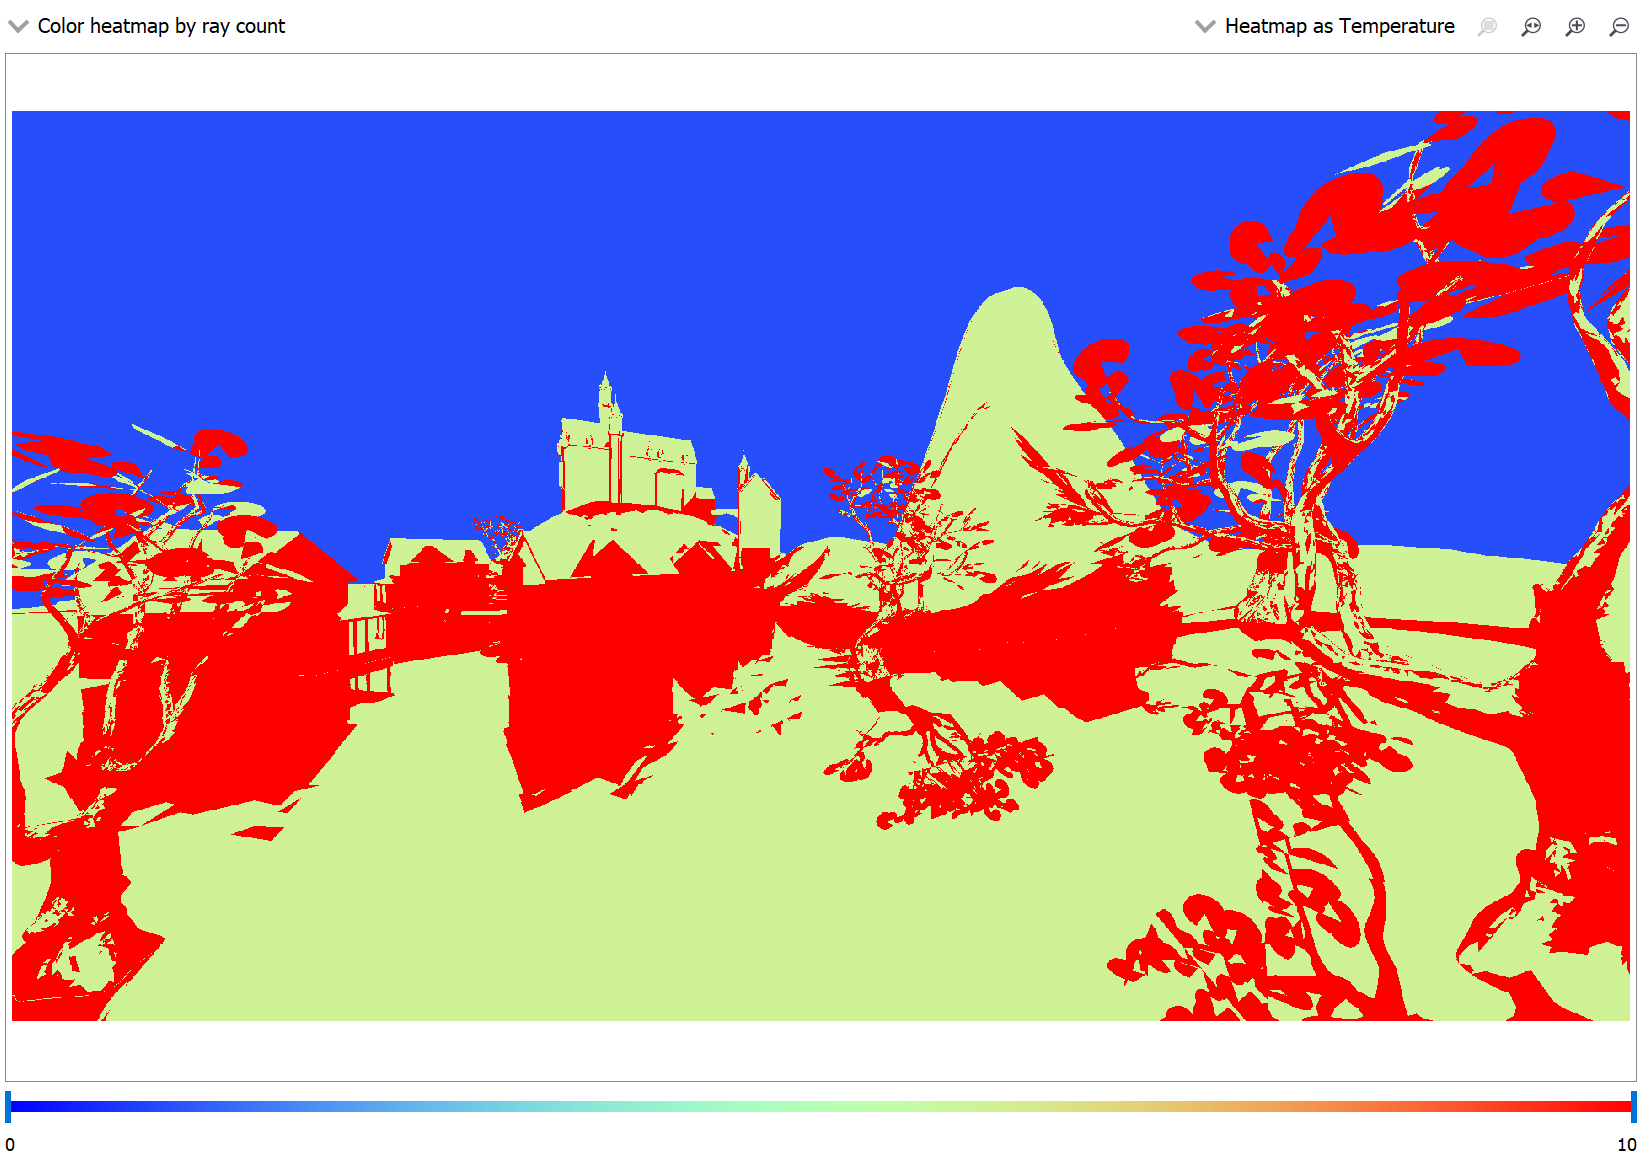
Visually inspecting the heatmap, it seems there is a high traversal cost below the mountain. Clicking the “Traversal loop count” column header will sort the dispatch coordinates list by their total traversal cost. On clicking the most costly entry it is revealed by the black cursor pointing at the selected coordinate that it is one of a few costly invocations in the center tree’s reflection, but for now we are interested in the region under the mountain.
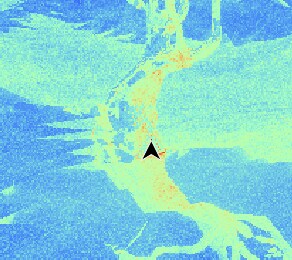
Clicking and dragging the left mouse button in the heatmap allows drawing a box to filter for only the selected dispatch coordinates in the list. Selecting a box around the base of the mountain and sorting the table again shows the most expensive coordinate in this region lies in the upper right of the selected area.
Now that a problematic area has been identified it’s time to look into options for improving traversal costs.
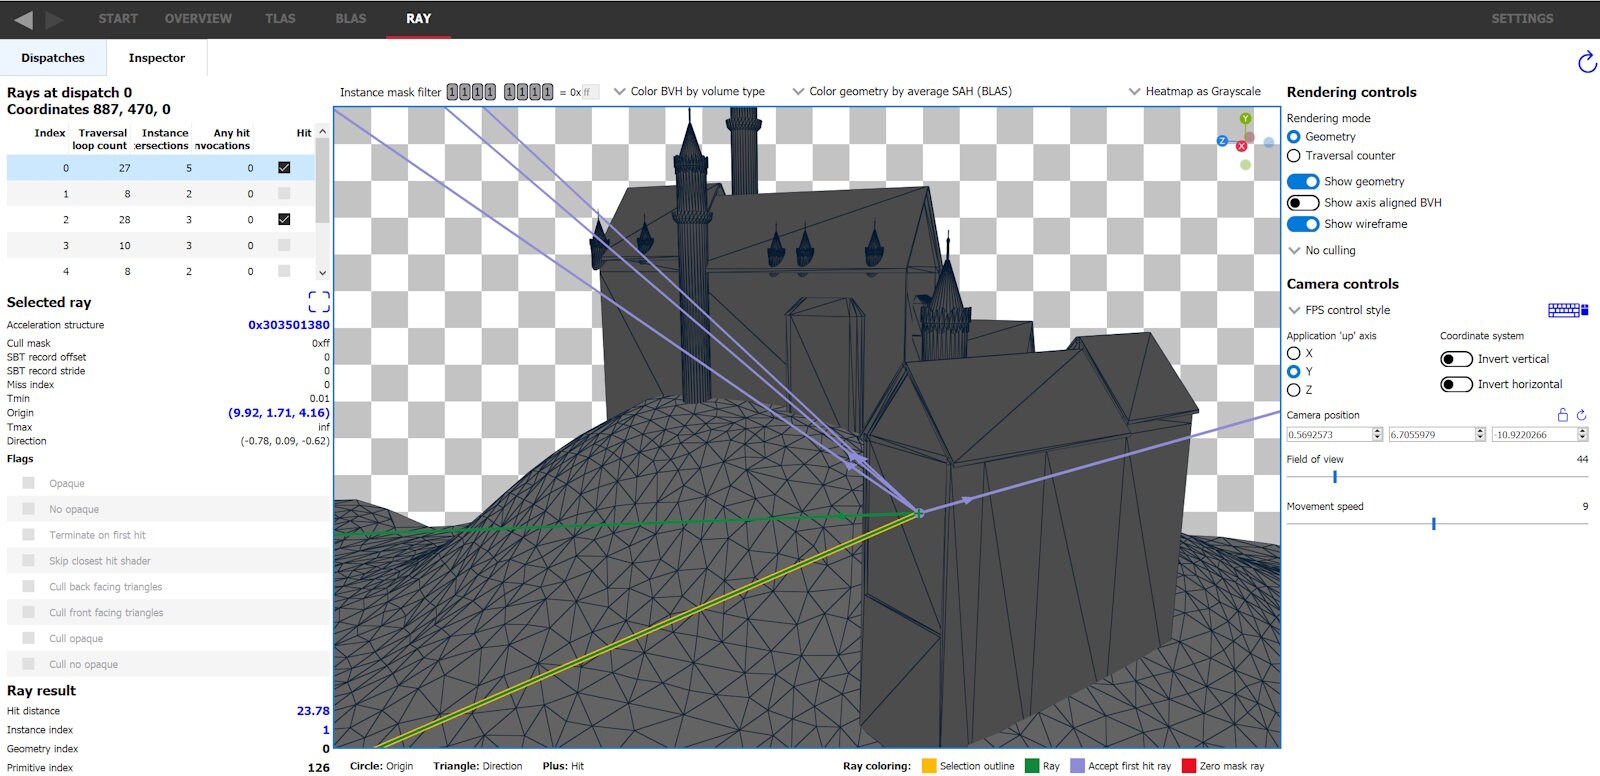
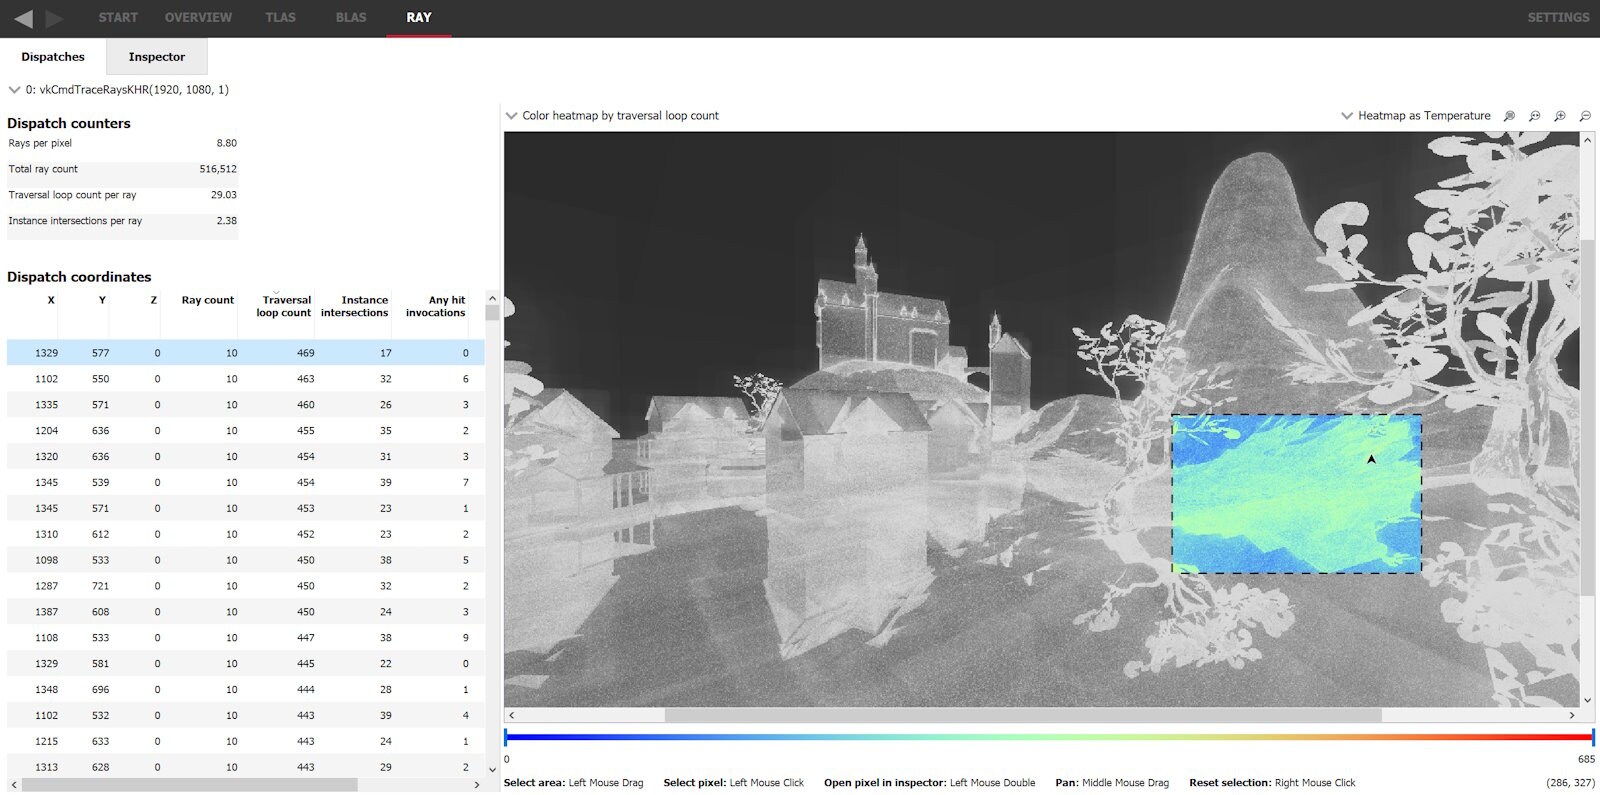
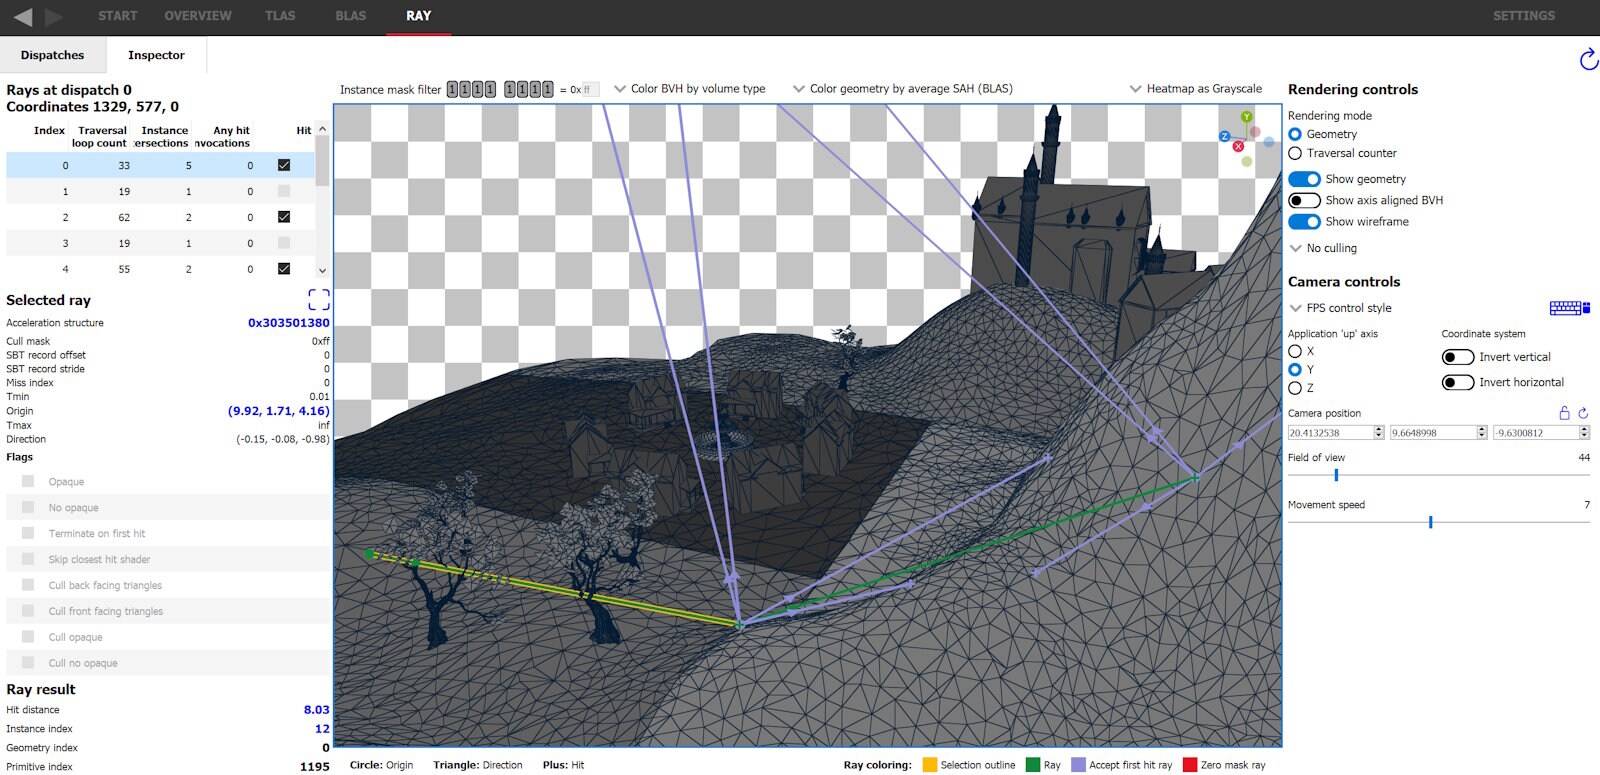
The ray inspector makes it easy to see which rays cast in a given dispatch coordinate have the RAY_FLAG_ACCEPT_FIRST_HIT_AND_END_SEARCH flag set, as they are colored lavender (by default). The legend in the bottom right shows what colors are set for each ray type, and are changeable through the settings. Let’s inspect the dispatch coordinate previously selected below the mountain to see if it’s possible to enable this flag for any rays. With the dispatch coordinate selected, switch to the Inspector tab (alternatively can double click the coordinate in the list or the heatmap).
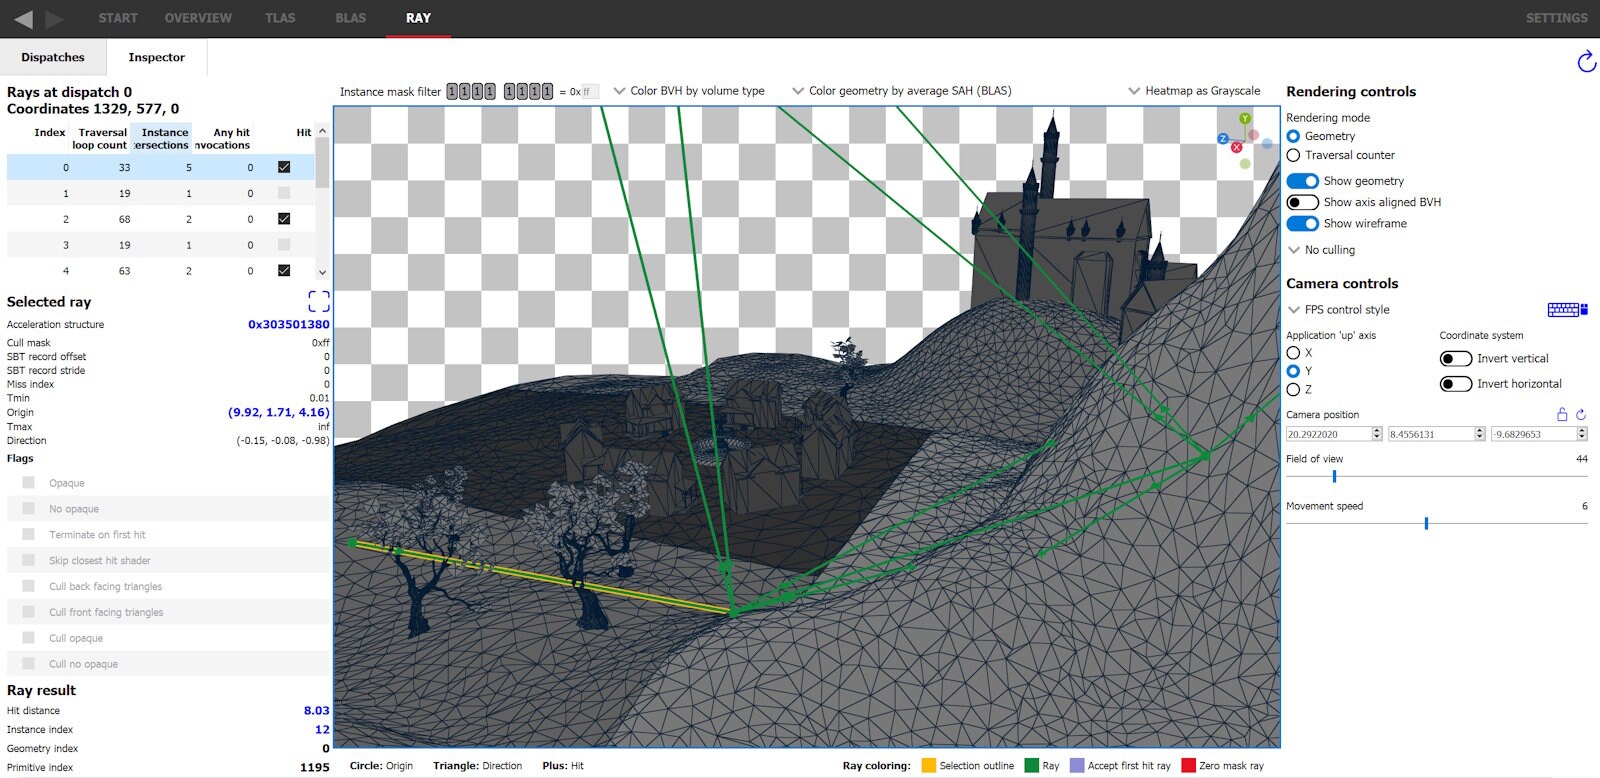
The inspector shows that currently none of the rays use this flag since they are all colored green, but a majority of the rays are used to check if the hit location is shadowed by the sun or not. These rays have no need to know the closest hit, just whether or not there was a hit so it makes sense to mark these with the RAY_FLAG_ACCEPT_FIRST_HIT_AND_END_SEARCH. After making this change in the app, we see the shadow rays are now colored as lavender.
The ray dispatches pane shows that the average traversal loop count per ray has dropped from 28.24 to 26.01 from this change.
The simplest and most effective way of improving ray tracing performance is by casting fewer rays. By switching to the heatmap ray count coloring mode it becomes apparent that either 10 or 6 rays will be cast if the primary ray does not miss.
Let’s inspect the dispatch coordinate previously selected below the mountain to see if it’s possible to use fewer rays anywhere. With the dispatch coordinate selected, switch to the Inspector tab.
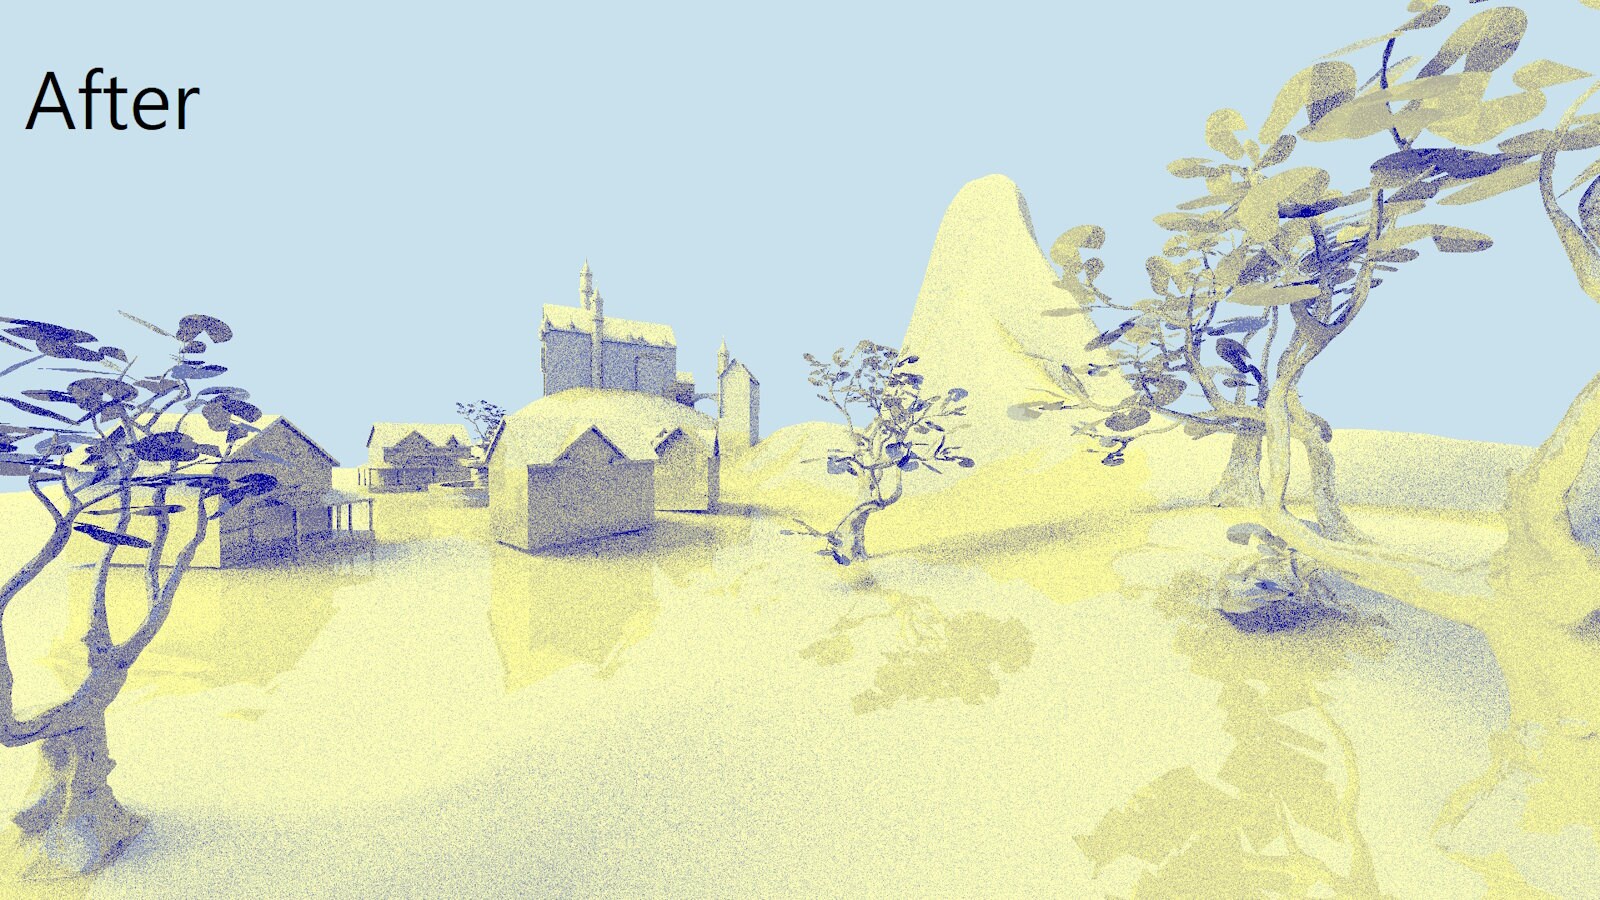
There are 10 rays cast, one is the primary ray cast from the camera, then 4 shadow rays are cast from the hit point as well as one reflection ray which has its own 4 shadow rays cast at its closest hit. The primary and reflection rays are both followed by 4 shadow rays, but in the rendered image the reflections are quite subtle. Then maybe fewer shadow rays could be used for the reflections without degrading the image quality in a noticeable way. By changing the sample application to cast only 2 shadow rays after the reflection ray, it yields the following image.
And checking the ray inspector we can verify that fewer rays are being cast.
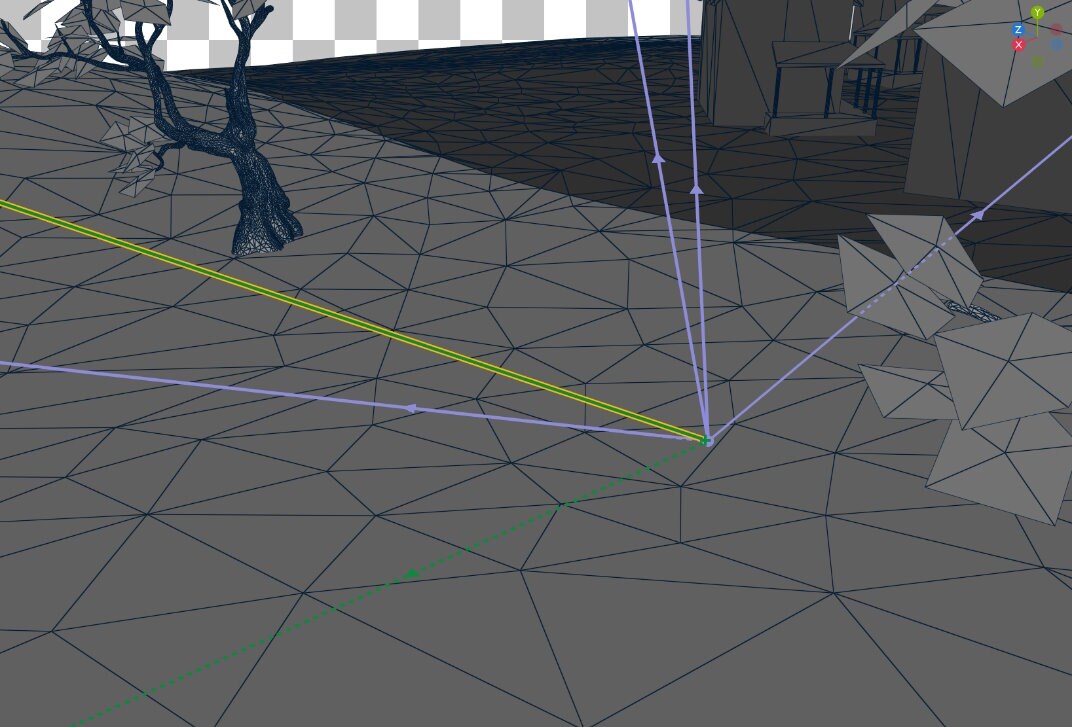
The shadow rays directions are drawn from a distribution that favors directions towards the scene’s direction light. Looking at rays being cast from triangles facing away from the direction light reveals another optimization opportunity.
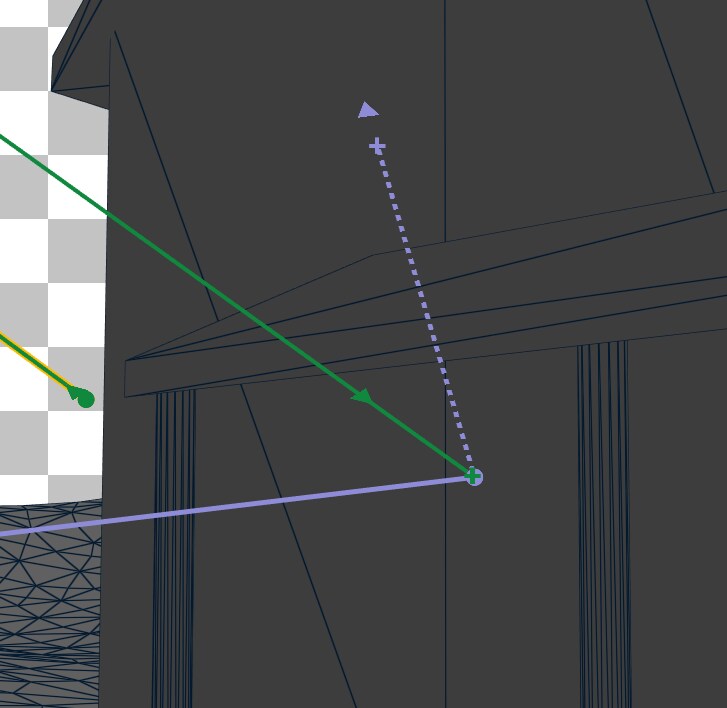
The dashed line of the ray means that the ray is occluded by triangle geometry. Then this shadow ray is being cast directly into the wall of the house, even though it’s obvious the result will be a hit. These shadow rays can be avoided altogether by checking in the shader if the dot product between the new ray direction and the triangle normal is negative. After implementing these changes, the dispatches pane shows that we are now casting 9,437,792 rays instead of the previous 10,875,244.
Games using both rasterization and ray tracing can reduce rays further by skipping the primary ray, and placing the origins of secondary rays using the depth buffer.
Any-hit shaders are invoked during traversal when an alpha-tested triangle is a hit candidate. Invoking a shader during such a hot code path can be detrimental to performance, so it is recommended to reduce or eliminate the usage of any-hit shaders.
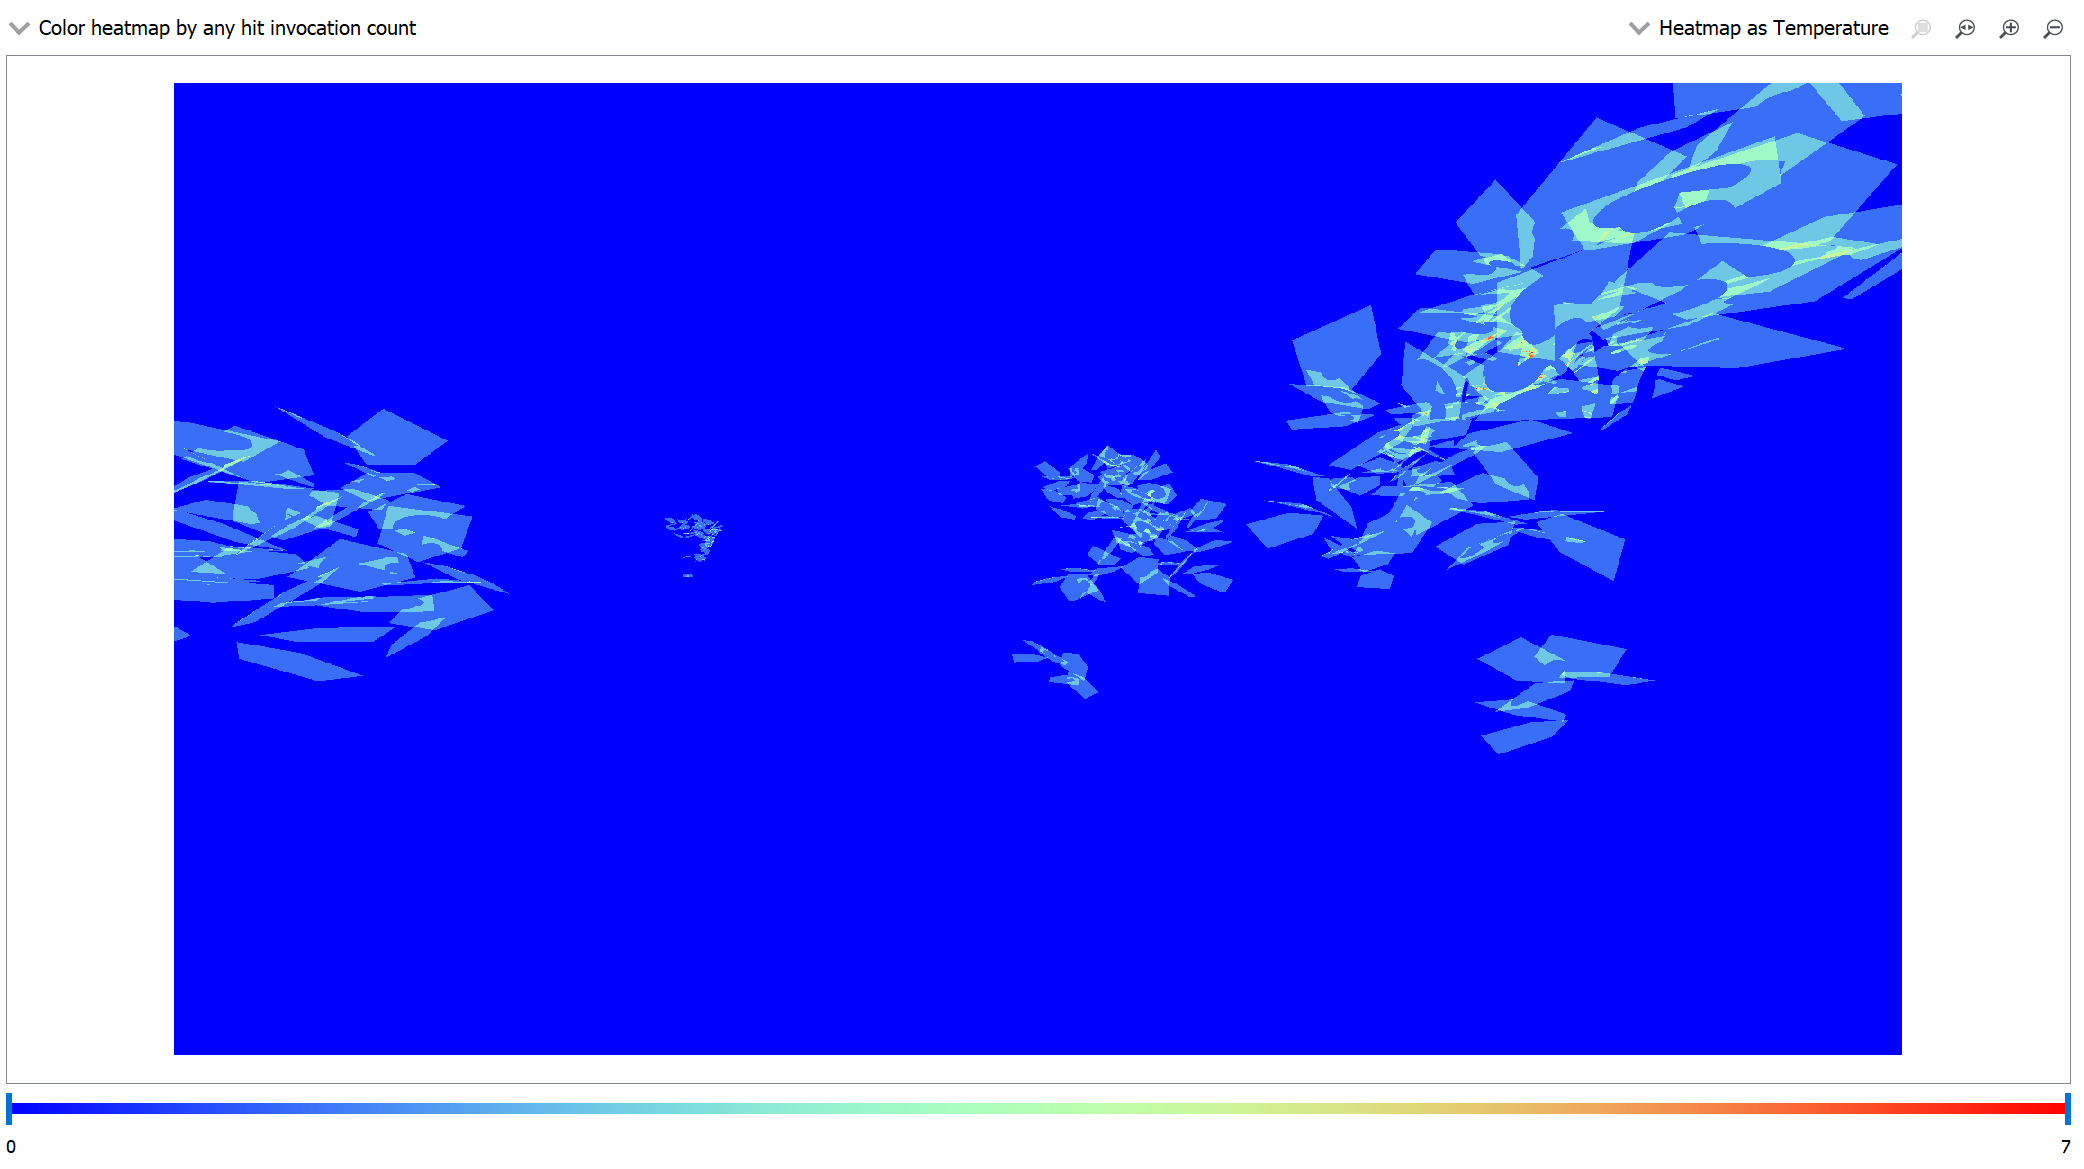
In the dispatches pane, changing the dropdown to “Color heatmap by any hit invocation count” will reveal the dispatch coordinates that invoked any-hit shaders.
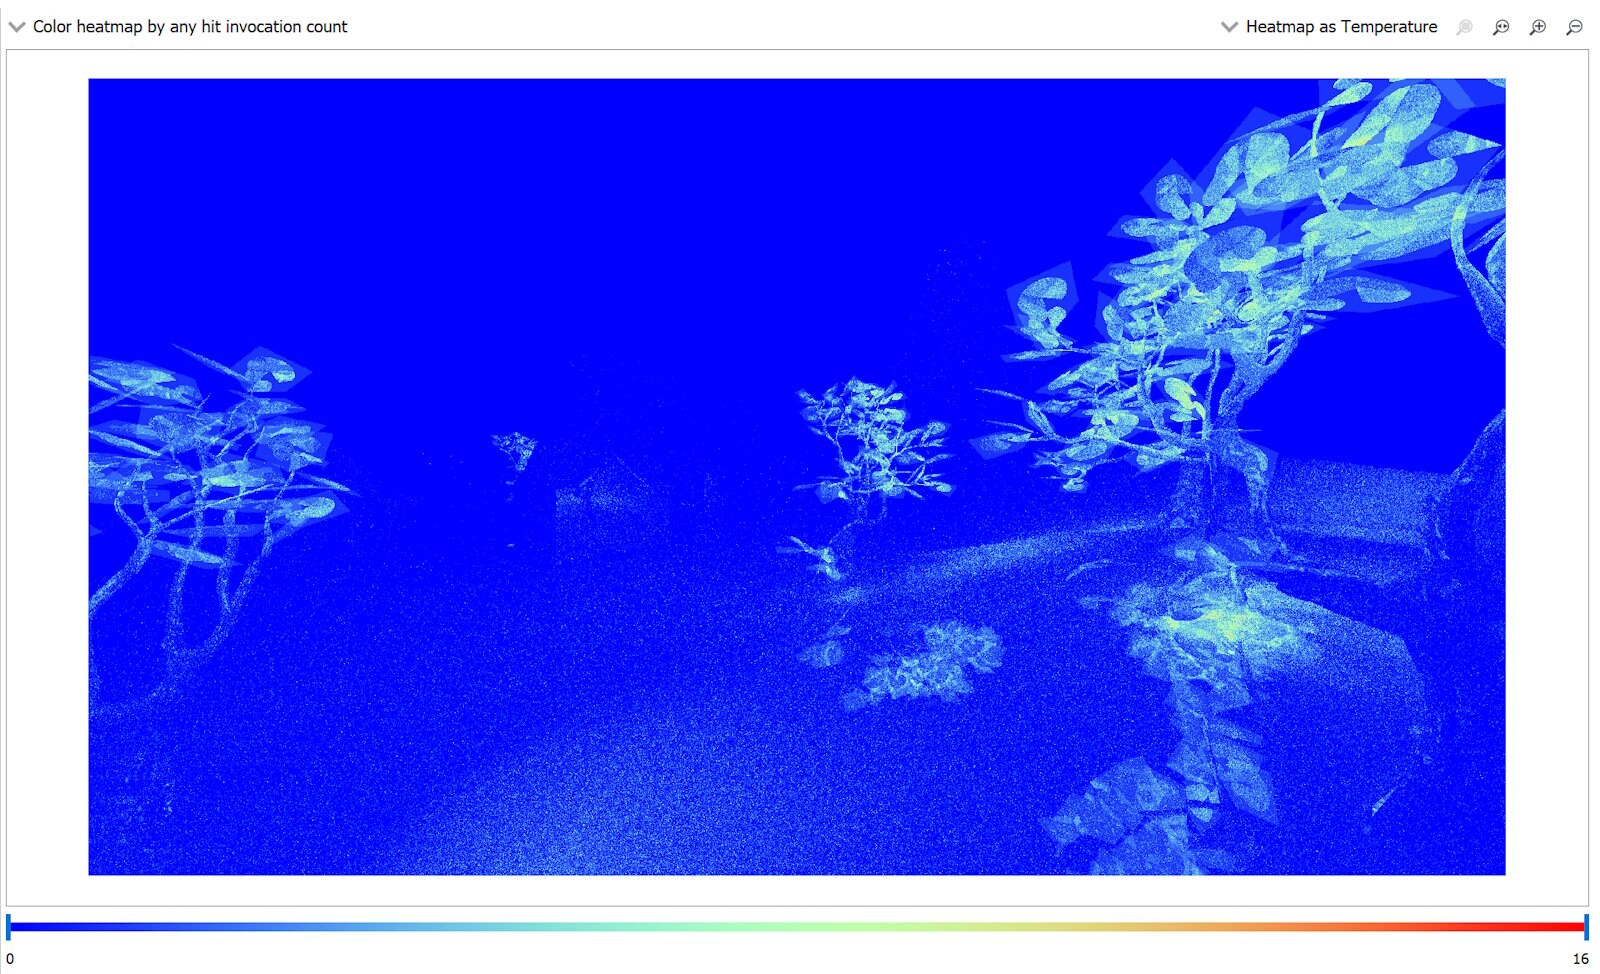
In the sample application, the leaves of the trees are the only non-opaque geometry, so each any-hit invocation is caused by a ray intersecting with one of the leaf triangles. It’s important that the primary rays invoke the any-hit shader since this has an easily recognizable effect on the final image (the lily pad shape of the leaves) but the reflection and shadow rays may be able to skip invoking the any-hit shader without significantly degrading the image quality. By passing the ray flag RAY_FLAG_FORCE_OPAQUE on all but the primary ray, the number of any-hit invocations is significantly reduced as shown in the heatmap image, changing from 1,360,096 to 323,359 total invocations.
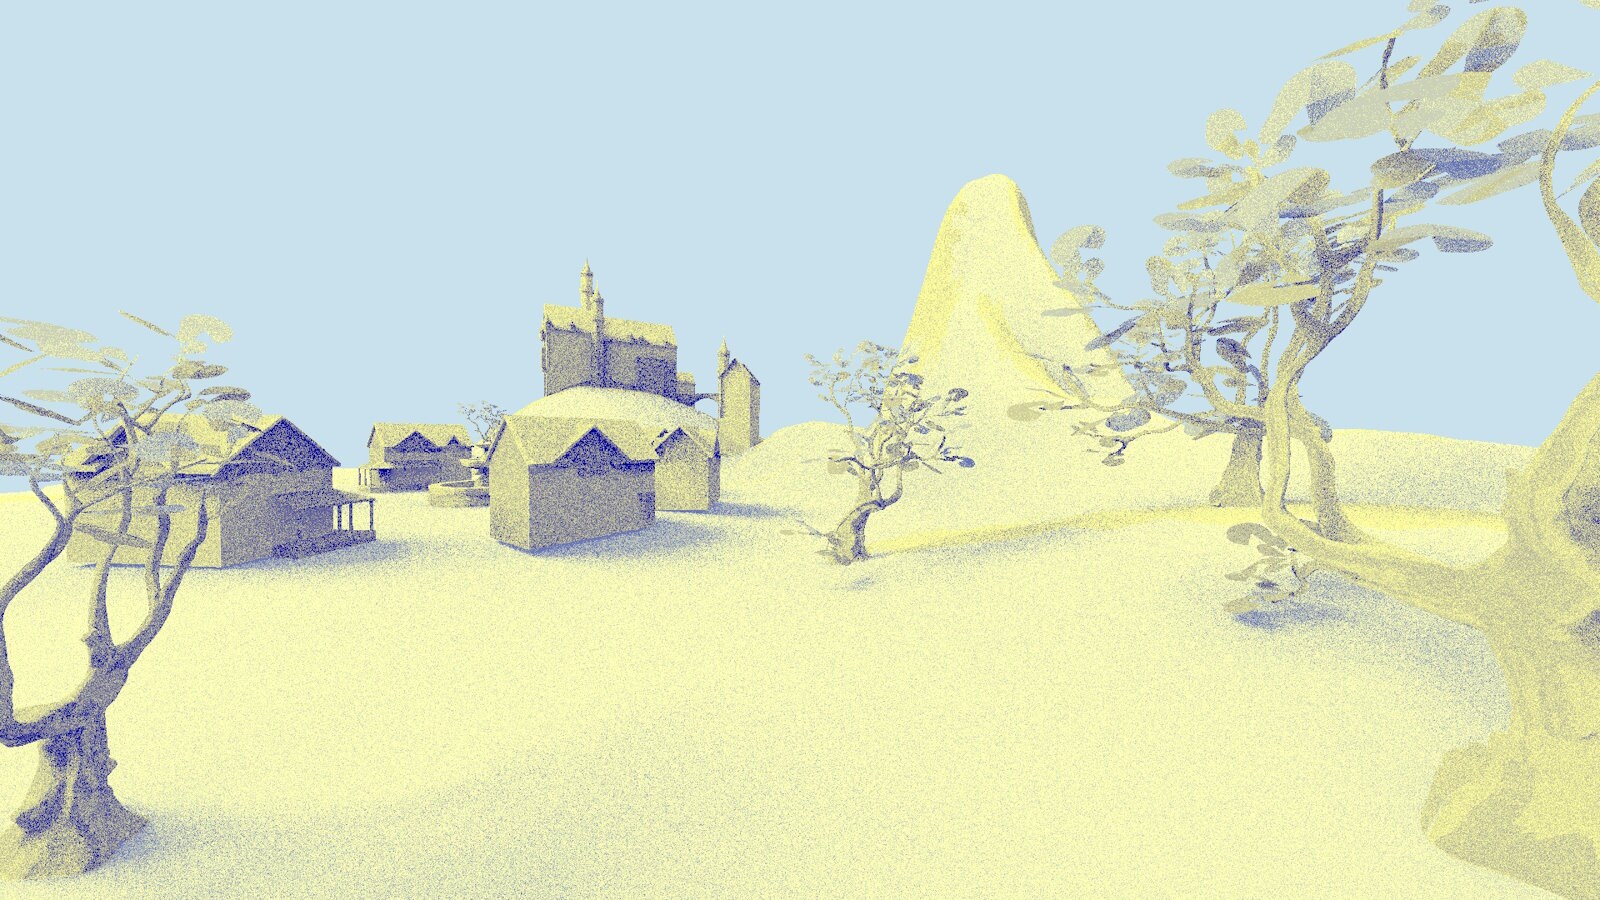
And the rendered image has not suffered a significant reduction in quality.
Note that even if a hit group does not have an any-hit shader, it is still detrimental to performance to have a geometry using that hit group marked as non-opaque, so be sure to mark each geometry as opaque unless it needs to use an any-hit shader.
Not only can the ray features help spot performance bottlenecks but it’s a useful tool to understand what is happening in ray tracing shaders and to debug rays that are being cast in unintended ways. Without the ability to inspect each ray, the only hint to how the rays are being cast is the output of the dispatch. In the example app, after introducing a shader bug, the resulting image is the following.
What happened to the reflections? Based on the rendered image, it’s not obvious. Taking a trace and looking at the ray inspector reveals that the reflection ray is cast into the ground and at an unexpected angle, but the shadow rays seem to be ok.
Visually it seems like the direction the reflected ray is bouncing is what we would expect if the incident ray were coming from the opposite direction. Checking the incident ray parameter of the reflect function in the shader shows that it was indeed negative.
Implementing each of the optimizations mentioned here results in using only 66.3% of the original render time*, going from 5.458 milliseconds to 3.621 milliseconds while keeping the rendered image similar to the original. The tree shadows are darker in the second image due to the shadow rays not invoking the any-hit shader, but this could be alleviated by making a simplified triangle mesh with small triangles for the leaves and using this instance only for the shadow rays using instance masks.
*Tested with an AMD Ryzen 9 7950X 16-Core Processor, 64 GB RAM, and Radeon RX 7900 XTX at 1080p.