

GDC 2024 – Post-mortem GPU crash analysis with AMD Radeon™ GPU Detective (RGD) – YouTube link
This session covers different types of failures – when they occur, why they are difficult to debug, and how RGD can help to identify a crash’s root cause.
GDC 2024: We reveal incredible Work Graphs perf, AMD FSR 3.1, GI with Brixelizer, and so much more
Learn about our GDC 2024 activities, including AMD FSR 3.1, AMD FidelityFX Brixelizer, work graphs, mesh shaders, tools, CPU, and more.
GDC 2024: Work graphs, mesh shaders, FidelityFX™, dev tools, CPU optimization, and more.
Our GDC 2024 presentations this year include work graphs, mesh shaders, AMD FSR 3, GI with AMD FidelityFX Brixelizer, AMD Ryzen optimization, RGD, RDTS, and GPU Reshape!
Radeon™ GPU Detective adds Vulkan® support on Windows®
The latest version of Radeon™ GPU Detective is out now! RGD v1.1 introduces support for post-mortem analysis of Vulkan applications on Windows.
Getting Started with Radeon™ GPU Detective 1.0
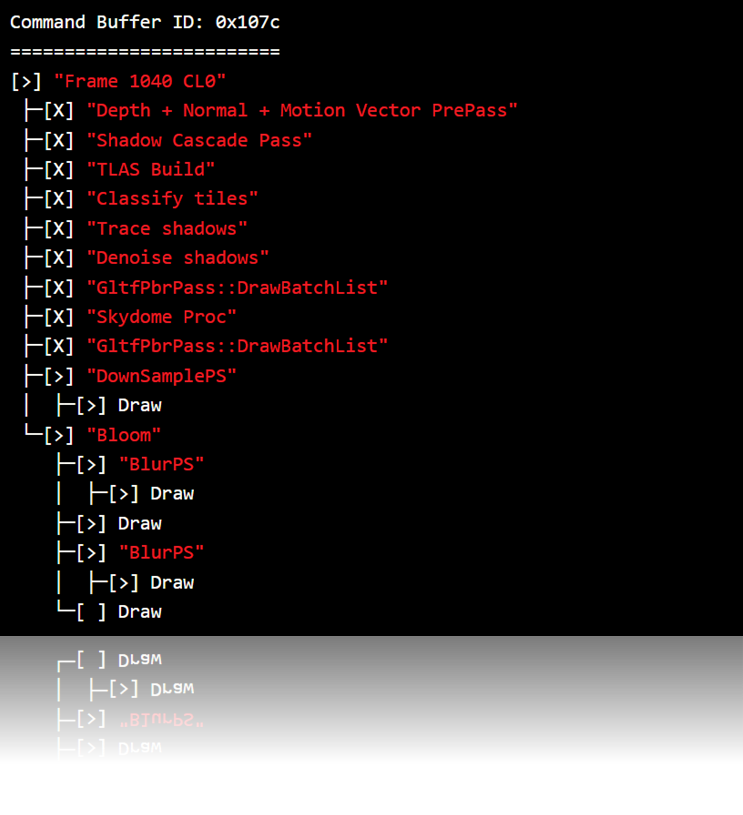
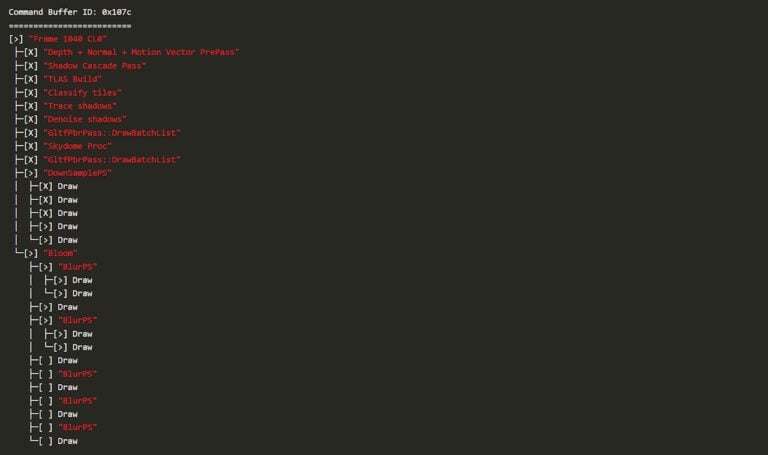
Radeon GPU Detective (RGD) is a brand-new tool which is designed to help you capture and investigate GPU crashes. This tutorial covers how to use RGD to capture a crash and how to interpret the results it produces.
Radeon™ GPU Detective (RGD) 1.0 is now available
Radeon™ GPU Detective (RGD) is our brand-new tool for investigating GPU crashes. RGD is included in the Radeon Developer Tool Suite and is available now!

Radeon GPU Analyzer is an offline compiler and performance analysis tool for DirectX®, Vulkan®, SPIR-V™, OpenGL® and OpenCL™.
RGP gives you unprecedented, in-depth access to a GPU. Easily analyze graphics, async compute usage, event timing, pipeline stalls, barriers, bottlenecks, and other performance inefficiencies.
This is a Visual Studio® Code extension for Radeon GPU Analyzer (RGA) to allow you to use RGA directly from within VS Code.
Radeon™ Memory Visualizer (RMV) is a tool to allow you to gain a deep understanding of how your application uses memory for graphics resources.
The RDP provides a communication channel with the Radeon™ Adrenalin driver. It generates event timing data used by the Radeon™ GPU Profiler (RGP), and the memory usage data used by the Radeon™ Memory Visualizer (RMV).
Radeon™ Raytracing Analyzer (RRA) is a tool which allows you to investigate the performance of your raytracing applications and highlight potential bottlenecks.
GPU Reshape is a powerful tool that leverages on-the-fly instrumentation of GPU operations with instruction level validation of potentially undefined behavior.
If you want to know how well a game is performing on your machine in real-time with low overhead, OCAT has you covered.
Compressonator is a set of tools to allow artists and developers to more easily work with compressed assets and easily visualize the quality impact of various compression technologies.