AMD Radeon™ GPU Detective
AMD Radeon™ GPU Detective (RGD) is a tool for post-mortem analysis of GPU crashes. RGD can capture AMD GPU crash dumps from DirectX® 12 apps.
Radeon GPU Detective (RGD) is a tool for post-mortem analysis of GPU crashes. The tool allows developers to capture and analyze AMD GPU crash dumps and produce information that can help narrow down the search for a crash’s root cause. Such information includes page fault details, resource details and execution markers reflecting the GPU work that was in progress at the moments leading to the crash.
In this tutorial, we will learn how to use RGD v1.0, which targets GPU crashes on Windows.
RGD v1.0 is designed to capture GPU crashes on Windows. If a GPU fault (such as memory page fault or infinite loop in a shader) causes the GPU driver to not respond to the OS for some pre-determined time period (the default on Windows is 2 seconds), the OS will detect that and attempt to restart or remove the device. This mechanism is also known as “TDR” (Timeout Detection and Recovery) and is what we consider to be a GPU crash for the scope of this tool.
From a functional perspective, when a GPU crash happens, the screen may flash or turn black for a few seconds and the “AMD Bug Report Tool” window will show up.
In the crashing application code, a D3D12 or DXGI function such as IDXGISwapChain::Present() will return an error code such as DXGI_ERROR_DEVICE_RESET, DXGI_ERROR_DEVICE_REMOVED, DXGI_ERROR_DEVICE_HUNG or DXGI_ERROR_DRIVER_INTERNAL_ERROR, and the D3D12 Device object will become unusable.
Note that RGD will not detect pure CPU crashes (for example, CPU null pointer dereference or integer division by zero). You will need to use a CPU debugger for that. Please use CPU debugging mechanisms like Microsoft® Visual Studio to investigate such cases.
Rendering code which incorrectly uses D3D12 may also fail purely on the CPU and not reach the graphics driver or the GPU. Therefore, such crashes are not captured by RGD. They usually result in DXGI_ERROR_INVALID_CALL error code returned, and are normally detected by the D3D12 Debug Layer.
Before starting, let’s summarize the requirements to make sure the tool is relevant for your use case:
Note that the tool is putting the driver into a Crash Analysis mode with a more strict page fault handling policy. This means that page faults that may not crash your game on specific AMD GPUs in production (without using the tool) will be observed when using RGD. This helps you detect such crashes and have them fixed to improve your game’s stability across AMD GPUs.
Lastly, to make the most out of RGD, it is highly recommended to use string markers around render passes using the AMD GPU Services (AGS) library, similarly to RGP and name Direct3D 12 memory objects (heaps, buffers, textures) using ID3D12Object::SetName(), as these strings appear in the crash analysis summary files and can help identifying the relevant resources in case of a page fault.
Now we are finally ready to begin.
We will start by downloading the latest version of the Radeon Developer Tool Suite which includes RGD. You can download the package from our GPUOpen Tools page.
Using RGD is straightforward. We start by launching the Radeon Developer Panel (RDP), in a similar way to other RDTS tools like Radeon GPU Profiler (RGP), Radeon Memory Visualizer (RMV) and Radeon Raytracing Analyzer (RRA).
Launch Radeon Developer Panel (RDP): “RadeonDeveloperPanel.exe”.
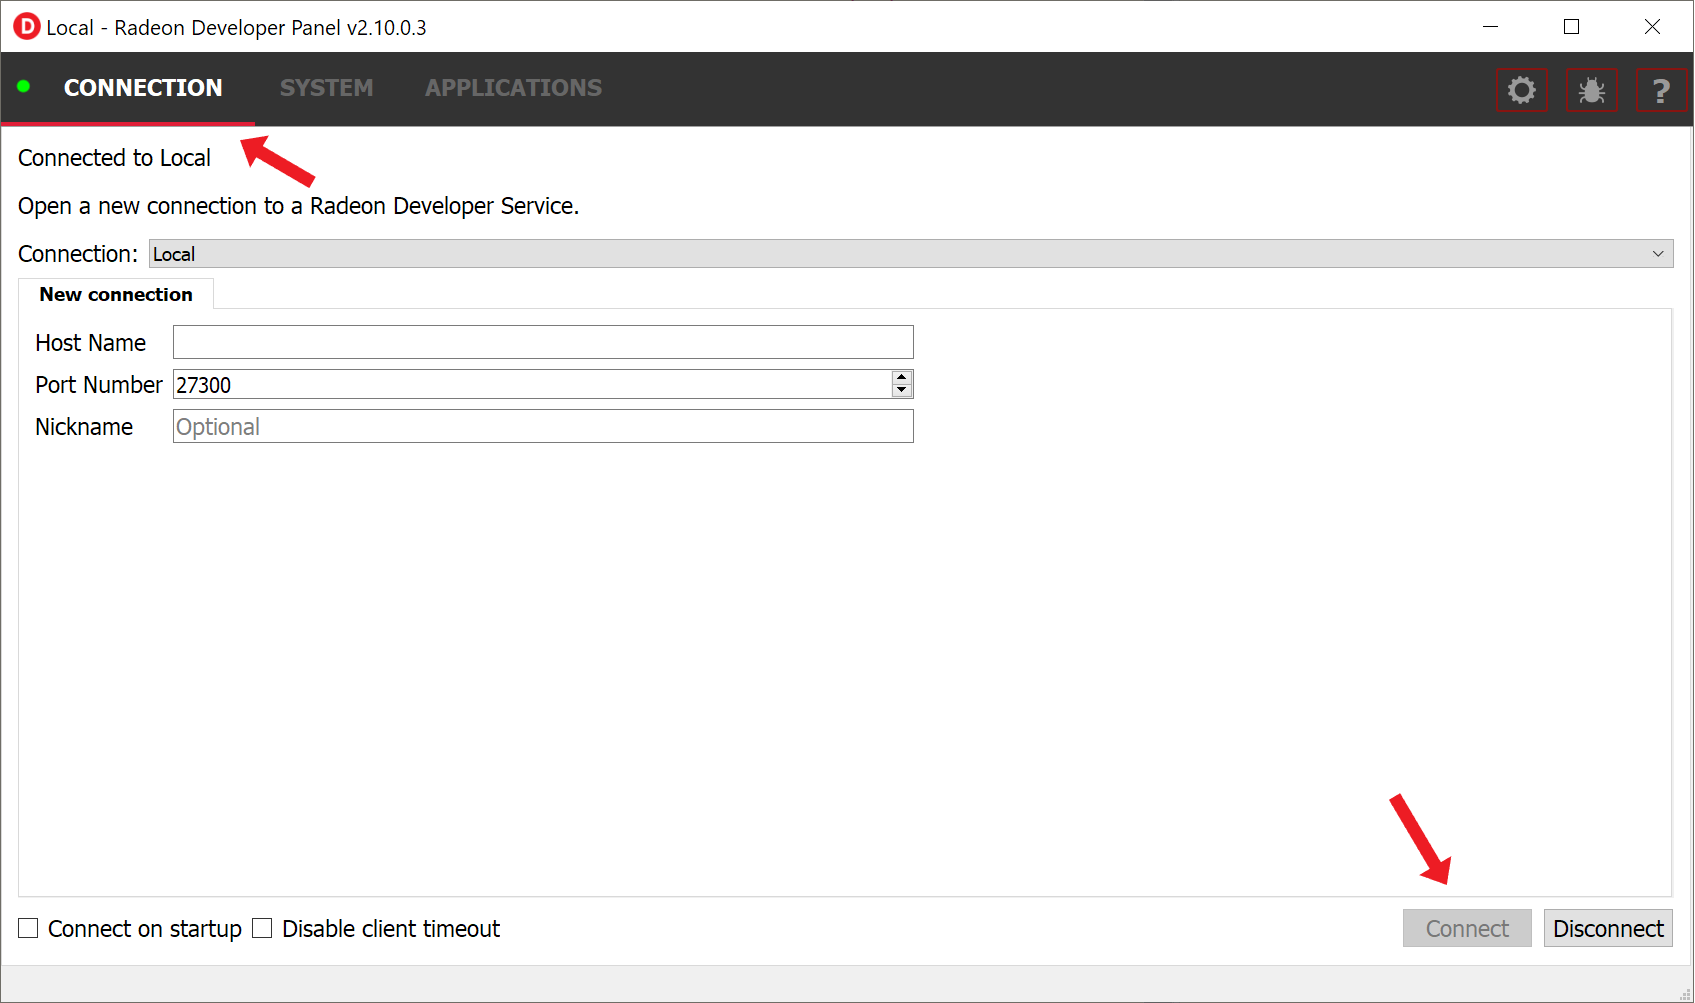
A window of the RDP application appears.
If it wasn’t configured to happen automatically, we need to make a local connection by pressing the “Connect” button.
A green circle appears at the top-left corner of the window, indicating that the connection is active. This is a connection from the tool directly to the AMD graphics driver.
 {w=969px}
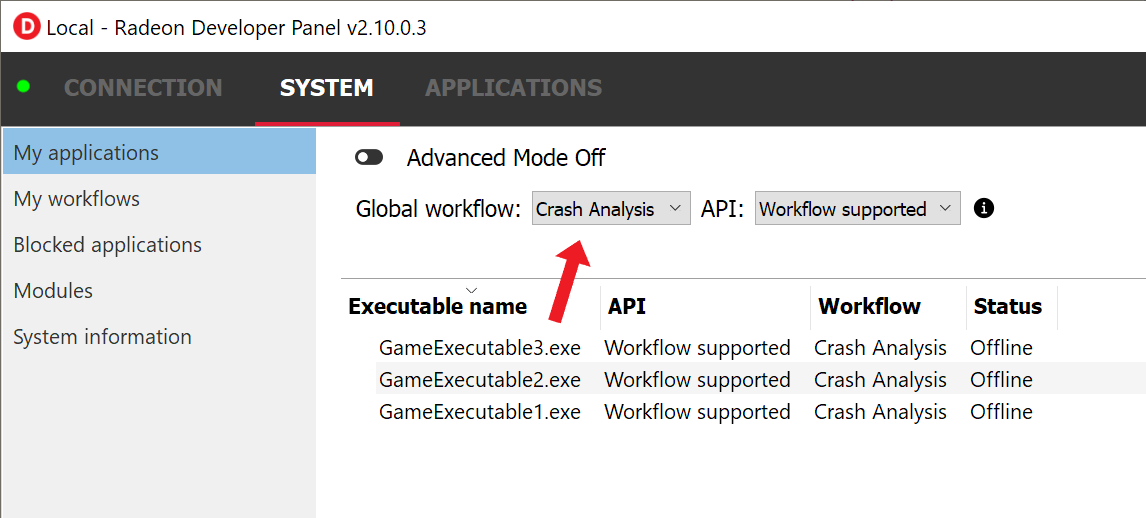
On the “SYSTEM” -> “My applications” tab, select Global workflow = “Crash Analysis”. This is the new workflow we added for RGD. It will put the driver into Crash Analysis mode and let us capture an AMD GPU crash dump (.rgd file) upon a GPU crash.
 {w=655px}
Launch the game. The game can be launched as a standalone executable, from a launcher like Steam, Epic Launcher, or in any other way.
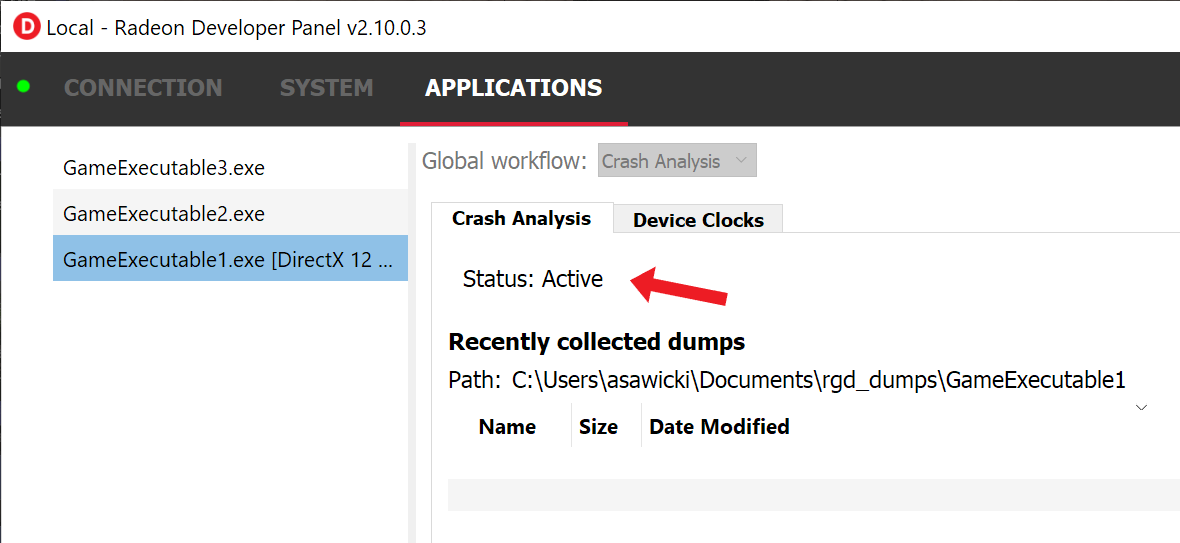
If RDP detects the game to be running and using Direct3D 12, it will automatically switch to a new tab dedicated to that executable and show “Status: Active”.
 {w=674px}
Play the game and reproduce the crash.
With RGD v1.0, the performance overhead of having Crash Analysis is usually low, so in most cases games should be perfectly playable during the crash repro step. You also don’t need to worry about the length of your session. Although the size of the AMD GPU crash dump file, if one is created, can grow over time, it usually weighs around tens of megabytes.
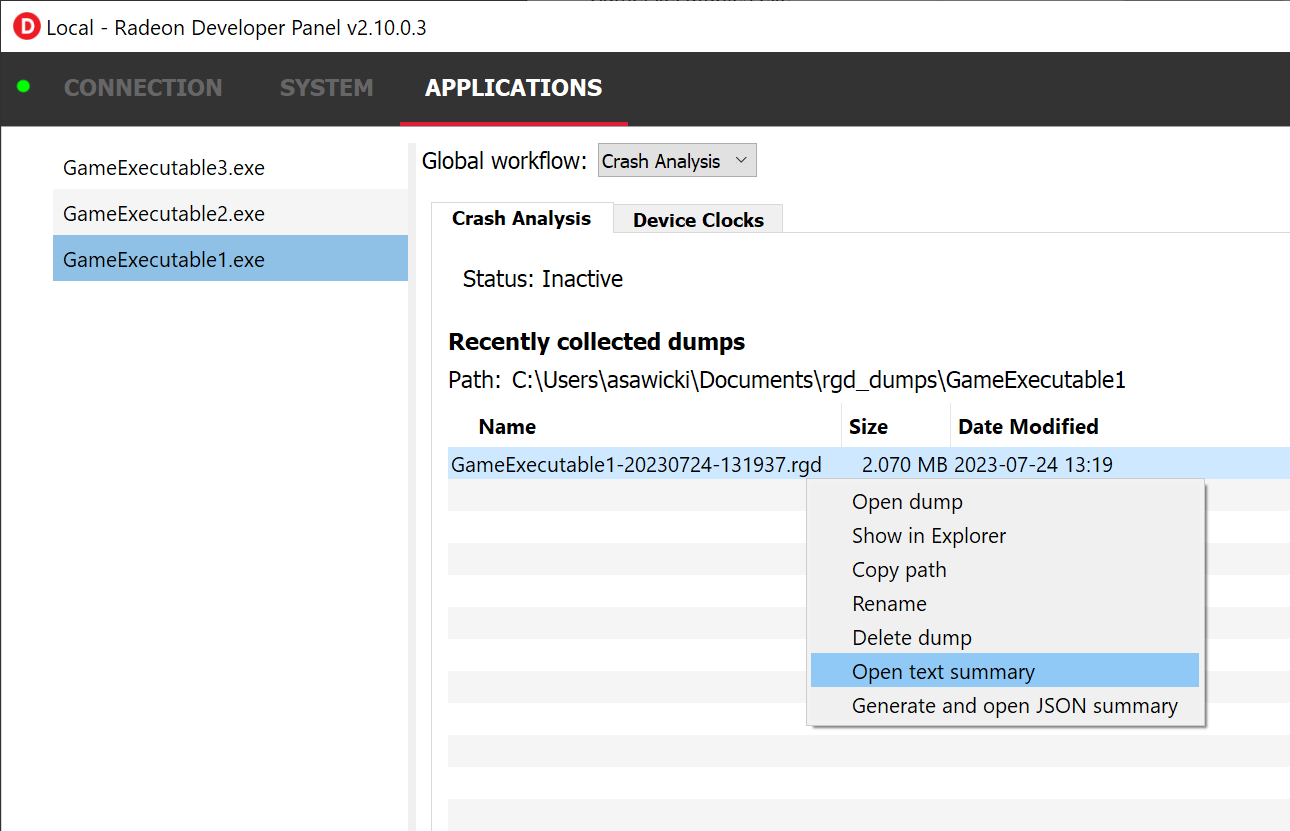
When a TDR is detected and the game terminates, a new AMD GPU crash dump file (.rgd file) is created. It appears on the “Recently collected dumps” list in RDP, still on the tab dedicated to the specific game executable.
When we double-click on the crash dump or right-click and select “Open text summary” from the context menu, a text file is opened in the system text editor, presenting the report from the crash.
 {w=737px}
That’s it! Let’s double-click on the .rgd file to open the Crash Analysis summary text file and learn how to interpret the results.
The crash analysis text file consists of the following sections:
Let’s dig a little deeper into the relevant sections.
The two first sections (CRASH ANALYSIS FILE and SYSTEM INFO) are self explanatory. They provide information that helps identify the configuration on which the crash happened and provides basic details about the crash analysis session. This information will also be useful to us at AMD, in case that you choose to share an AMD GPU crash dump file with us.
The “EXECUTION MARKER TREE” section is key to understanding the work that happened on the GPU at the moments leading to the crash. It includes a hierarchy of command lists, draw calls, and render passes that were in progress when the crash occurred. Note that there are two types of markers: default markers, which are baked into the driver around key render ops, and user markers which you, the app developer, can add in the app’s code. By default, if no user markers are added in the app’s code, you will see a flat list of render ops such as draw calls (printed as e.g. “Draw”) and compute dispatches (printed as “Dispatch”). To make the most out of the tool, it is highly recommended to add user markers in the app’s source code with meaningful string names around render passes and other logical parts of your render frame. That way, the crash analysis summary file will include a hierarchical visualization of the GPU work that happened during the crash in the form of a tree. Here is an example:
Command Buffer ID: 0x107c=========================[>] "Frame 1040 CL0" ├─[X] "Depth + Normal + Motion Vector PrePass" ├─[X] "Shadow Cascade Pass" ├─[X] "TLAS Build" ├─[X] "Classify tiles" ├─[X] "Trace shadows" ├─[X] "Denoise shadows" ├─[X] "GltfPbrPass::DrawBatchList" ├─[X] "Skydome Proc" ├─[X] "GltfPbrPass::DrawBatchList" ├─[>] "DownSamplePS" │ ├─[X] Draw │ ├─[X] Draw │ ├─[X] Draw │ ├─[>] Draw │ └─[>] Draw └─[>] "Bloom" ├─[>] "BlurPS" │ ├─[>] Draw │ └─[>] Draw ├─[>] Draw ├─[>] "BlurPS" │ ├─[>] Draw │ └─[>] Draw ├─[ ] Draw ├─[ ] "BlurPS" ├─[ ] Draw ├─[ ] "BlurPS" ├─[ ] Draw ├─[ ] "BlurPS" └─[ ] DrawThere are several ways to add user markers so that they appear in the RGD output files:
PIXBeginEvent, PIXEndEvent calls) are not supported, since they are consumed by Microsoft DirectX runtime and don’t reach our driver, we do offer replacement headers that insert these markers automatically, for easy integration. You can find this in the Radeon Developer Tool Suite package under “samples/AmdDxExt/AmdPix3.h”. For more details on how to use this mechanism, please refer to this section in the RGP documentation.D3D12.EmitRgpFrameMarkers is set to 1.The execution marker status is represented by the following symbols:
[X] finished[>] in progress[ ] not startedThe status (not started, in progress, finished) is determined based on commands that are fetched by the GPU from a command list and are executed through the stages of the GPU pipeline, which encompasses more than just execution of the shaders. It means that further passes and draw calls may appear as “in progress” before they start executing their shaders, even if there are barriers between them.
Knowing this, the way to interpret multiple passes and draw calls shown as “in progress” is:
The “MARKERS IN PROGRESS” section summarizes the same information as in the execution marker tree, just in a shorter form. It shows only the list of these markers and draw calls that were in progress during the crash. Each item in this section looks like a path, with / denoting the hierarchy, like this:
Command Buffer ID: 0x107c=========================Frame 1040 CL0/DownSamplePS/Draw [2 repeating occurrences]Frame 1040 CL0/Bloom/BlurPS/Draw [2 repeating occurrences]Frame 1040 CL0/Bloom/DrawFrame 1040 CL0/Bloom/BlurPS/Draw [2 repeating occurrences]As mentioned earlier, the “PAGE FAULT SUMMARY” section appears only when the crash was determined to be caused by a memory page fault. A page fault happens when the GPU tries to access an incorrect or illegal memory address - one where there is no valid buffer, texture, descriptor, command list, or other D3D12 resource. When it happens, we can see the offending virtual address (VA) printed in this section, as well as the details of all the resources that ever existed in the memory of the crashing game process and resided in the offending VA. For example:
Resource id: 0x5a49f0600000a7f Type: Image Name: Postprocessing render target 4 Virtual address: 0x236c00000 [size: 16810352 (16.03 MB), parent address + offset: 0x236c00000 + 0x0, preferred heap: Local] Commit type: COMMITTED Attributes: Create flags: PREFER_SWIZZLE_EQUATIONS | FIXED_TILE_SWIZZLE (24576) Usage flags: SHADER_READ | SHADER_WRITE | RESOLVE_DESTINATION | COLOR_TARGET (27) Image type: 2D Dimensions <x, y, z>: 1920 x 1080 x 1 Swizzle Pattern: XYZW Image Format: X16Y16Z16W16_FLOAT Mip levels: 1 Slices: 1 Sample count: 1 Fragment count: 1 Tiling type: Optimal Resource timeline: 00:00:09.4618368 : Create 00:00:09.4622336 : Bind into 0x236c00000 00:00:09.4622336 : Make Resident into 0x236c00000 00:00:09.4634816 : DestroyThe easiest way to identify a resource is by its Name. If a resource is named in the app’s code using the ID3D12Resource::SetName() D3D12 call, that name will appear in the Name field of that resource in the RGD text output file (“Postprocessing render target 4” in the example above). If a resource was not named, you may still be able to identify the resource based on its parameters, like texture dimensions, pixel format, number of mip levels, etc.
As you can see on the example above, each resource also has a “Timeline” of events associated with it, like Create, Destroy, Bind, Evict, Make Resident. Some of them come from explicit DX12 calls (e.g. the creation of a resource), some are autogenerated by the driver (a resource is bound to a memory allocation and made resident automatically after it is created). The timestamps are in “hh:mm:ss.clks” format, counted since the crashing process started.
Now that we covered the different sections of the crash analysis text output file, let’s step back to look at the big picture. A TDR can happen for various reasons. A general way to interpret the results generated by RGD are:
| Page Fault Detected? | VA has associated resources? | Meaning |
|---|---|---|
| Yes | Yes | Likely an attempt to access a resource that is already released |
| Yes | No (means no resource ever resided in this VA) | Likely out-of-bounds indexing or using garbage data as index/pointer |
| No | No | Hang, e.g. an infinite loop in a shader (use markers to narrow down) |
Let’s elaborate:
If a page fault was detected and associated resources are found, it likely means that the bug is about accessing a resource after it has been released or evicted from memory. An incorrect (stale or wrongly indexed) descriptor is a possible cause. It would then be a good idea to examine each of the resource’s timelines:
When resource timeline ends with Destroy event, the resource was accessed by the GPU after it has been released with D3D12 Release() call.
When resource timeline ends with Evict event, the resource was accessed by the GPU after it was evicted with a D3D12 Evict() call.
When resource timeline doesn’t include MakeResident event, the resource was created as non-resident.
If a page fault was detected but no associated resources are found, it likely means that the GPU (e.g. a shader) tried to access memory under incorrect address, which may indicate a bug in address calculation or indexing.
When no page fault was detected, it likely means the crash was not related to memory access, but a different other type of problem, e.g. a shader hang due to timeout (too long execution) or an infinite loop.
Test the game with D32D12 Debug Layer enabled before using the tool. The D3D12 Debug Layer can catch certain errors that do not even make it to the GPU driver or the GPU itself and are not detected by the tool. Doing so can save you a lot of time.
Insert more fine-grained markers: If the execution markers that are shown by RGD do not give you precise enough information about the area of the crash, you can insert more fine-grained markers to your rendering code around some render passes, even individual draw calls and include additional information in their strings, like the name of a material, shader, or specific object. Use the in progress markers shown by RGD as a guideline to where more markers might be needed.
Try DRED with Crash Analysis Enabled: If your code implements custom functionality to report GPU crashes using WriteBufferImmediate() or the Device Removed Extended Data (DRED) API, RGD can be used with it as well. Enabling “Crash Analysis” in RDP can make such custom breadcrumb markers more accurate. To do that, follow the same steps for capturing a GPU crash dump with the relevant application. This will make sure that Crash Analysis mode will be enabled in the driver when your application is run.