AMD Radeon™ GPU Detective
AMD Radeon™ GPU Detective (RGD) is a tool for post-mortem analysis of GPU crashes. RGD can capture AMD GPU crash dumps from DirectX® 12 apps.
Version 1.4 of AMD Radeon™ GPU Detective (RGD), the AMD tool for post-mortem analysis of GPU crashes, brings a powerful new feature to developers’ hands: Hardware Crash Analysis. When enabled, RGD collects low-level information about the GPU hardware state upon crash and augments the information that is presented in the Crash Analysis (.rgd) output file with meaningful insights.
Up to RGD v1.3 every execution marker in the execution marker tree could have been in only one of 3 states:
[X] finished[>] in progress[ ] not startedWith Hardware Crash Analysis, a fourth execution marker state was added. RGD correlates the wavefronts in flight to the execution markers and marks nodes that had a running wavefront during the crash with the [#] symbol:
[#] shader in flightConsider the following sample execution marker tree of a Direct3D® 12 application:
Legend======[X] finished[>] in progress[ ] not started
Command Buffer ID: 0xb14 (Queue type: Direct)=============================================[>] "Frame 694 CL0" ├─[>] "DownSamplePS" │  ├─[X] ----------Barrier---------- │  ├─[X] Draw(VertexCount=3, InstanceCount=1) │  ├─[X] Draw(VertexCount=3, InstanceCount=1) │  ├─[X] Draw(VertexCount=3, InstanceCount=1) │  ├─[>] Draw(VertexCount=3, InstanceCount=1) │  ├─[>] Draw(VertexCount=3, InstanceCount=1) │  └─[>] ----------Barrier---------- ├─[>] "Bloom" │  ├─[>] "BlurPS" │  │  ├─[>] ----------Barrier---------- │  │  ├─[>] Draw(VertexCount=3, InstanceCount=1) │  │  ├─[>] ----------Barrier---------- │  │  ├─[>] Draw(VertexCount=3, InstanceCount=1) │  │  └─[>] ----------Barrier---------- │  ├─[>] ----------Barrier---------- │  ├─[>] Draw(VertexCount=3, InstanceCount=1) │  ├─[>] ----------Barrier---------- │  ├─[>] "BlurPS" │  │  ├─[>] ----------Barrier---------- │  │  ├─[>] Draw(VertexCount=3, InstanceCount=1) │  │  ├─[>] ----------Barrier---------- │  │  ├─[>] Draw(VertexCount=3, InstanceCount=1) │  │  └─[ ] ----------Barrier---------- │  ├─[ ] ----------Barrier----------
The above execution marker tree already takes us a long way towards identifying the offending draw call. It can be any of the “in-progress” ([>]) markers. There are quite a few draw calls in progress but
considering the massive number of draw calls that can be in flight during a crash narrowing down to only several potentially offending draw calls is a huge time saver on its own.
However, as you can see below, the Hardware Crash Analysis feature takes us even further, by identifying the in-progress markers that were executed by an in-flight shader during the crash. This is how the same execution marker tree looks when the AMD GPU crash dump (.rgd file) is captured with Hardware Crash Analysis enabled:
Legend======[X] finished[>] in progress[#] shader in flight[ ] not started

Command Buffer ID: 0xb14 (Queue type: Direct)=============================================[>] "Frame 694 CL0" ├─[>] "DownSamplePS" │  ├─[X] ----------Barrier---------- │  ├─[X] Draw(VertexCount=3, InstanceCount=1) │  ├─[X] Draw(VertexCount=3, InstanceCount=1) │  ├─[X] Draw(VertexCount=3, InstanceCount=1) │  ├─[#] Draw(VertexCount=3, InstanceCount=1)   <-- has a correlated running wave <SHADER INFO section IDs: {ShaderInfoID1}, API PSO hash = 0x3f0dcc77cb4a94c6, API stages: {Pixel}> │  ├─[#] Draw(VertexCount=3, InstanceCount=1)   <-- has a correlated running wave <SHADER INFO section IDs: {ShaderInfoID1}, API PSO hash = 0x3f0dcc77cb4a94c6, API stages: {Pixel}> │  └─[>] ----------Barrier---------- ├─[>] "Bloom" │  ├─[>] "BlurPS" │  │  ├─[>] ----------Barrier---------- │  │  ├─[>] Draw(VertexCount=3, InstanceCount=1) │  │  ├─[>] ----------Barrier---------- │  │  ├─[>] Draw(VertexCount=3, InstanceCount=1) │  │  └─[>] ----------Barrier---------- │  ├─[>] ----------Barrier---------- │  ├─[>] Draw(VertexCount=3, InstanceCount=1) │  ├─[>] ----------Barrier---------- │  ├─[>] "BlurPS" │  │  ├─[>] ----------Barrier---------- │  │  ├─[>] Draw(VertexCount=3, InstanceCount=1) │  │  ├─[>] ----------Barrier---------- │  │  ├─[>] Draw(VertexCount=3, InstanceCount=1) │  │  └─[ ] ----------Barrier---------- │  ├─[ ] ----------Barrier----------
Note how RGD narrowed down the list of potential culprits to only two specific draw calls in the “DownSamplePS” subtree. Moreover, RGD now identifies the API stage of the crashing shader (Pixel shader in this case), the API pipeline as part of which the shader was executing (through the hash string) and the shader itself (more on that in the next section).
As you can see, the annotation of the in-flight execution markers contains a reference to ShaderInfoID1. This is a handle which you can use to jump to a new section that we added to the RGD output file: the SHADER INFO section. The name ShaderInfoID1 is arbitrary. Its purpose is to serve as a unique string identifier in the scope of the RGD output text file, which will allow you to jump quickly to the relevant sections of the text file when searching that string.
Let’s have a look at the new SHADER INFO section for the same crashing Direct3D® 12 application, which will typically appear at the very end of the RGD output text file:
===========SHADER INFO===========
Shader info ID : ShaderInfoID1API PSO hash   : 0x3f0dcc77cb4a94c6API shader hash: 0x9e7e544426c404defd8c0ea8a6f65c3bAPI stage      : Pixel
Disassembly===========  .  .  .    v_interp_p2_f32 v2, v3, v1, v0 wait_exp:7                  // 000000000360: CD010702 04020303    s_mov_b32 s4, s5                                           // 000000000368: BE840005    s_mov_b32 s5, s9                                           // 00000000036C: BE850009    s_load_b256 s[4:11], s[4:5], null                          // 000000000370: F40C0102 F8000000    s_waitcnt lgkmcnt(0)                                       // 000000000378: BF89FC07    v_mul_f32_e64 v3, 2.0, s0                                  // 00000000037C: D5080003 000000F4    v_mul_f32_e64 v0, 2.0, s1                                  // 000000000384: D5080000 000002F4    s_delay_alu instid0(VALU_DEP_2) | instskip(NEXT) | instid1(VALU_DEP_2)// 00000000038C: BF870112    v_sub_f32_e32 v1, v4, v3                                   // 000000000390: 08020704    v_sub_f32_e32 v3, v2, v0                                   // 000000000394: 08060102    v_fma_f32 v0, s0, 2.0, v4                                  // 000000000398: D6130000 0411E800    v_fma_f32 v6, s1, 2.0, v2                                  // 0000000003A0: D6130006 0409E801    s_mov_b32 s12, 0x8007092                                   // 0000000003A8: BE8C00FF 08007092    s_mov_b32 s13, 0xfff000                                    // 0000000003B0: BE8D00FF 00FFF000    s_mov_b32 s14, 0x64500000                                  // 0000000003B8: BE8E00FF 64500000    s_mov_b32 s15, 0x80000000                                  // 0000000003C0: BE8F00FF 80000000    s_clause 0x8                                               // 0000000003C8: BF850008>   image_sample  v[8:11], [v0, v6], s[4:11], s[12:15] dmask:0xf dim:SQ_RSRC_IMG_2D// 0000000003CC: F06C0F05 0C010800 00000006   <-- ***PAGE FAULT SUSPECT (128 waves)***    image_sample  v[12:15], [v4, v6], s[4:11], s[12:15] dmask:0xf dim:SQ_RSRC_IMG_2D// 0000000003D8: F06C0F05 0C010C04 00000006    image_sample  v[18:21], [v1, v6], s[4:11], s[12:15] dmask:0xf dim:SQ_RSRC_IMG_2D// 0000000003E4: F06C0F05 0C011201 00000006    image_sample  v[22:25], [v0, v2], s[4:11], s[12:15] dmask:0xf dim:SQ_RSRC_IMG_2D// 0000000003F0: F06C0F05 0C011600 00000002    image_sample  v[26:29], [v4, v2], s[4:11], s[12:15] dmask:0xf dim:SQ_RSRC_IMG_2D// 0000000003FC: F06C0F05 0C011A04 00000002    image_sample v[30:33], v[1:2], s[4:11], s[12:15] dmask:0xf dim:SQ_RSRC_IMG_2D// 000000000408: F06C0F04 0C011E01    image_sample  v[34:37], [v0, v3], s[4:11], s[12:15] dmask:0xf dim:SQ_RSRC_IMG_2D// 000000000410: F06C0F05 0C012200 00000003    image_sample  v[4:7], [v4, v3], s[4:11], s[12:15] dmask:0xf dim:SQ_RSRC_IMG_2D// 00000000041C: F06C0F05 0C010404 00000003    image_sample  v[0:3], [v1, v3], s[4:11], s[12:15] dmask:0xf dim:SQ_RSRC_IMG_2D// 000000000428: F06C0F05 0C010001 00000003    s_cmp_eq_i32 s2, 0                                         // 000000000434: BF008002    s_cbranch_scc1 _L5                                         // 000000000438: BFA20041    s_waitcnt vmcnt(7)                                         // 00000000043C: BF891FF7    v_add_f32_e32 v8, v8, v12                                  // 000000000440: 06101908    v_add_f32_e32 v9, v9, v13                                  // 000000000444: 06121B09    v_add_f32_e32 v10, v10, v14                                // 000000000448: 06141D0A    v_add_f32_e32 v11, v11, v15                                // 00000000044C: 06161F0B    s_waitcnt vmcnt(6)                                         // 000000000450: BF891BF7    s_delay_alu instid0(VALU_DEP_4) | instskip(NEXT) | instid1(VALU_DEP_4)// 000000000454: BF870214    v_add_f32_e32 v8, v18, v8                                  // 000000000458: 06101112  .  .  .
You can see that the SHADER INFO section contains only a single shader (ShaderInfoID1), which matches the execution marker tree. Alongside the shader metadata you can see the relevant subset of the crashing shader’s disassembly. If the crash was caused by a page fault that the shader triggered, RGD will mark the offending instruction for you with a [>] prefix in the relevant disassembly line and an annotation that marks the page fault culprit suspect and the number of wavefronts that were executing that instruction at the time of the crash. By default, the tool will only include the relevant subset of the shader’s disassembly in the output file, in order to remove as much noise as possible. Around a page fault suspect instruction, you will find a small number of instructions to give you the context in which the suspect instruction was executing in. The vertical . . . lines denote filtered instructions. In case that you do need to see the full shader disassembly, you can do that by manually running the rgd command line tool with the AMD GPU crash dump (.rgd) file as the input and using the --all-disassembly command line option (refer to the rgd command line tool help manual for more information by running rgd -h).
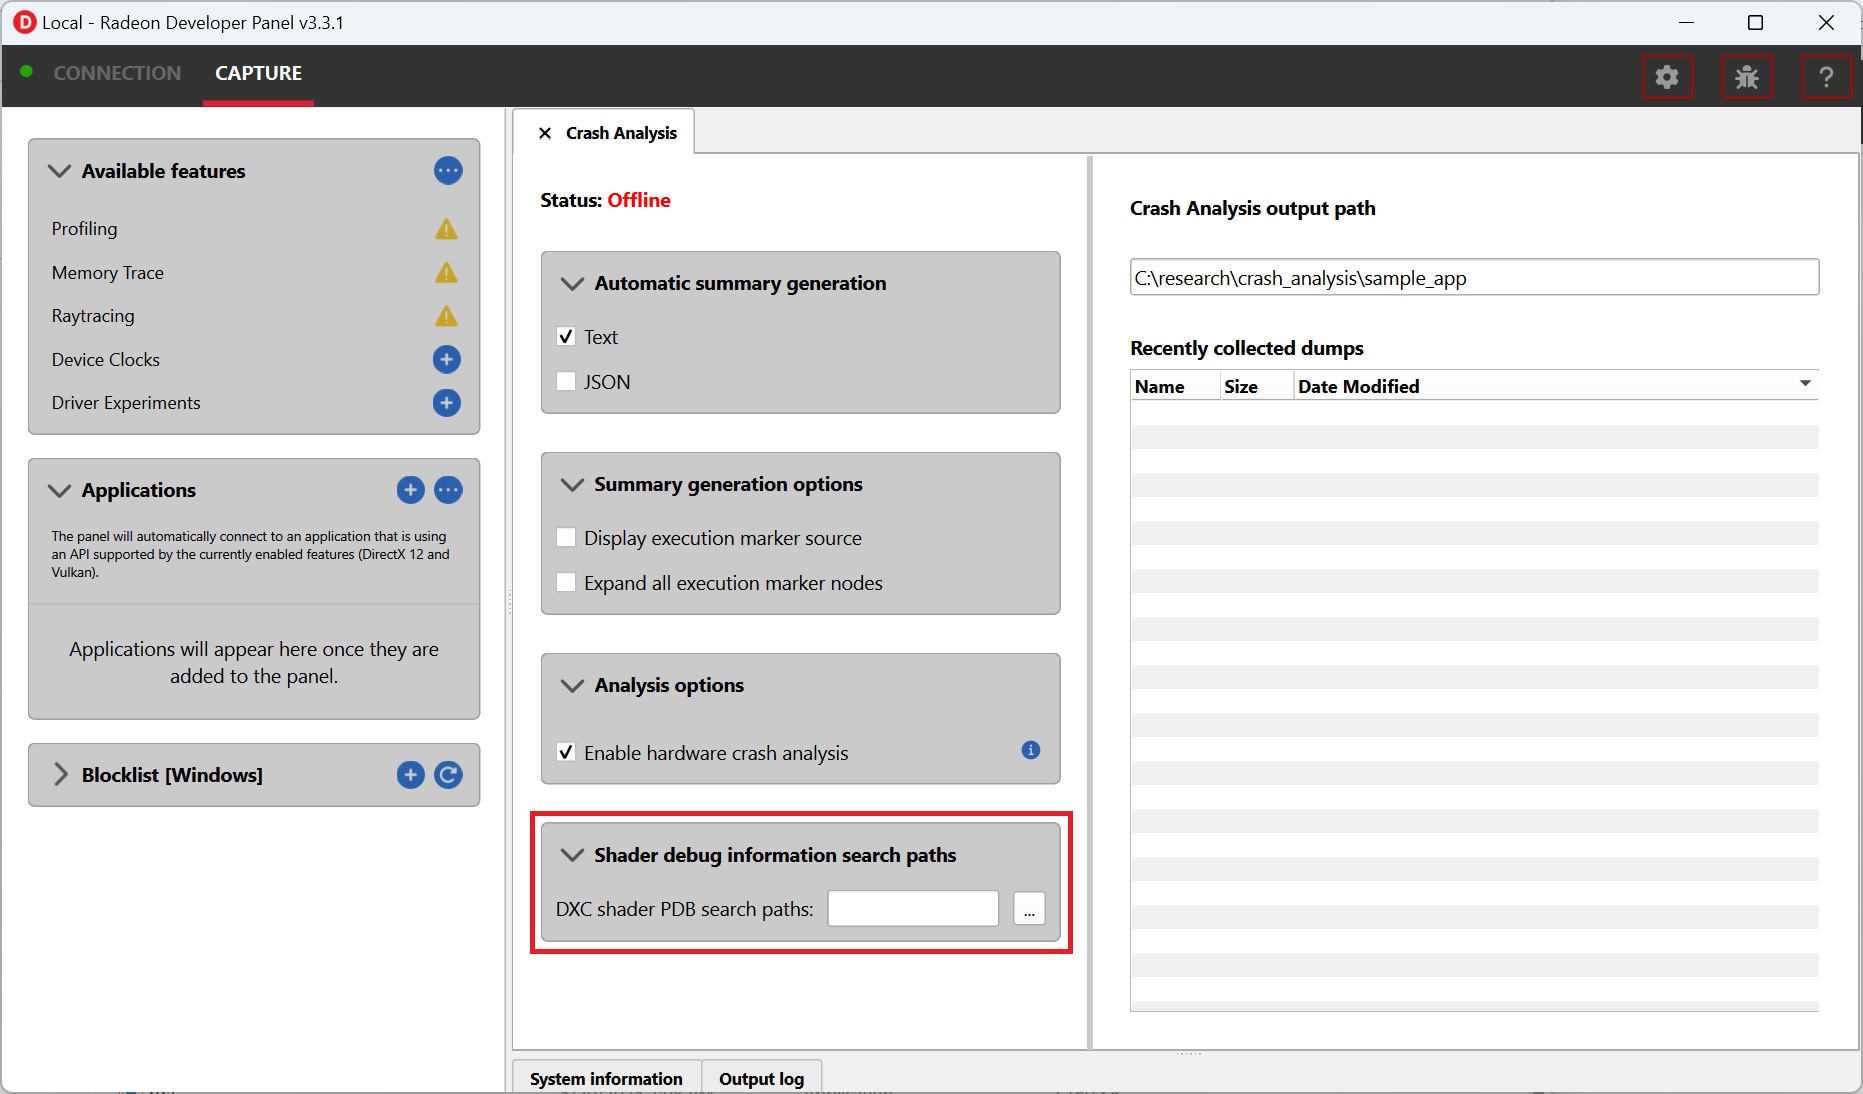
For the tool to be able to retrieve the additional low-level information for your GPU crash case a few things need to happen. First, you must make sure that the Hardware Crash Analysis checkbox is checked in Radeon Developer Panel’s (RDP) Crash Analysis tab (that is the case by default). In addition, since this version of the tool focuses on offending shaders, the GPU crash obviously needs to be triggered by a shader-executing hardware block. If the GPU crash happened somewhere else, no shader will be associated with the execution tree markers, and you will not have the benefits of the new Hardware Crash Analysis mode. However, in the case that your crash case is supported by RGD, you can count on the “standard” (RGD v1.3) information to be included, whether or not the Hardware Crash Analysis feature was applicable to your crash case.
Also, note how RGD currently only provides low-level information as part of this new mode. Details like the high-level or intermediate source code of the crashing shader are not included. We hope to share with you updates about such exciting features in our future release announcements - stay tuned!