


Last month at GDC 2024, we showcased some new functionality across the Radeon™ Developer Tool Suite. You can catch up on what we showed by watching a pre-recorded version of the presentation here.
We are proud to now share the 2.1 release of the Radeon™ GPU Profiler (RGP) that includes some of the new features we talked about as well as a few other enhancements.
New! Interoperability with Radeon™ GPU Analyzer (RGA)
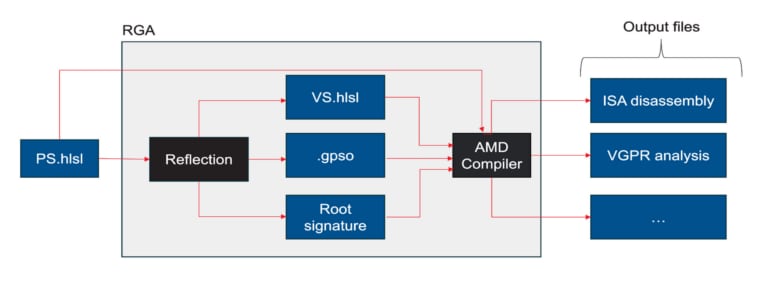
One of the requests we have received from developers using RGP is that they want to take advantage of some of the analysis features provided in RGA. Starting with RGP 2.1, we now provide a simple way to quickly open any shader contained in an RGP data set directly in RGA. This new feature takes advantage of the Binary Analysis mode that was added last year in RGA 2.9. This mode allows the RGA GUI application to load any precompiled AMD GPU code object binary, display the corresponding ISA for any shader contained in the code object and analyze the shaders.
The easiest way to use this feature is to drag and drop any file that contains a compiled code object binary right on to the RGA GUI application. More details on this feature can be seen in the GDC 2024 video linked above.
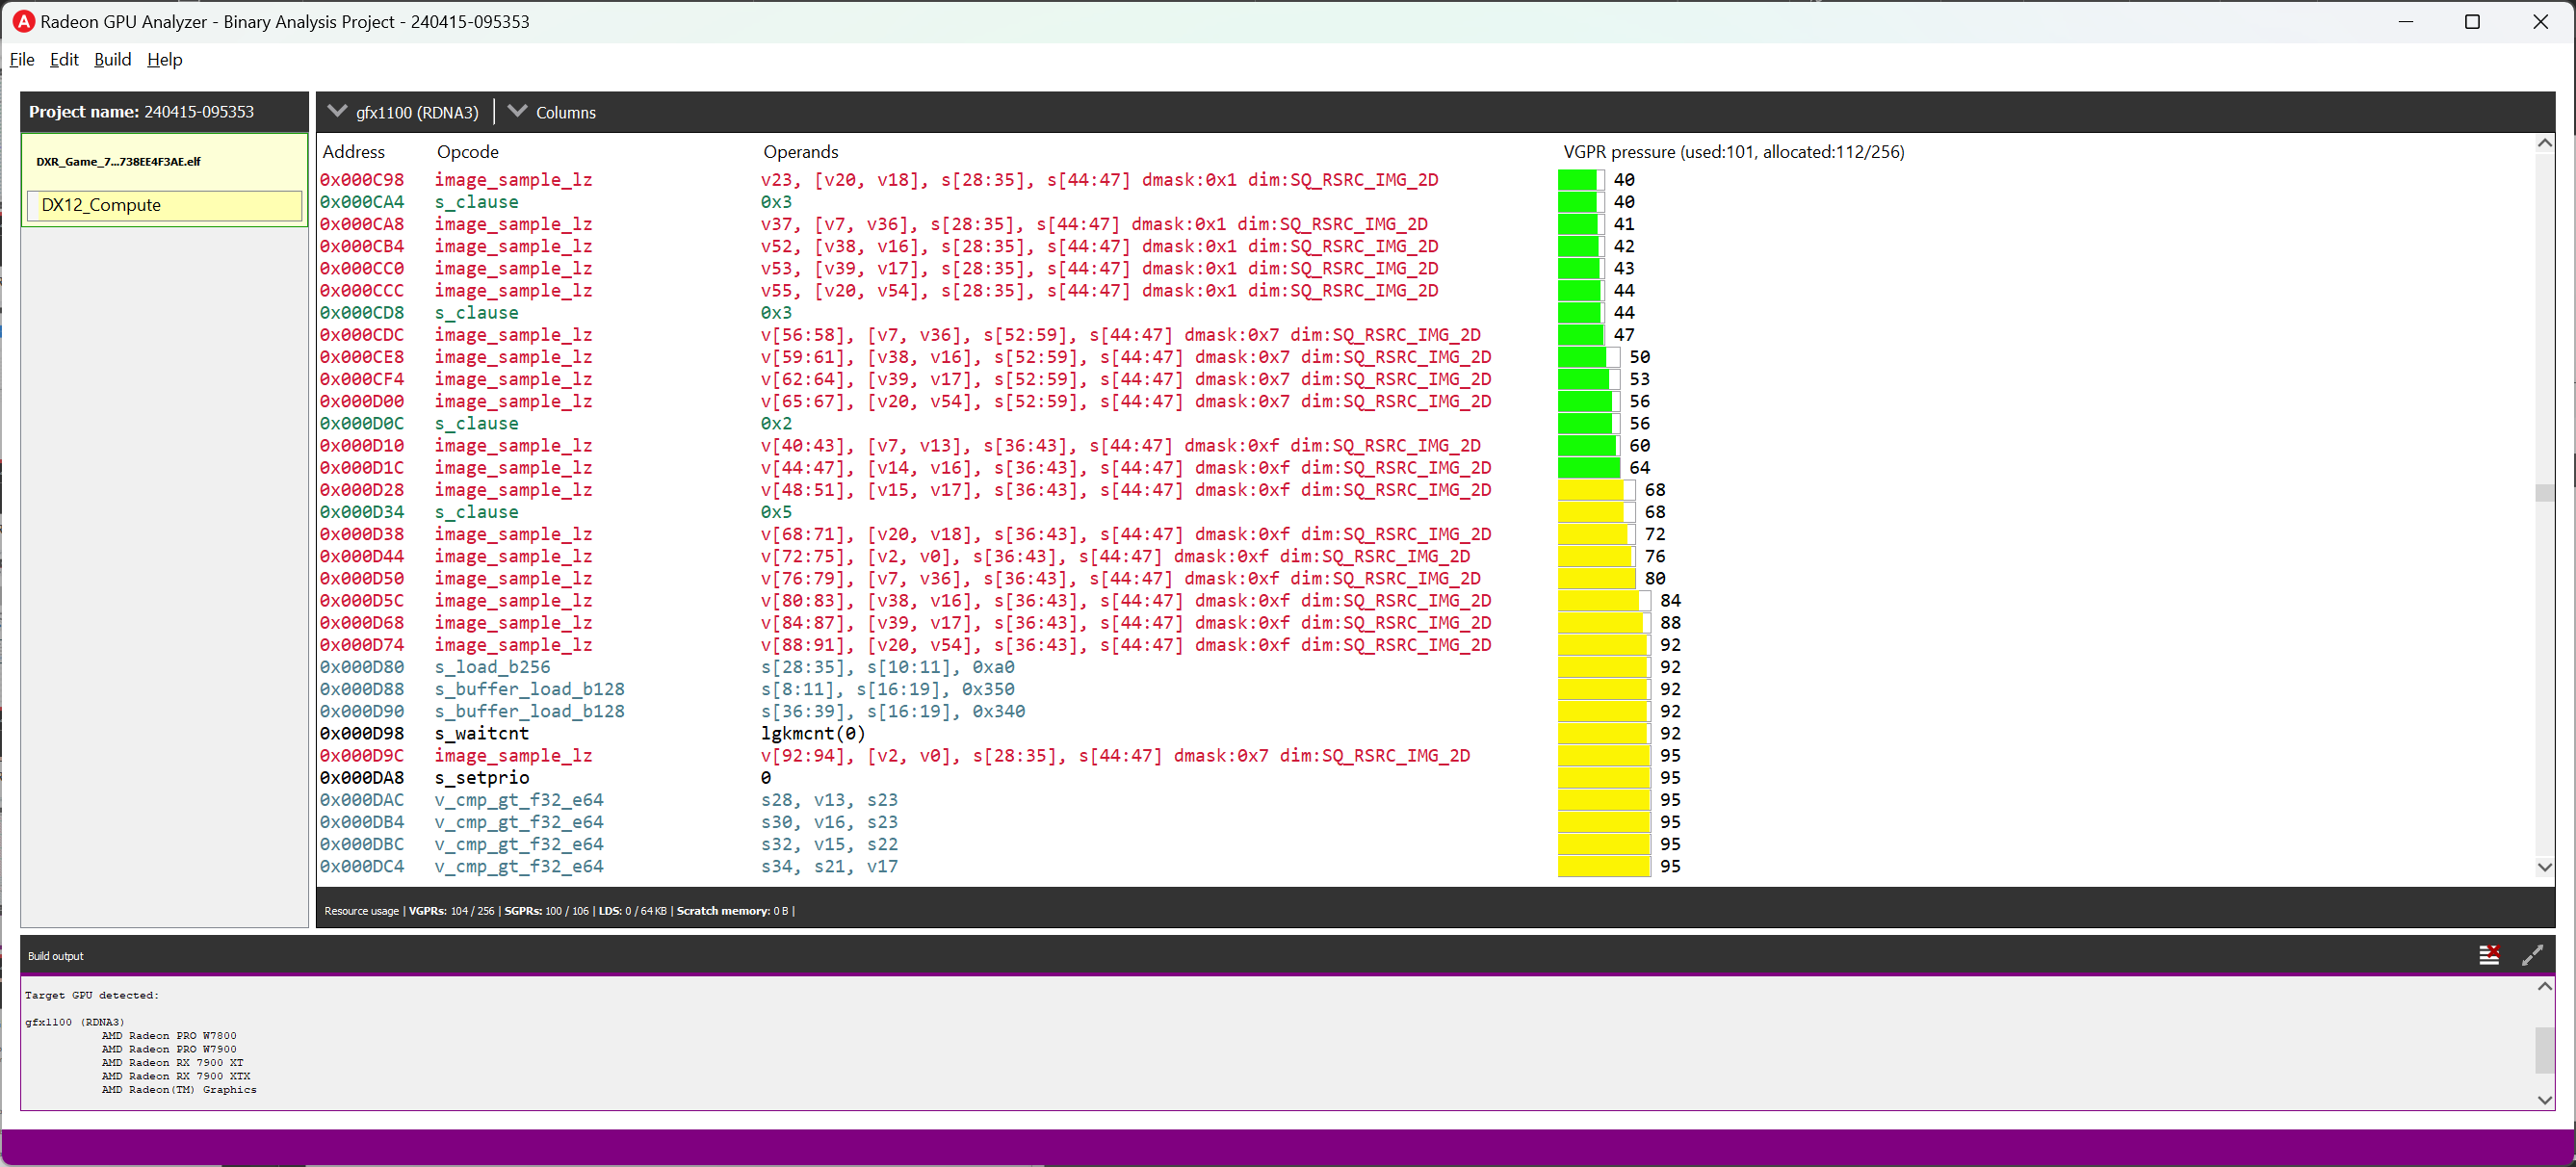
RGP data sets already contain all the necessary code object binaries for all pipelines, shaders or kernels used by the portion of the application that has been profiled. Starting with version 2.1, RGP now supports extracting these code objects from a loaded profile data set and loading them into RGA’s Binary Analysis mode. With this new functionality, RGP users can now take full advantage of some of the advanced analysis features available in RGA, like the VGPR pressure analysis feature.
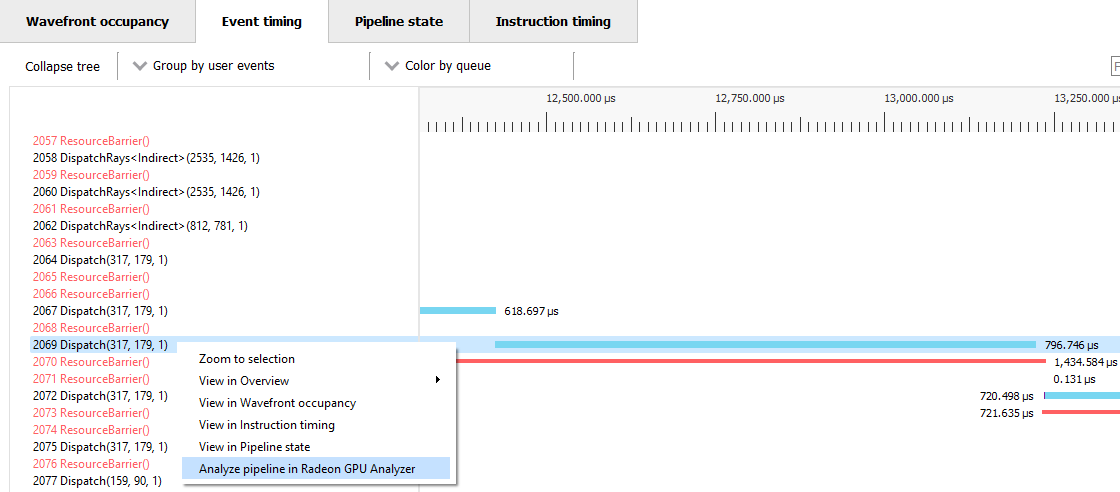
There are multiple ways to take advantage of this new RGP feature. Anywhere in RGP where you can select an event or a pipeline, the context menu shown when you right click that event or pipeline will include a menu item with the caption Analyze pipeline in Radeon GPU Analyzer.
Examples of where you can see this are shown below.
Here we can see it in the tree view that appears on the left side of the Event timing and Pipeline state panes:
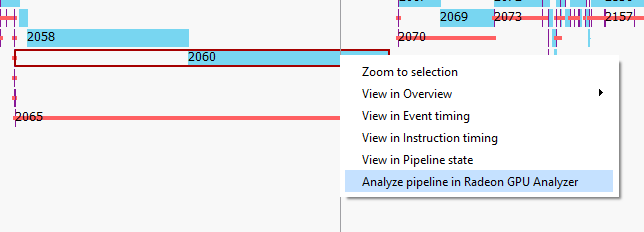
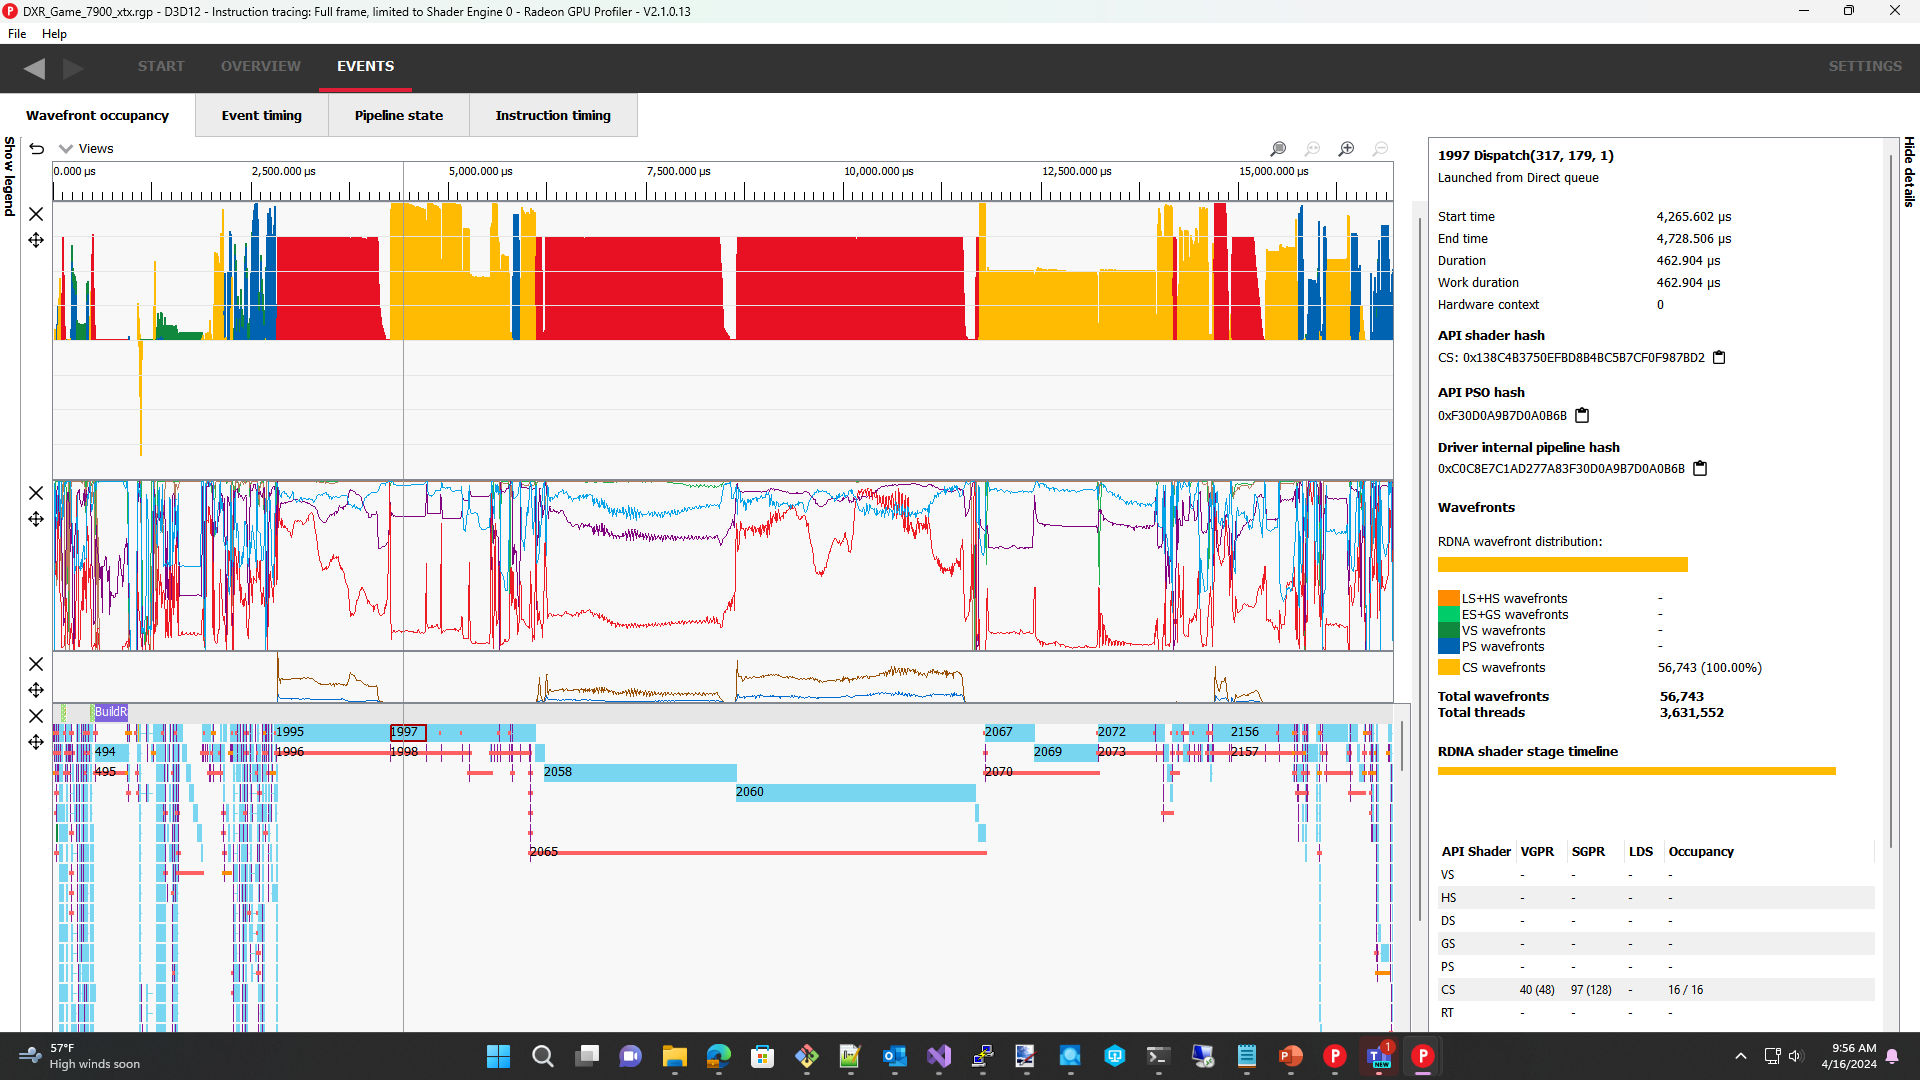
Here it is in the Event timeline row in the Wavefront occupancy pane:
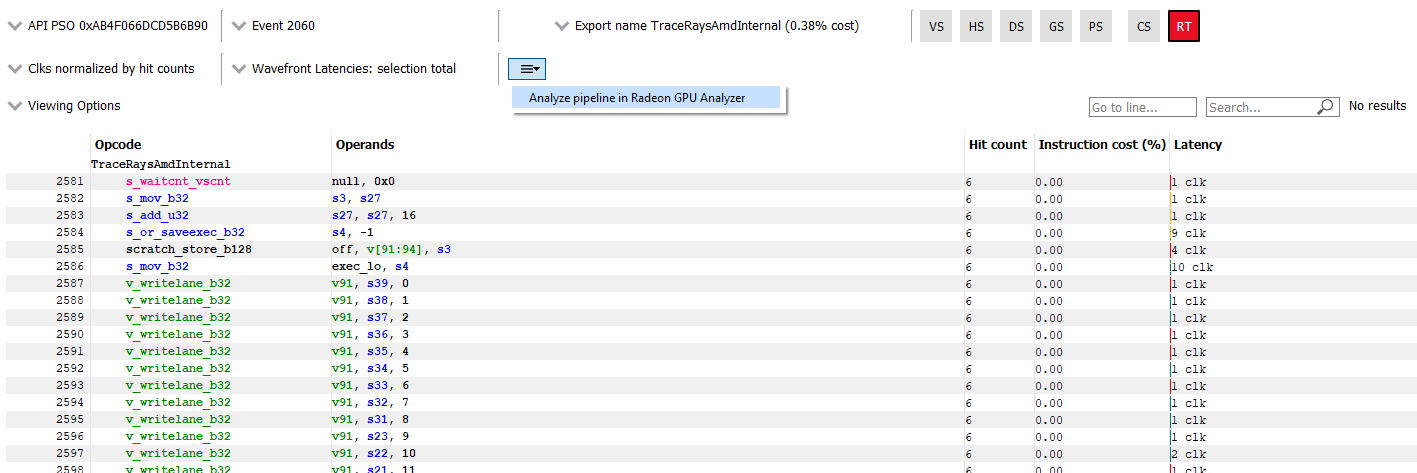
And here it is in the new menu control that appears in the Instruction timing pane:
This menu item is also available in the following places in the Overview section of RGP:
-
In the Events table shown in the Context rolls pane
-
In the Events table shown in the Most expensive events pane
-
Two places in the Pipelines pane
-
In the Pipelines table near the top of the view
-
In the Events table that gets populated when you click on an individual pipeline.
-
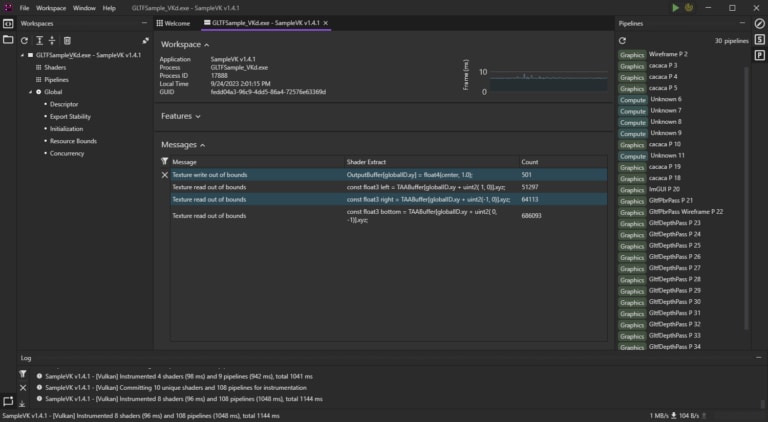
Once you select this menu item, RGP will extract the specified pipeline binary and pass it to a newly launched instance of RGA. RGA will then load, disassemble, and analyze the binary. Here we can see RGA after loading a binary code object extracted from an RGP data set.
If the selected event or pipeline has more than one binary code object associated with it, as can be the case for an indirect ray tracing pipeline, RGP will display a dialog allowing you to choose one or more binaries to analyze in RGA. That dialog is shown here.
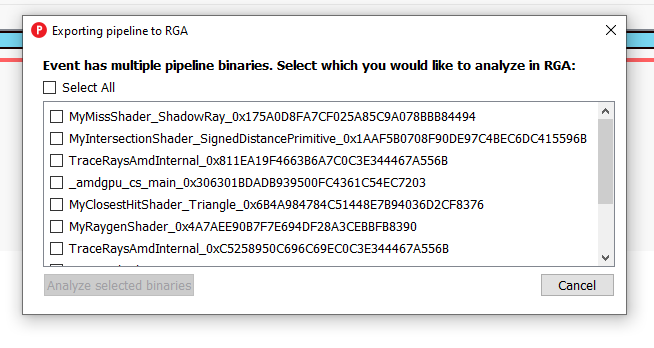
If you select more than one binary from this dialog, a separate instance of RGA will be launched for each binary.
There are some new settings available in RGP to allow the user to configure the behavior of this new interoperability.
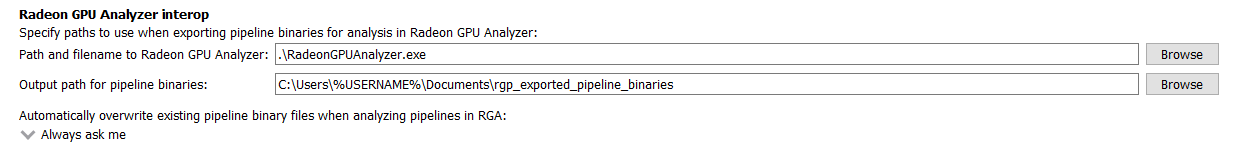
You can tell RGP which instance of RGA should be launched. By default, it will use the version from the same Radeon™ Developer Tool Suite package that RGP is running from. You can also tell it where on disk you want the extracted pipelines to be stored. By default, this is a folder named “rgp_exported_pipeline_binaries” found alongside the “rgp_profiles” folder used by Radeon™ Developer Panel when capturing profiles. You can also configure whether or not RGP should prompt you to overwrite any existing pipeline binaries on disk.
New! Additional “Color by” modes
RGP makes heavy use of color when displaying its information, and it provides many different coloring modes to make the data it presents more understandable. In RGP 2.1, we have added two additional “Color by” modes to make it even easier to understand the profiling data.
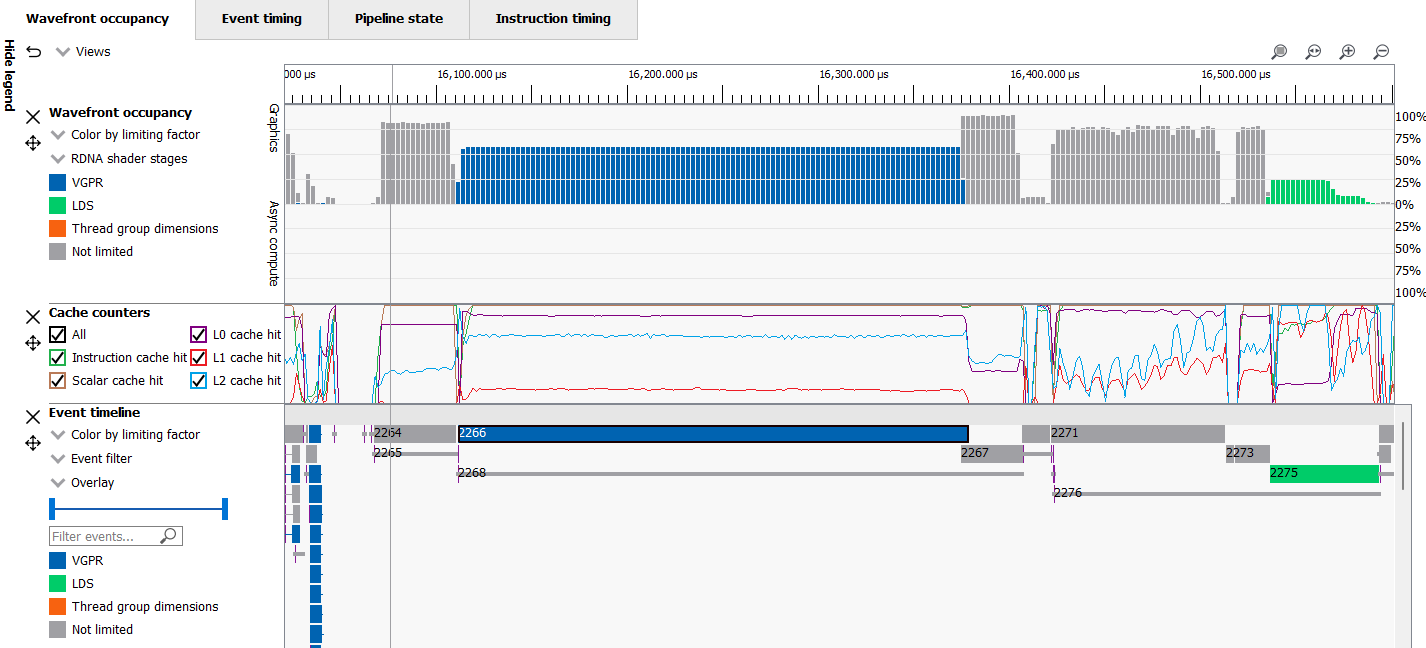
The first of these additional modes is “Color by limiting factor”. When this mode is selected, events and/or wavefronts can be colored to indicate which factor (if any) is limiting occupancy. This new mode will highlight events whose theoretical occupancy is limited by VGPR usage, LDS usage or thread group dimensions. Below is a screenshot where the coloring mode in both the Wavefront timeline and the Event timeline have been set to color by the limiting factor. You can see several events that are limited by VGPR usage (blue), while one event is limited by LDS usage (green).
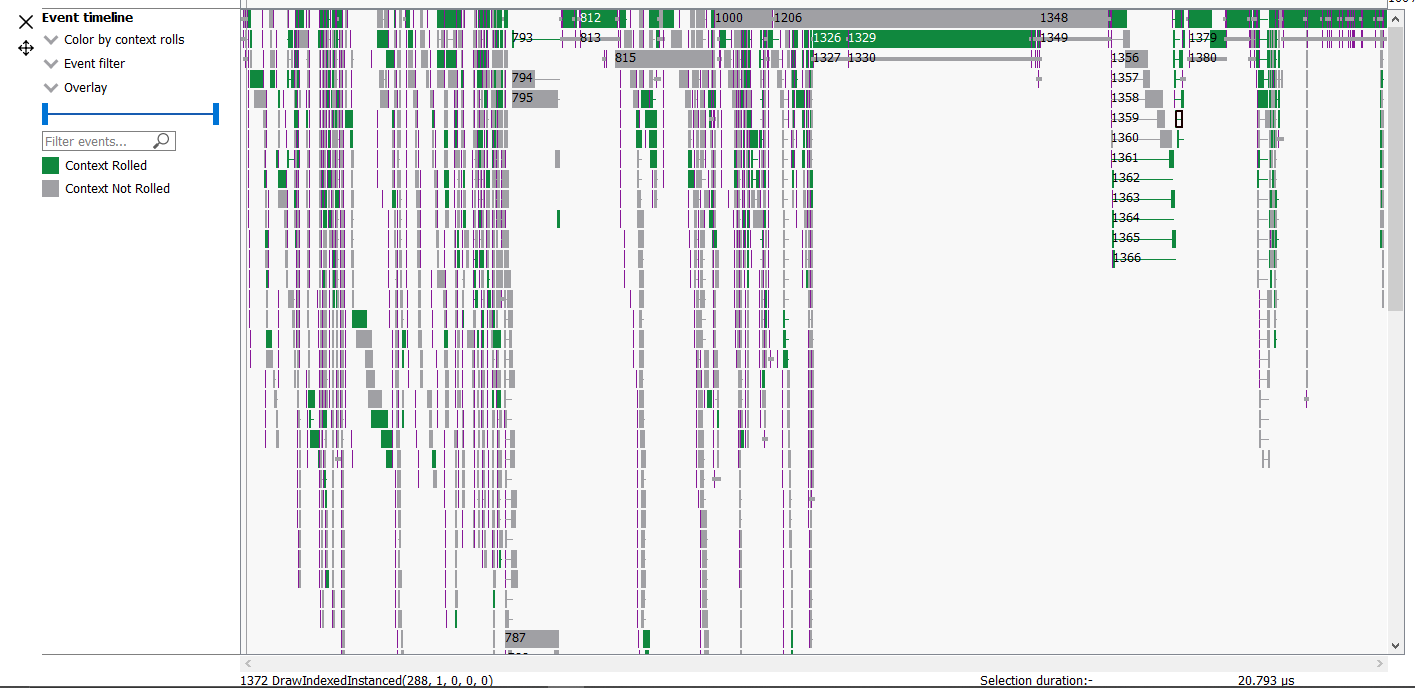
The second additional mode is “Color by context rolls”. When this mode is selected, events that triggered a Context roll will be highlighted, making it even easier to see where a game’s use of graphics state is causing the hardware to use a new set of context registers.
Both new Coloring modes are supported in the Wavefront occupancy and Event timing panes. The colors used for these new modes can also be customized in the Themes and Colors page in the Settings pane.
Enhanced! Pre-issue stall visualization in the Instruction Timing view
Another enhancement in RGP 2.1 is the visualization of what we are calling “Pre-issue stalls” in RGP’s Instruction timing pane. For each instruction shown, the latency value can now be broken down to indicate which part of the total latency occurs before the issuance of the current instruction. This is represented by a hatched pattern in the red part of the latency bar, as seen below.
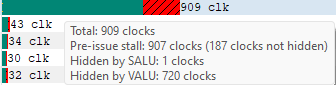
In addition, the tooltip that appears when you hover the mouse cursor over the latency bar will now include an additional line to let you know how much of the total latency has been determined to be a pre-issue stall.
In the tooltip shown in the above screenshot, the instruction that is being displayed has an average latency of 909 clock cycles. 720 of those clock cycles are hidden by VALU work on other wave slots. The pre-issue stall is 907 clock cycles, meaning that 2 clock cycles (909 – 907) are not attributable to the pre-issue stall, and 187 of the 907 total pre-issue stall clock cycles are not hidden by VALU work on other wave slots.
Enhanced! Additional customization in the Wavefront Occupancy view
We have continued to build on the User-customization feature that was added in RGP 2.0. In RGP 2.1, you can now also customize the heights of each row in the Wavefront occupancy pane. Simply move the mouse over one of the splitters that appear between the rows, and you will be able to resize the row above it to make it taller or shorter. This allows you to set up the view and devote adequate screen real estate to each row to fit your needs. Here is a screenshot showing the Wavefront occupancy pane after some of the rows have been resized:
And more!
There have also been plenty of bug fixes and other smaller enhancements in this release. For example, the shader table shown in the right-hand Details panel when an event is selected will now show LDS usage, where applicable, for all shader stages. Previously, LDS usage was only shown for the Compute Shader stage.
Please head over to the product page on gpuopen.com and download the latest version to check it out. Have feedback for us or want to request an enhancement or new feature? You can use the Issues list on GitHub for that.