GPU PerfStudio is no longer supported Try our Radeon™ Developer Tool Suite instead!
GPU PerfStudio now supports DirectX® 12 on Windows 10 PCs. The current tool set for DirectX® 12 differs from the previous generation of graphics API’s and comprises of an API Trace, a new GPU Trace feature, and a new Object Inspector tool.
- API Trace – A multi threaded CPU trace of the DirectX® 12 API usage
- GPU Trace – A new GPU Trace tool for profiling DirectX® 12 CommandLists and analyzing CommandQueue usage
- Linked Trace – The Linked Trace window supports bidirectional linking between the API and GPU trace windows
- Object Inspector – Investigate the properties and usage of object instances created by devices
API Trace Window
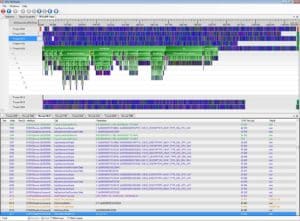
DirectX ® 12 API Trace (click to see larger image)
- Multi-threaded tracing of the DirectX® 12 API with separate timeline branches for each thread.
- Save and Load traces with the new .ATR file format, and Export to .CSV, .TXT, and .XML.
- Displays debugging Perf Markers as nested blocks within traced threads through ID3D12GraphicsCommandList’s BeginEvent and EndEvent APIs.
- Supports bi-directional navigation with GPU Trace while operating in Linked trace mode.
GPU Trace Window

DirectX ® 12 GPU Trace (click to see larger image)
The GPU Trace window presents profiling information for CommandLists executed on the GPU.
- View GPU Time for individual commands executed through calls to ID3D12CommandQueue::ExecuteCommandLists.
- Displays a timeline branch for each CommandQueue used by the connected application.
- Displays GPU commands within a subbranch of the CommandQueue used to execute CommandLists.
- View timing data for Draws, Dispatches, Copies, Executes, Resolves, and Clears.
- Supports bi-directional navigation with API Trace while operating in Linked trace mode.
Linked Trace Window
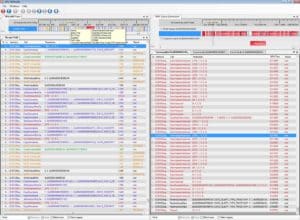
DirectX ® 12 Linked Trace (click to see larger image)
The Linked Trace window supports bidirectional linking between the API and GPU trace windows.
- Populates the API and GPU Traces with data collected from a single frame.
- Find associated execution of APIs between processing units.
- Allows you to find the CPU-side API invocation by double-clicking a GPU Trace timeline item.
- Allows you to find the GPU-side command execution by double-clicking an API Trace timeline item.
Object Inspector
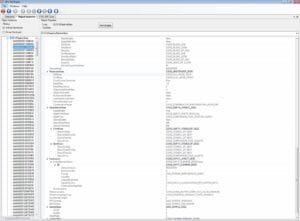
DirectX ® 12 Object inspector (click to see larger image)
The Object Inspector allows the developer to investigate the properties and usage of object instances created by devices.
- Displays a hierarchical tree of DirectX® 12 API objects utilized by a running application.
- View all creation arguments used in creating API objects.
- Find usages of specific API objects within API and GPU Traces.
- Displays active and destroyed object instances.
- Able to export object creation arguments as XML.