The Frame Profiler provides both a simple overview of the current frame profile – along with more in-depth analysis tools. The initial overview allows you to determine if your application is bound by the CPU or GPU. The in-depth analysis provides access to individual counters and allows you to save custom selections for specialized workflow.
Supported Hardware
The current version of the GPU PerfStudio Frame Profiler now only works on HD 7000 (GCN) series and above.
What’s new
- The results window has been reorganized
- Per-draw results table has been combined with state bucket table
- State bucket grouping options have been moved to the Data tab
- Automatic sorting by the first counter
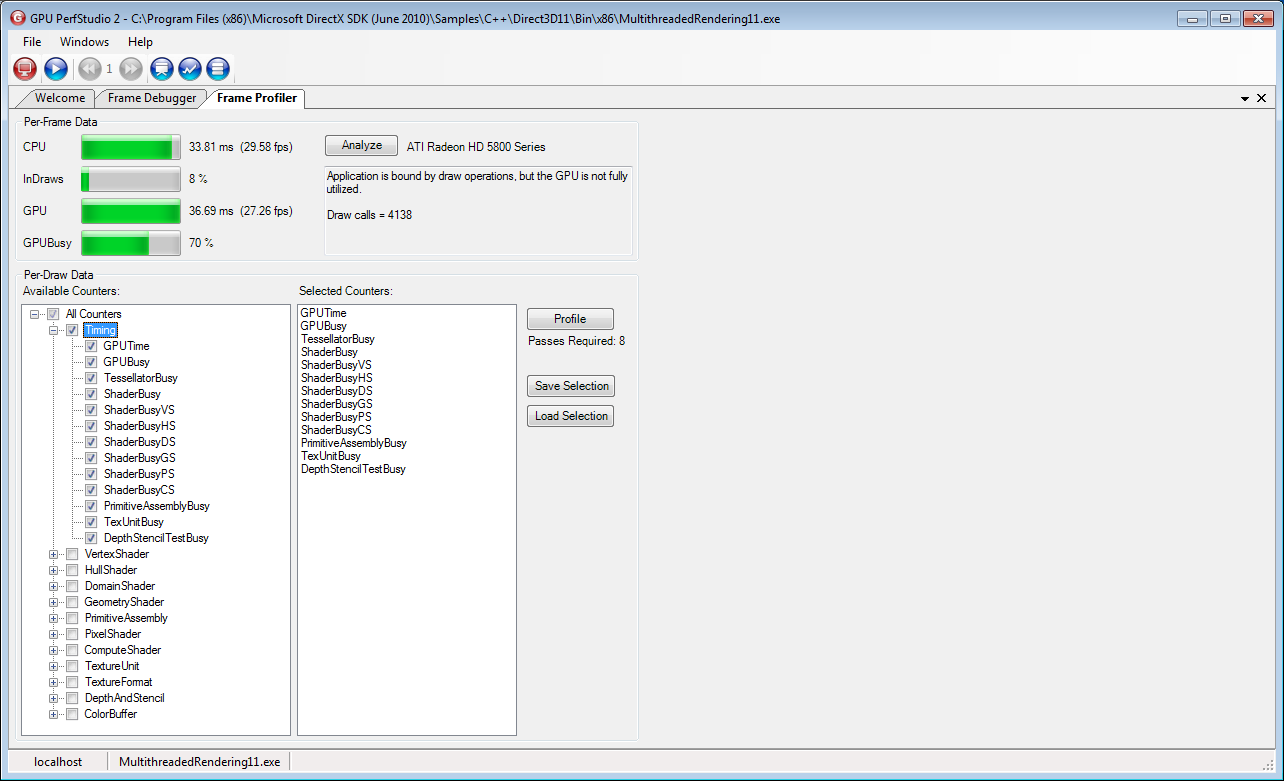
This screen shot shows the simple overview of the frame profile and indicates if your application is CPU or GPU bound. Users select the counters they wish to profile individually or by group.
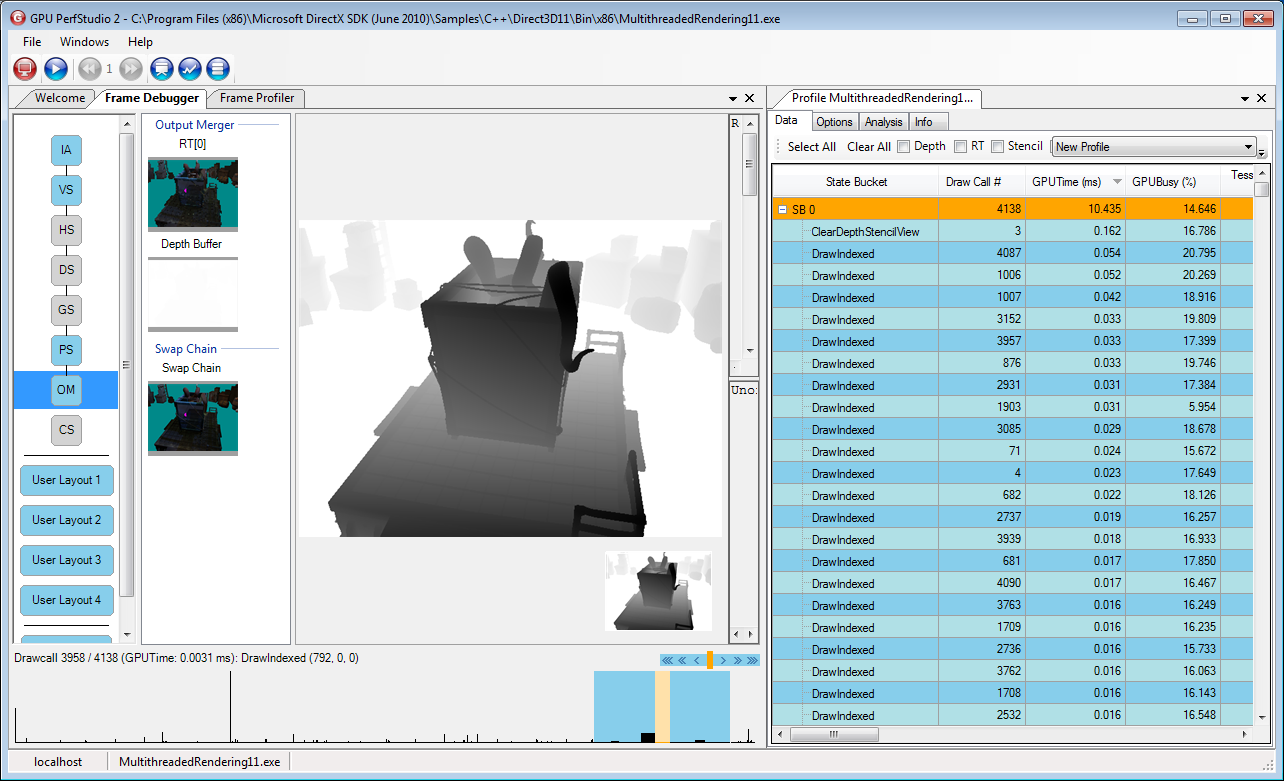
By performing a more detailed profile of your application using the full counter set or a custom set, you can identify which draw calls are the most expensive and what may be causing the bottleneck. With the integration of the Frame Debugger and API Trace, it is also possible to investigate which aspects of the frame which may be causing bottlenecks.
The profiler results window links directly to the drawcalls in the other windows allowing you to select a draw call from the Frame Profiler and jump to that draw call in the Frame Debugger or API Trace. Likewise, using the slider to selected a draw call in the Frame Debugger will highlight the draw call in the Frame Profiler results.
Frame Profiler features:
Automatic sorting by the first profiled counter allows for immediate identification of the most expensive draw call when the GPUTime counter is used.
Hierarchical sorting of state buckets and draw calls makes it easy to identify entire state buckets whose improvement will yield performance gains in your application.
Users can make custom counters selections to get in-depth counter information for each draw call.
Custom counter selections can be saved to disk.
The Profiler results can be saved to disk and re-loaded allowing offline analysis.
The Profiler is integrated with the Frame Debugger allowing you to quickly identify performance issues with specific draw calls.
The Profiler is integrated with the API Trace, allowing you to easily see what API calls may have caused state changes and performance differences between two draw calls.