The Shader Debugger allows you to debug HLSL and ASM Pixel, Compute, and Vertex Shaders inside your application. It allows you to step through your shaders one line at a time and view the registers, variables, and constant values at each pixel. It is even possible to insert breakpoints in the code so that you can quickly jump to a particular line and start debugging. To aid in understanding the flow control of your shader, a Draw Mask image visualizes which pixels were written by the previous instruction.
Shader Debugger Features
- Step through HLSL or ASM code line by line
- View registers, constants, and variable values at each pixel
- Insert and run to breakpoints
- Step forwards or backwards
- View the draw mask for each instruction
What’s new
- DX11 Vertex Shader debugging is now supported.
- The Shader Debugger is now a modal window that expands to fill 90% of the client window when debugging is started.
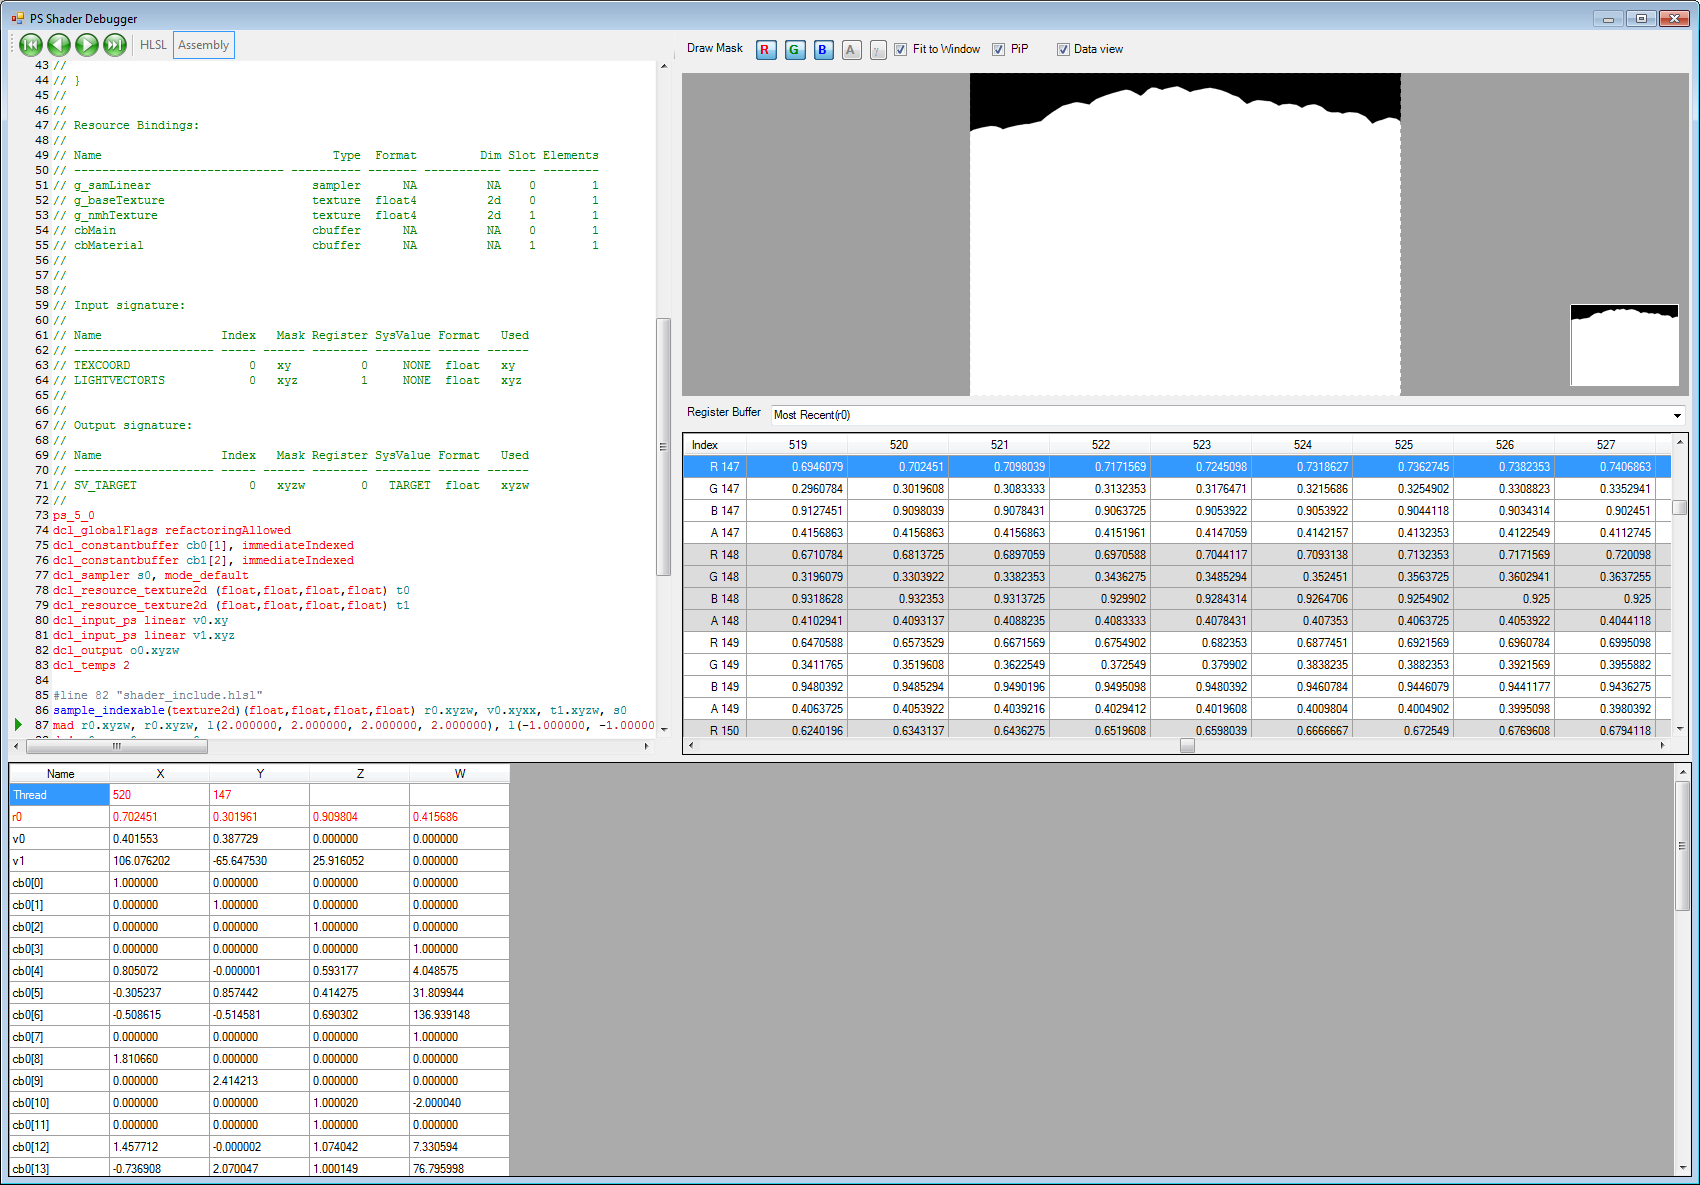
- The register buffer can now be viewed in data grid mode allowing the user to see many register values at once.

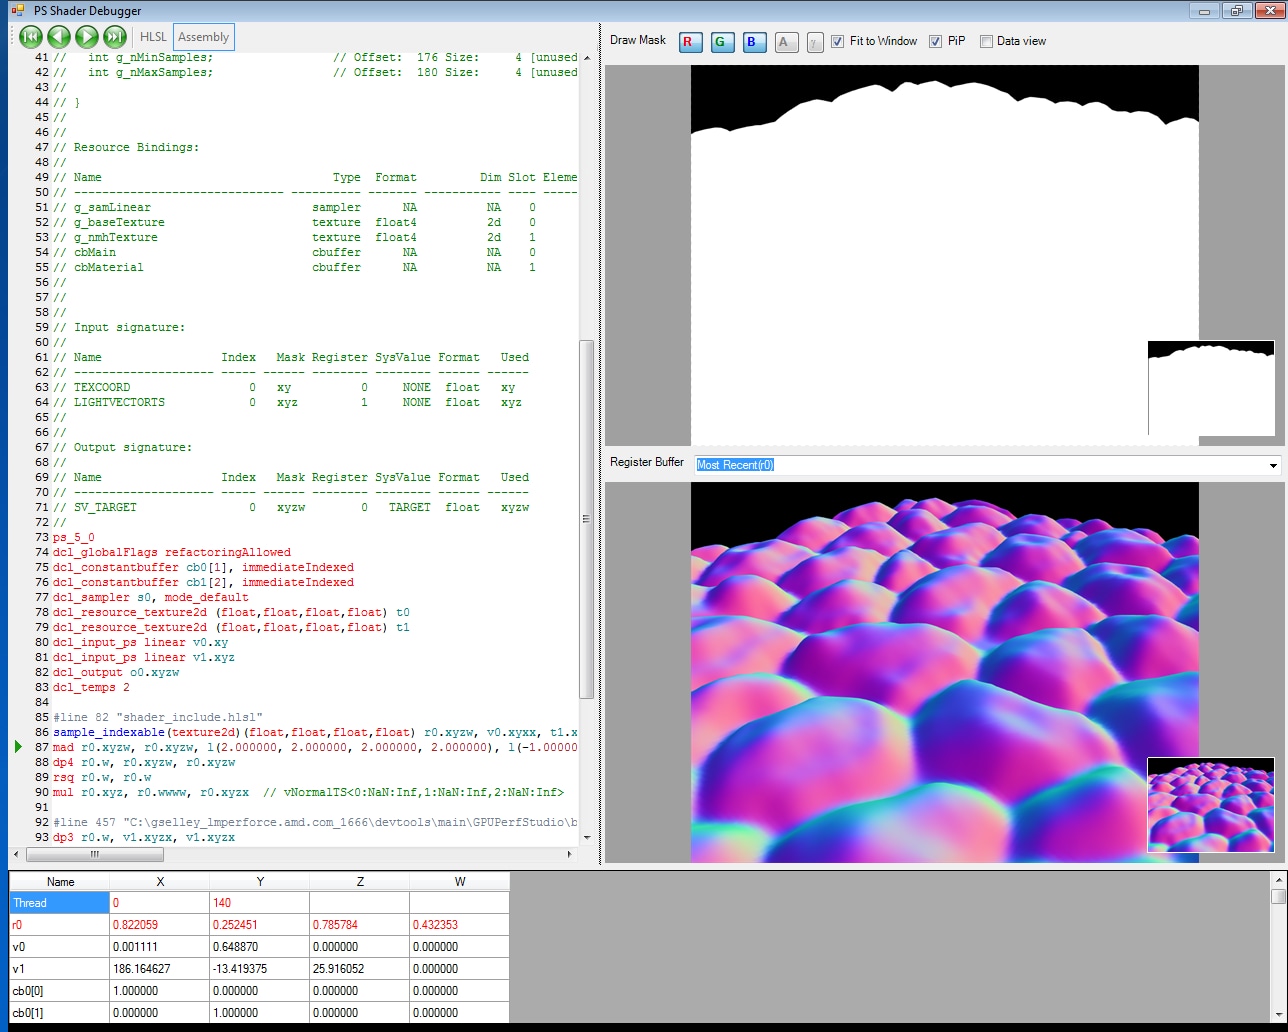
This screen shot shows a typical shader debug session. Stepping through the HLSL or Assembly code updates the draw masks on the right hand side, and updates the variables table at the bottom.
The Shader Debugger features a code window that offers the conventional debug features, including user break points, run to, run back, step forward, and step back. Two images provide access to the pixel values currently output by the shader. One image shows the draw mask indicating the pixels that have been rendered, and the second image shows the current register values of the pixels. In addition, a table of the current constants and variable buffer values is displayed. The user can click in the either of the images to select the pixel being debugged.

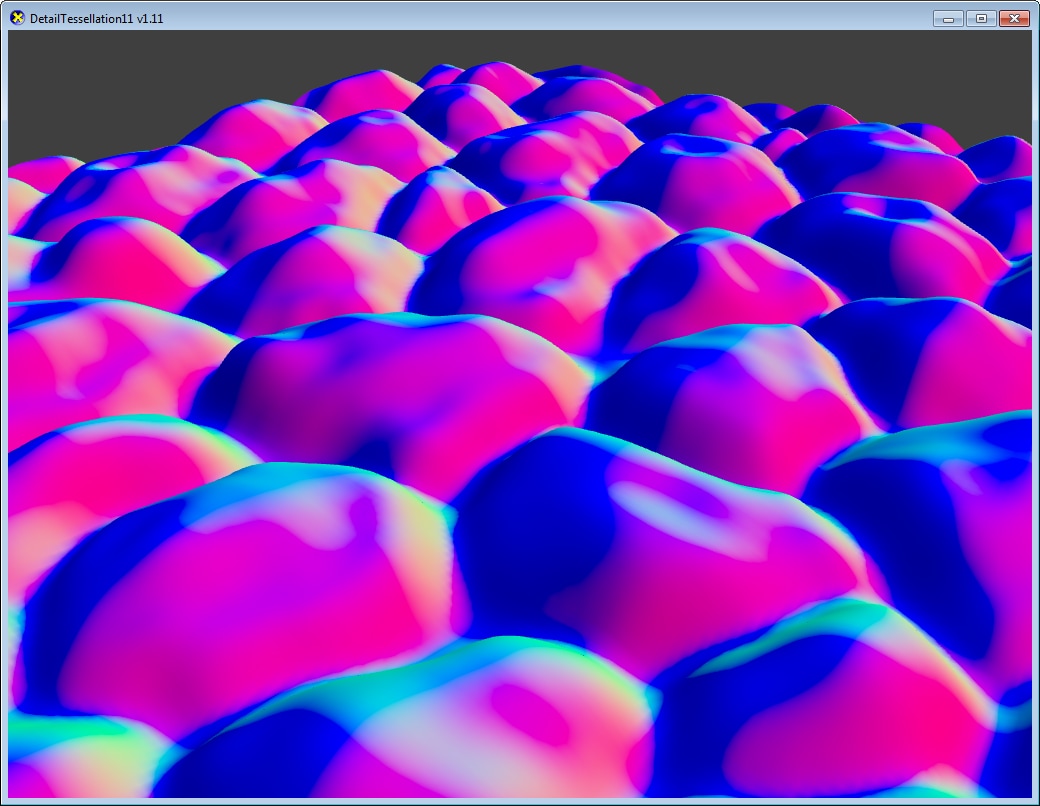
The Shader Debugger renders the shader output at the breakpoint to the swapchain. This allows you to see where your shader is rendering on your application screen as well as in the Draw Mask.

This image shows the register mask displayed as a data grid allowing you to see many values at one glance. Clicking on a pixel in the draw mask will position the corresponding cell in the data grid in the middle of the register window.Vertex Shader debugging output is displayed in data grid mode.