AMD Radeon™ GPU Profiler
AMD RGP gives you unprecedented, in-depth access to a GPU. Easily analyze graphics, async compute usage, event timing, pipeline stalls, barriers, bottlenecks, and other performance inefficiencies.
We are excited to announce the release of the AMD Radeon™ GPU Profiler (RGP) v2.4 and present some of the new things you can find in this release.
AMD recently released the AMD Radeon™ RX 9000 Series GPUs, based on AMD RDNA™ 4 Architecture. A large effort on the tools team over the past year has involved adding support for these latest GPUs. All of the RGP features are now available to help you optimize your GPU applications for this new architecture.
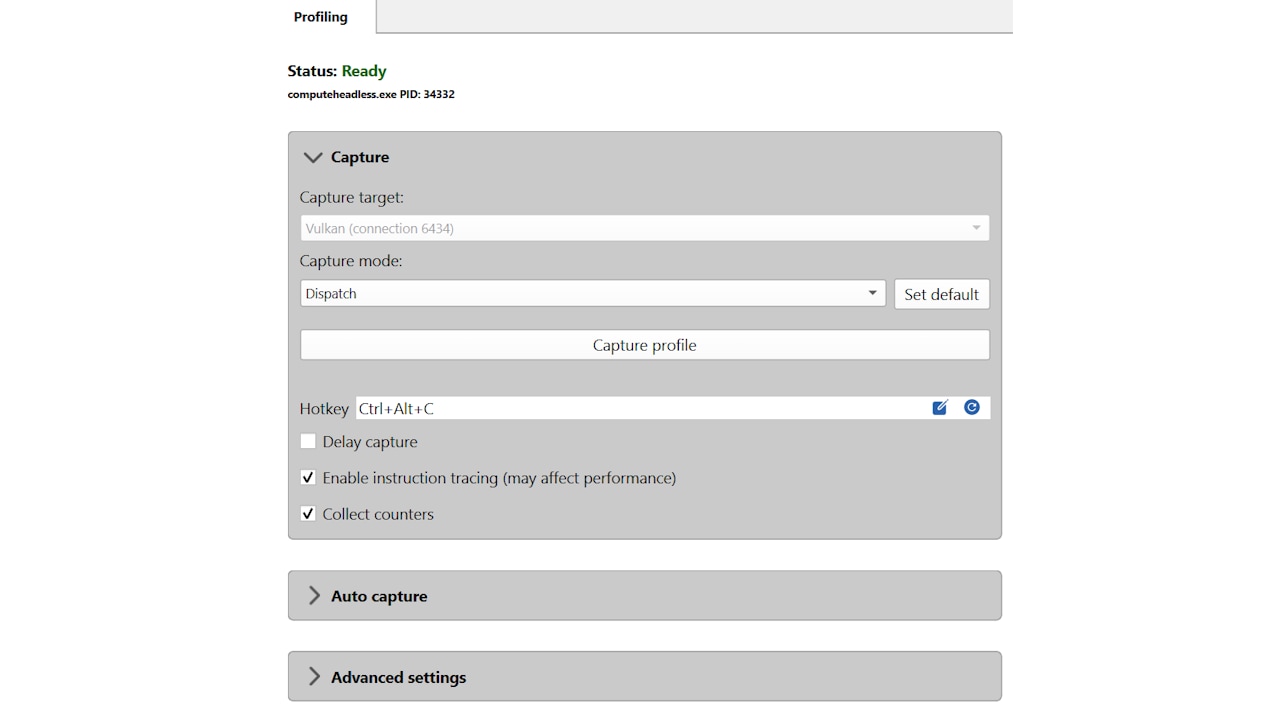
The latest version of the AMD Software: Adrenalin Edition™ driver coupled with the latest version of the AMD Radeon™ Developer Panel (RDP) now supports a new profile capture mechanism. This should be mostly transparent to developers; however, one of the benefits of this new capture mechanism is that it enables support for profiling new types of applications using RDP and RGP. In previous releases, for DirectX® 12 and Vulkan®, only frame-based applications (those that called Present) were supported. With this new release, RDP and the driver can now capture profiles from pure compute, console-based applications. So, if you have an application that uses DirectX® 12 and Vulkan® to only dispatch compute shaders, and the application does not present to the screen, you can now enjoy the benefits of RGP. The capture mechanism is similar to what is supported for HIP and OpenCL™. You can configure RDP to capture Dispatches within the Profiling UI. Simply set the Capture mode setting to Dispatch. Then, when you click the Capture Profile button, RDP and the driver will capture the compute dispatches from the pure compute application.
You can also configure RDP to automatically capture a range of dispatches. To do this, change the Auto capture mode setting to Dispatch range and provide a Dispatch start index and a Dispatch count. Then when the pure compute application is run, the specified range of dispatches will be automatically captured without any additional user interaction.
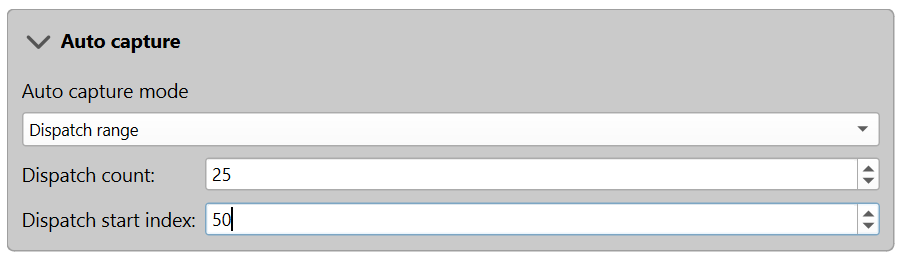
It is worth noting here that the Dispatch count setting is also used for pure compute applications when Auto capture is not enabled. In this case, when you click the Capture profile button, the number of dispatches specified will be captured.
For more details on the RDP configuration options, please view the Radeon™ Developer Panel User Manual on gpuopen.com
When you then launch RGP to visualize the profiling data captured from a pure compute application, you may notice a few differences in the user interface. Some UI elements that are only meaningful for graphics applications are hidden when viewing data from a pure compute application. Some of the Overview panes (like the Context rolls and the Render/depth targets panes) are hidden in this case. The Frame summary pane will be replaced by the Profile summary pane. There will also be a few minor differences in some of the other panes.
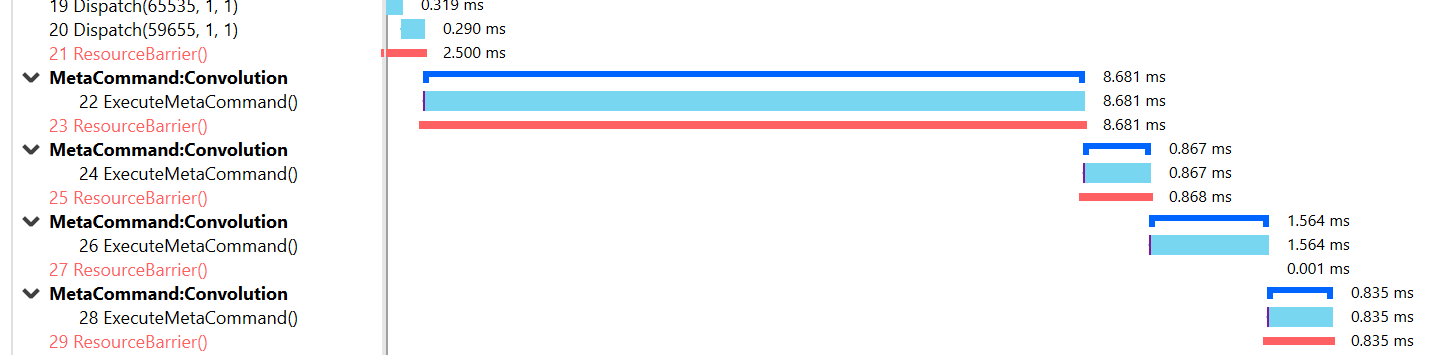
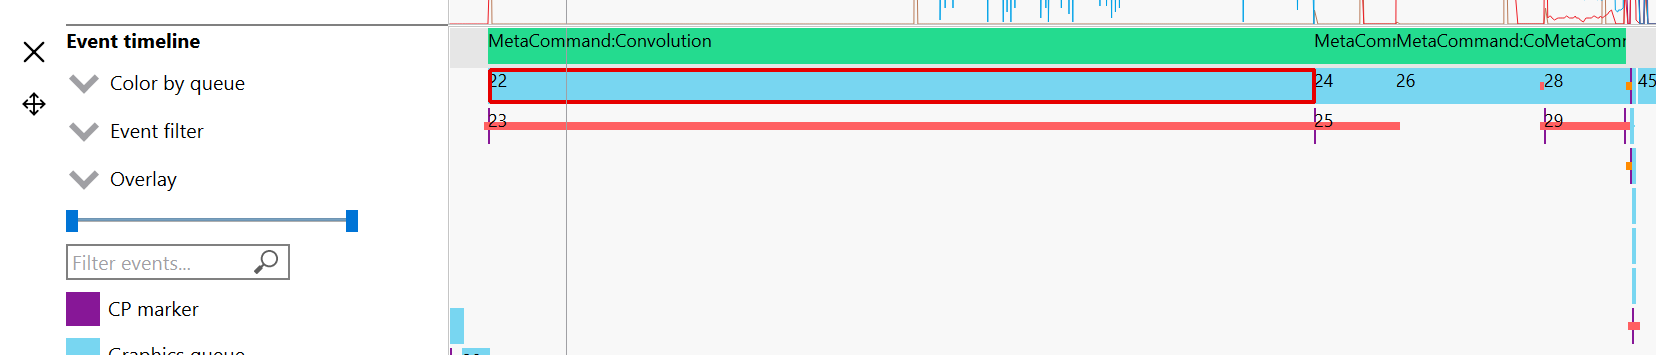
In addition to providing support for profiling pure compute applications, this version of RGP also has some enhancements related to profiling Direct Machine Learning (DirectML) applications. An introduction to DirectML can be found here. RGP can be used to analyze the performance of a DirectML application, similar to any other DirectX® 12 application. This includes the support mentioned earlier for DirectML applications that are pure compute (non-graphics) applications. There is one additional feature in RGP that provides additional insight for DirectML applications. Under the hood, DirectML makes use of DirectX® 12 meta commands. When you profile a DirectML application, RGP will give you additional information about the meta commands used under the hood. These are presented in both the Event timing pane and in the Event timeline row of the Wavefront occupancy pane as additional user markers, which tell you the category of each meta command. Here are two screenshots of these additional user markers, showing a case where the meta commands are executing a Convolution.
Here is what this looks like in the Event timing pane:
And here is the same information displayed in the Event timeline row of the Wavefront occupancy pane:
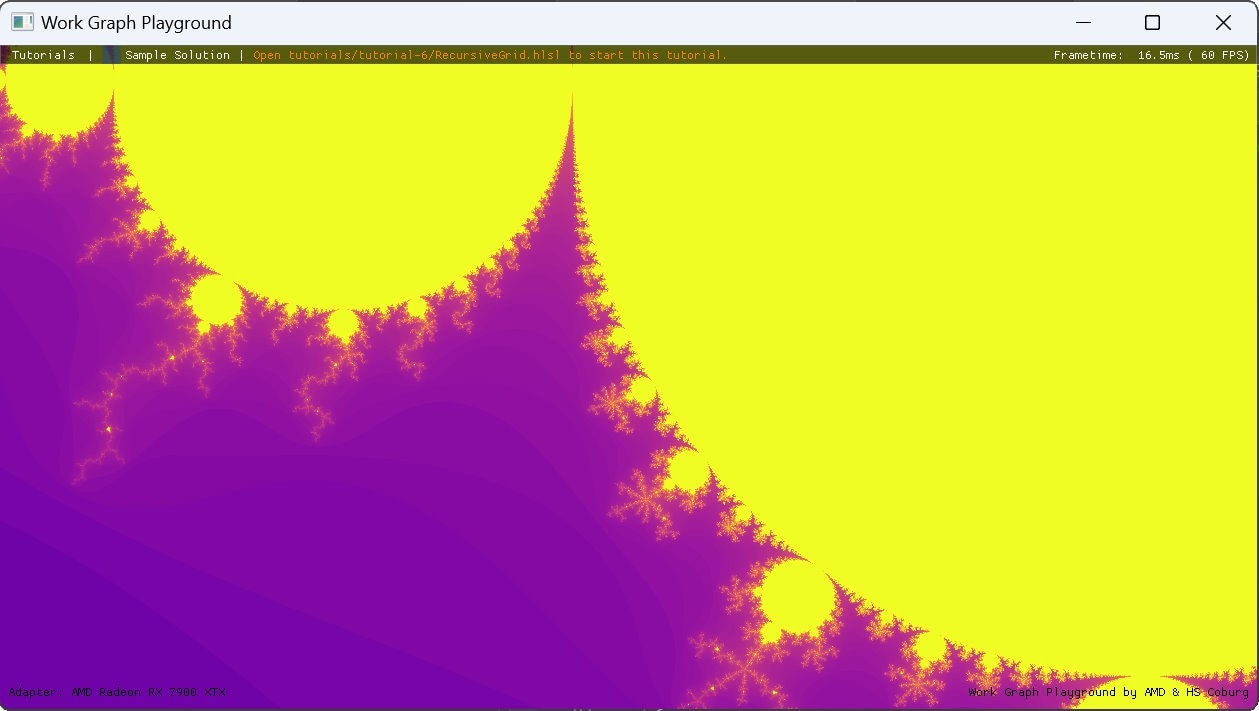
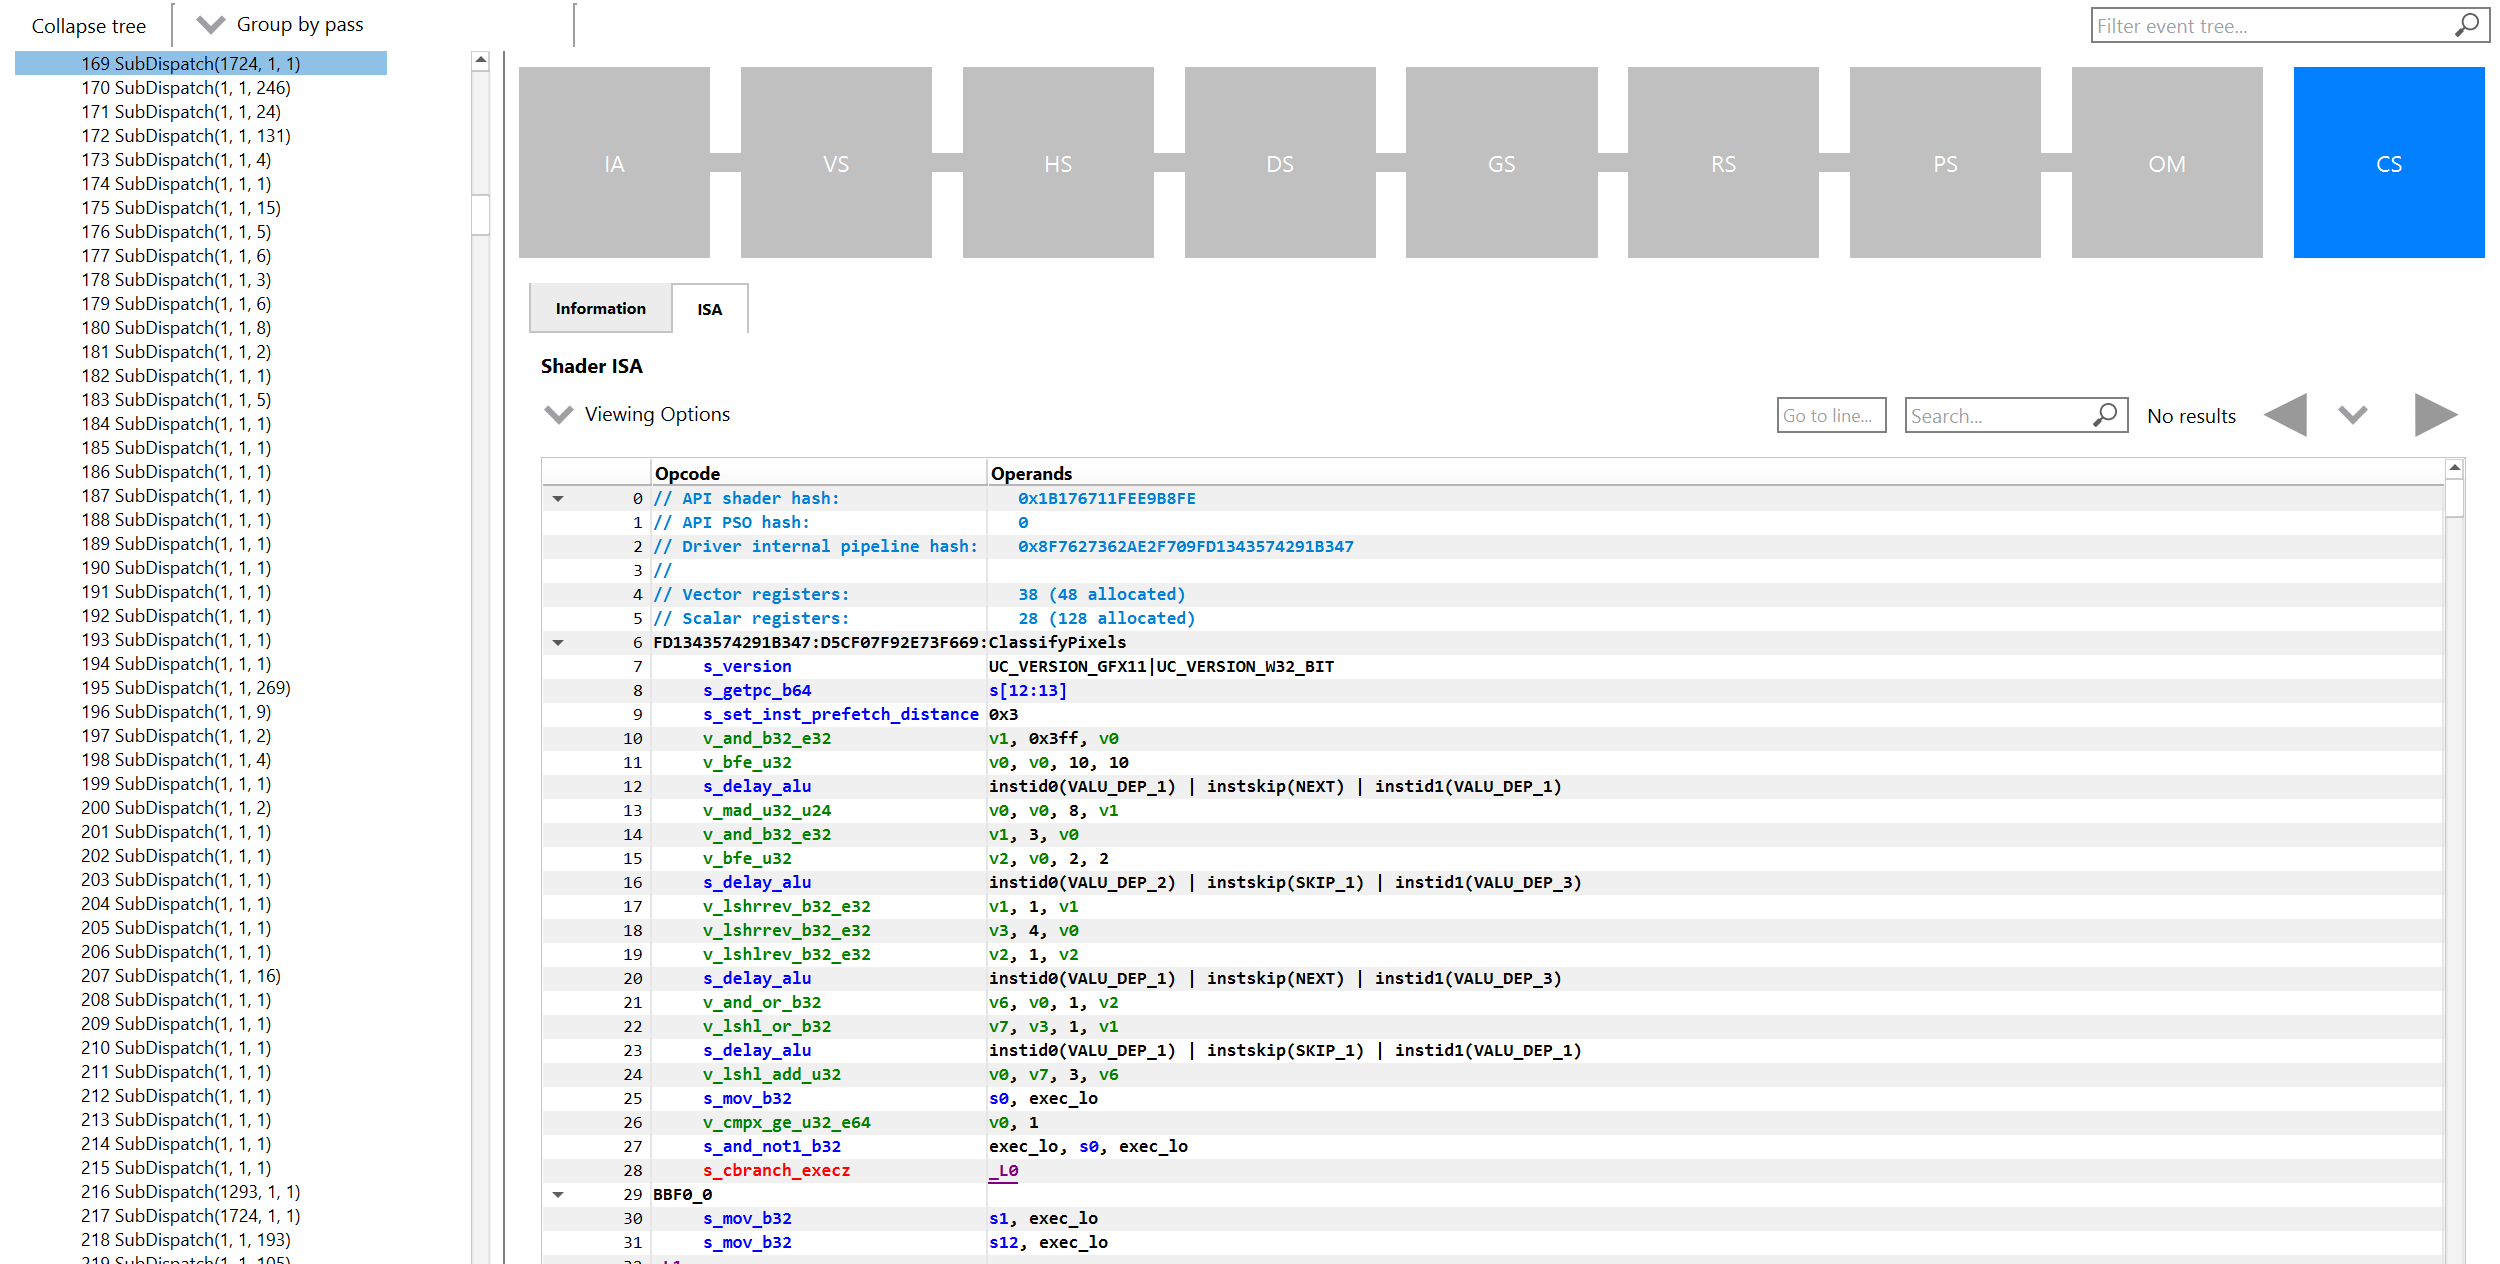
RGP 2.4 also enhances the experience for developers working with Work Graphs. In addition to the features mentioned in this blog post, RGP now supports viewing both shader ISA and Instruction timing data for Work Graph sub-dispatches. Shader ISA for sub-dispatches will be displayed in the usual place: in the ISA tab of the Pipeline state pane.
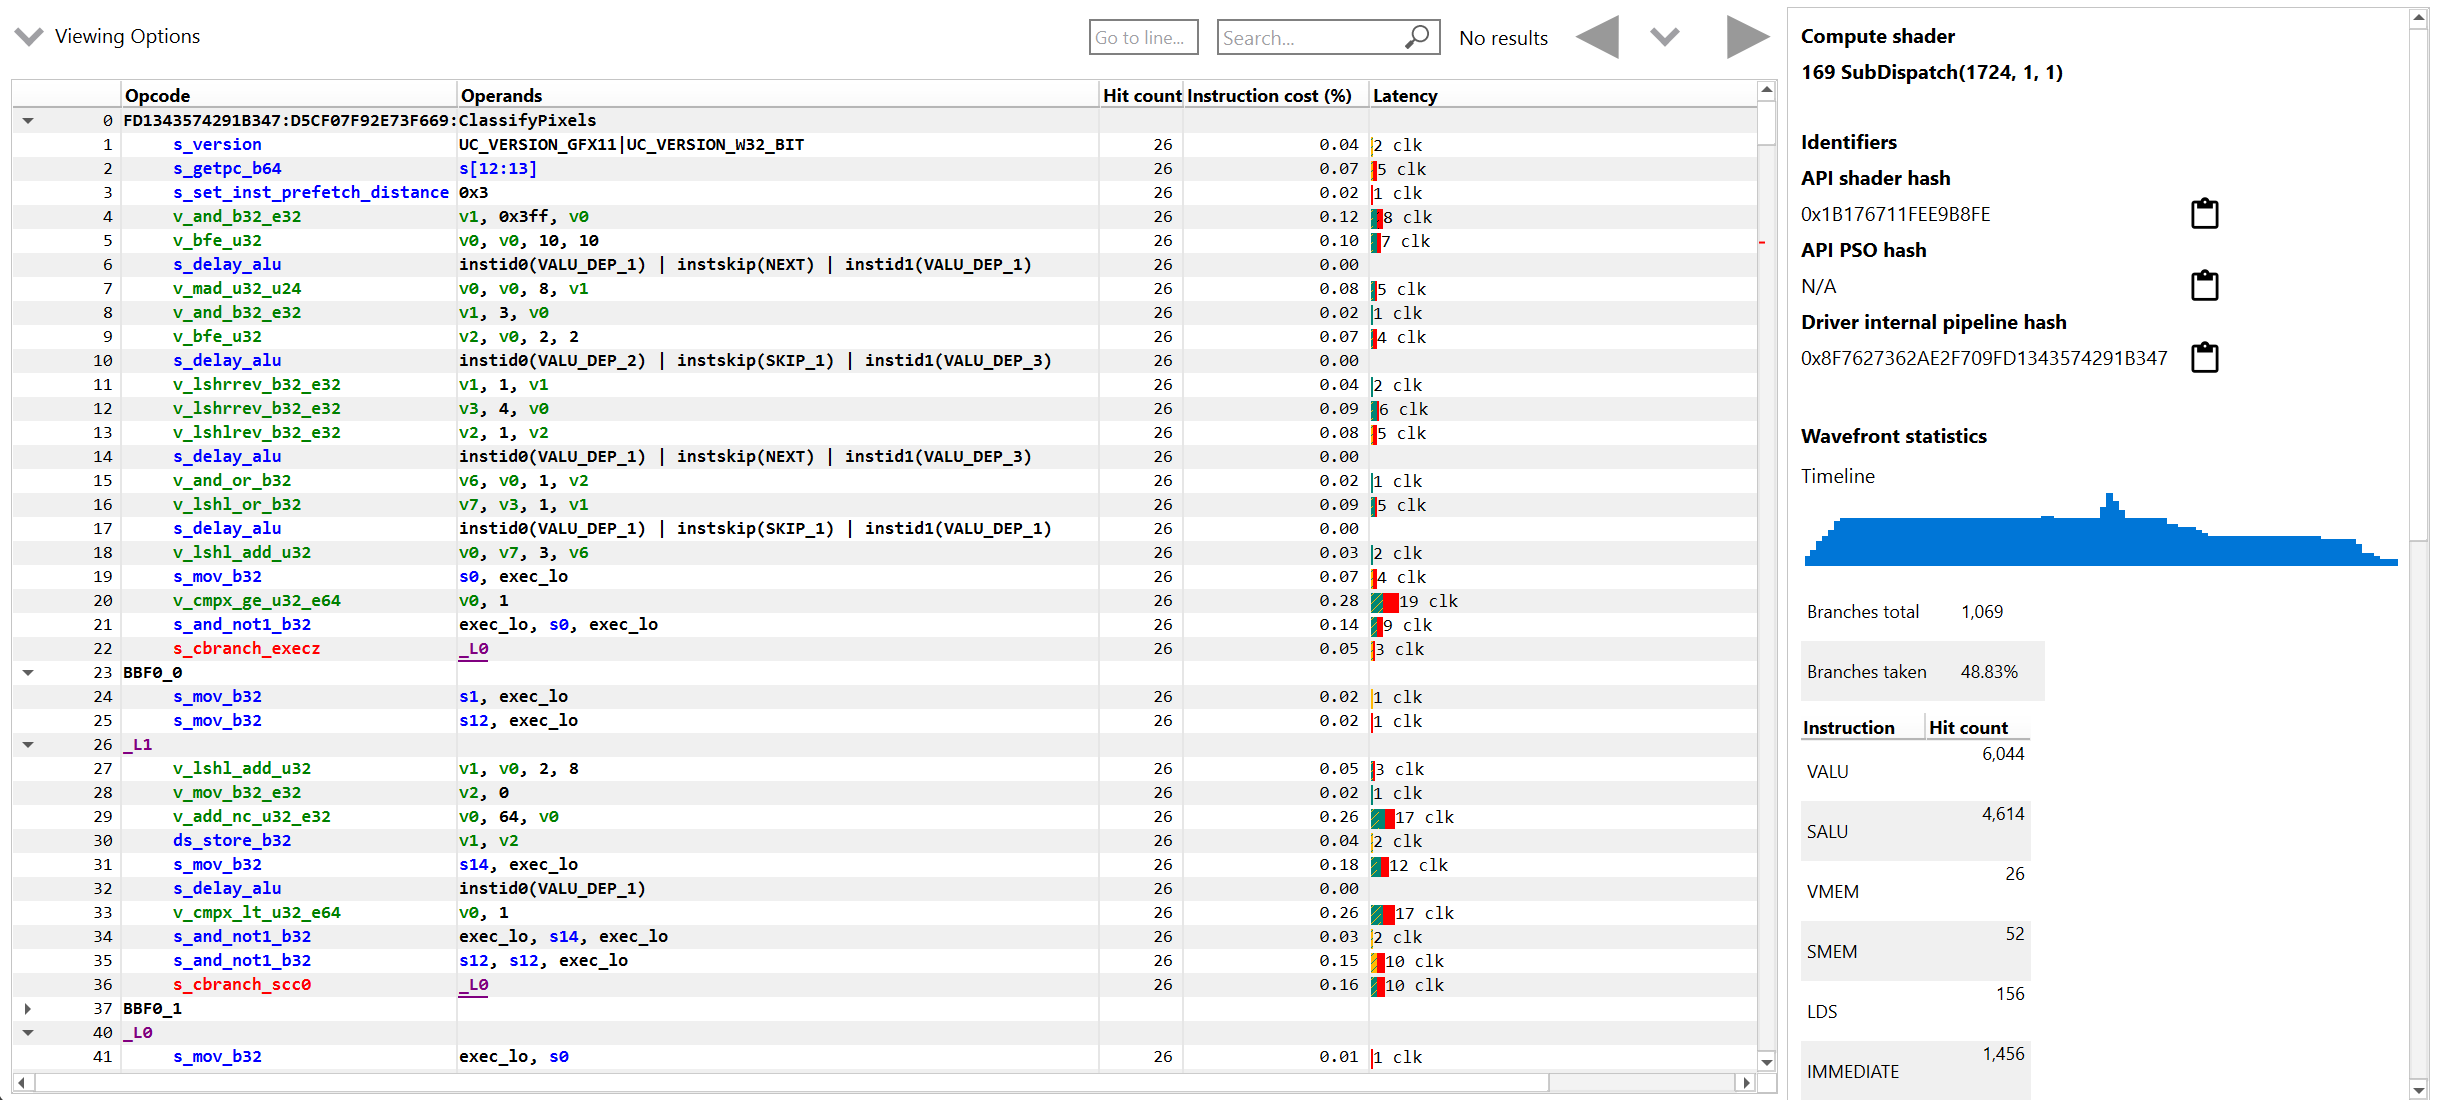
Similarly, after selecting a sub-dispatch event, you can navigate to the Instruction timing pane to view the low lever instruction timing data for the selected event.
There have also been some additional UI enhancements to the ISA views in RGP. As you may be aware, in RGP 1.15, we provided a new ISA view experience in RGP. In RGP 2.4, we made a few improvments. Now, when you hover the mouse over an instruction in the Opcode column, a tooltip will appear to show some additional details about that instruction. This tooltip will show the Instruction, a Description and the Encoding used. See an example below.
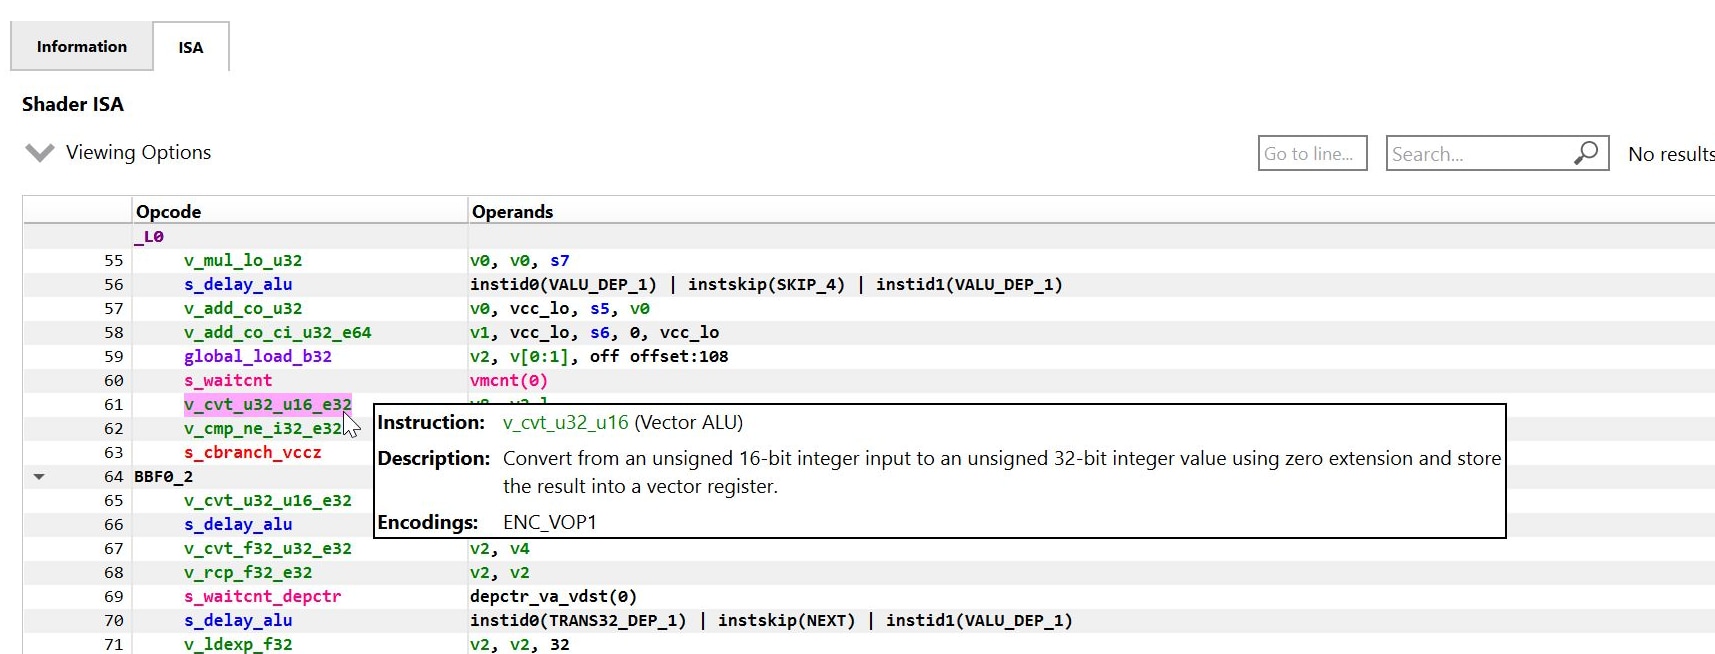
The information displayed in the tooltip comes directly from the AMD machine-readable GPU ISA specifications. To achieve this, the ISADecoder API has been integrated into RGP’s ISA views. By having this information at your fingertips within RGP, you will no longer need to break your optimization flow by having to reach for an external ISA specification document.
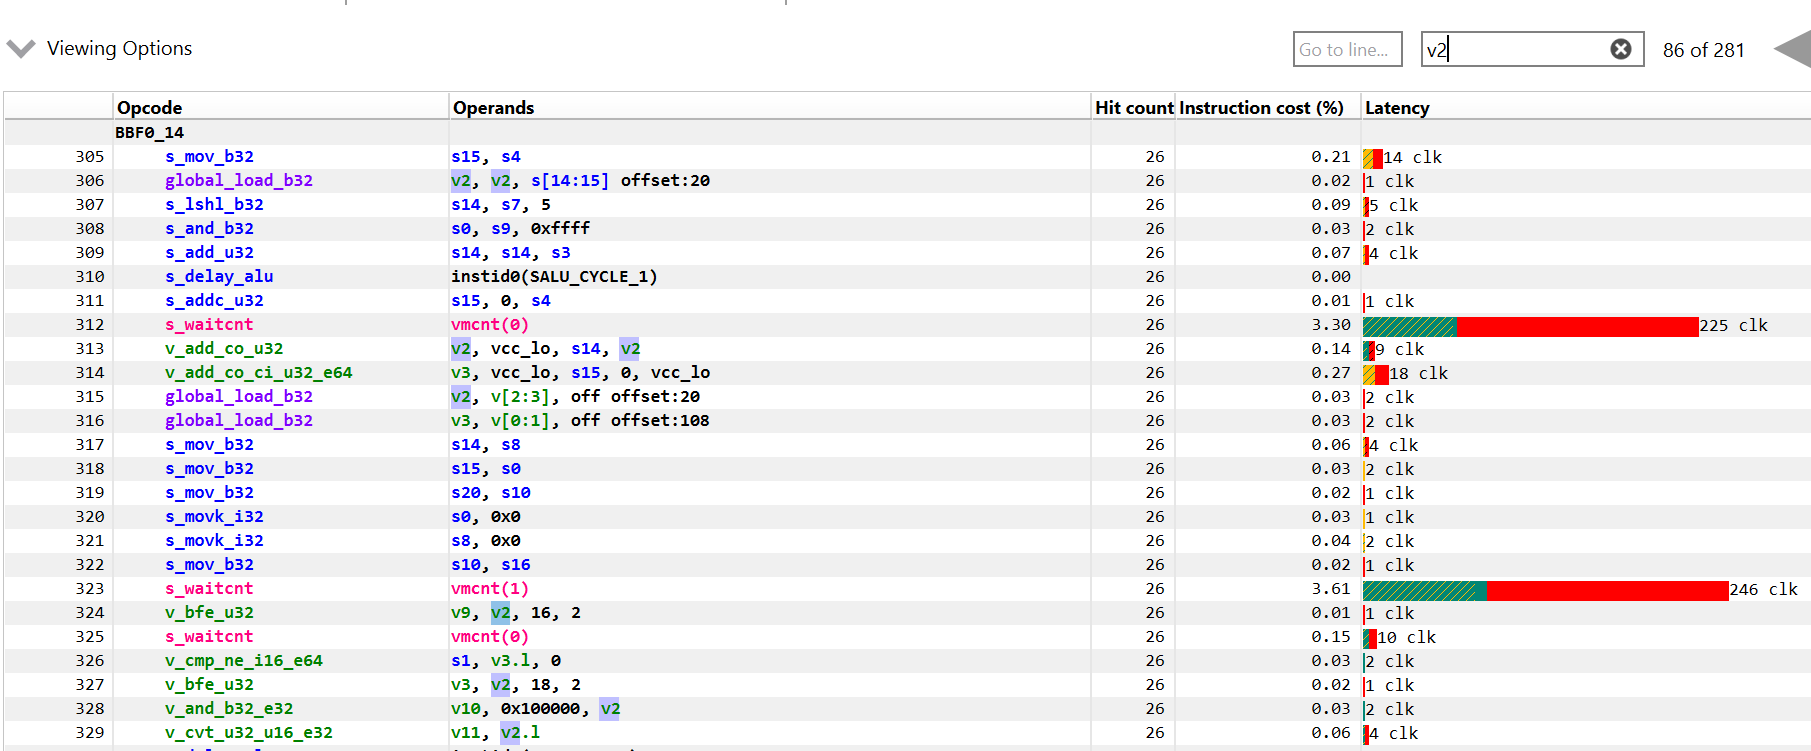
When searching for text in shader ISA, previous versions of RGP would highlight an entire line where a search match was found. Starting with RGP 2.4, individual search matches within a line are highlighted. In the below screenshot, we have searched for the vector register v2. As you can see, each individual instance of v2 is highlighted, including each separate instance on lines 306 and 313.
In addition to the above features, there are a few other changes worth mentioning.
Please check out the RGP product page on gpuopen.com to learn more about RGP and to download the latest version.