Help Manual
The Radeon™ GPU Detective
The Radeon GPU Detective (RGD) is a tool that assists developers in post-mortem analysis of GPU crashes. The tool allows developers to generate and analyze AMD GPU crash dumps and produce information that can help narrow down the search for a crash’s root cause. Some of the information that is included in the crash analysis reports that the tool generates:
-
Execution markers for each command buffer that was executing during the crash, pointing to render passes and draw calls.
-
The offending virtual address, along with information about all the resources that resided in the relevant address ranges, for crashes that are identified as being caused by a page fault.
System requirements
-
Operating system: Windows® 10 or 11.
-
GPU: RDNA™2 (RX 6000 series), RDNA™3 (RX 7000 series) or RDNA™ 4 (RX 9000 series) card.
-
Driver: Radeon Adrenalin™ driver with Crash Analysis support.
-
You will need a game or other application that is crashing the GPU (currently Direct3D 12 or Vulkan are the APIs supported by the tool).
-
To make the most out of the tool, the application should:
Use string markers around render passes:: - D3D12: Using the AMD GPU Services (AGS) library - same as supported by RGP.
Vulkan: Using the VK_EXT_debug_utils extension - functions
vkCmdBeginDebugUtilsLabelEXT,vkCmdEndDebugUtilsLabelEXT.Name GPU resources (heaps, buffers, textures), as these strings appear in the crash analysis summary files and can help identifying the relevant resources in case of a page fault:: - D3D12: Using
ID3D12Object::SetName().
Vulkan: Using VK_EXT_debug_utils extension - function
vkSetDebugUtilsObjectNameEXT.
Using the tool
Generating AMD GPU crash dumps
To learn how to capture AMD GPU crash dump files (.rgd files) and generate crash analysis summary files (text/JSON), please refer to the quickstart-guide.
The crash analysis summary file
The RGD command line tool (rgd.exe) can parse AMD GPU crash dump files (.rgd files) and produce crash analysis report files in text or JSON format. Both the text and JSON summary files include the same information, in different representation. The JSON format can be useful for automated processing of crash reports. For simplicity, we will refer here to the human-readable textual output.
The RGD crash analysis text summary files are encoded in UTF-8 and use some Unicode characters to print the execution marker tree, so make sure you use a text editor that supports this, like Microsoft® Visual Studio Code.
RGD crash analysis output files include the following information by default:
-
Metadata about the crash analysis summary file and session.
-
System information (CPUs, GPUs, driver, OS etc.).
-
Execution marker tree for each command buffer that was in flight during the crash, pointing to render passes and draw calls.
-
Summary of the in-progress markers (similar to the execution marker tree, just without the hierarchy and only including execution markers that were in progress during the crash).
-
Page fault summary for crashes that were determined to be caused by a page fault. Otherwise, the tool will explicitly mention that no page fault was observed.
Here are some more details about the crash analysis file’s contents:
Crash analysis file information
This section is titled CRASH ANALYSIS FILE and contains information about the current summary report and the crashing process.
-
Input crash dump file name: the full path to the .rgd file that was used to generate this file.
-
Input crash dump file creation time: the creation time of the crash dump (.rgd) file.
-
RGD CLI version used: the RGD command line tool version that was used to generate this summary file.
-
Crash analysis file format version: schema version of the current file.
-
Crashing process ID: the process ID of the crashing application.
-
Crashing executable full path: full path to the crashing application executable.
-
API: API (DirectX 12 or Vulkan) that was used by the crashing application.
-
PDB files used [DX12 only]: the list of PDB files that were used to generate the crash analysis summary report.
-
Hardware Crash Analysis: whether the Hardware Crash Analysis feature was enabled when the crash dump was captured.
-
SGPR collection: whether wave SGPRs collection was enabled when the crash dump was captured.
-
VGPR collection: whether wave VGPRs collection was enabled when the crash dump was captured.
System information
This section is titled SYSTEM INFO and includes information about the system on which the crash happened:
-
Operating system information
-
Graphics driver information
-
List of active Driver Experiments
-
Details about the installed CPUs
-
Details about the installed GPUs
Driver Experiments for Crash Analysis
RGD v1.3 supports a powerful new feature called Driver Experiments which lets you toggle certain driver features and optimizations that can change the behavior of your application without modifying its source code or configuration. This is done using Driver Experiments that control the low-level behavior of the Radeon Adrenalin driver. These experiments control features like raytracing or mesh shader support, compiler optimizations and more and can be useful in debugging GPU crashes.
AMD GPU crash dumps (.rgd files) record the list of Driver Experiments that were active during the crash analysis session, so that you always have an accurate picture of the driver configuration with which your app crashed. RGD’s crash analysis output summary text file will display the list of Driver Experiments that were active as part of the System Info section. This information will also be available in RGD’s machine-readable JSON output file. For more details about this feature, please refer to the quickstart-guide.
For a detailed description of each supported experiment, please refer to the Driver Experiments section of the RDP documentation.
Here is an example of active Driver Experiments:
===========SYSTEM INFO===========
Driver info===========...Experiments : total of 4 Driver Experiments were active while capturing the AMD GPU crash dump:        1. Disable sampler feedback support        2. Disable raytracing support        3. Disable variable rate shading        4. Hull shader wave size: Force 32 threads per wave
Markers in progress
This section is titled MARKERS IN PROGRESS and contains information only about the execution markers that were in progress during the crash for each command buffer that was determined to be in flight during the crash.
Here is an example for this section’s contents:
Command Buffer ID: 0x617========================Frame 362 CL0/DownSamplePS/Draw [5 repeating occurrences]Frame 362 CL0/DownSamplePS/BarrierFrame 362 CL0/Bloom/BlurPS/BarrierFrame 362 CL0/Bloom/BlurPS/Draw [2 repeating occurrences]Note that marker hierarchy is denoted by /, forming “paths” like marker/marker/draw_call, similarly to paths in the hierarchy of file systems.
Execution marker tree
This section is titled EXECUTION MARKER TREE and contains a tree describing the marker status for each command buffer that was determined to be in flight during the crash.
User-provided marker strings will be wrapped in "". Other markers, which are autogenerated by AMD components will appear as-is without "".
Here is an example execution marker tree:
Command Buffer ID: 0x617 (Queue type: Direct)=============================================[>] "Frame 362 CL0" ├─[X] "Depth + Normal + Motion Vector PrePass" ├─[X] "Shadow Cascade Pass" ├─[X] "TLAS Build" ├─[X] "Classify tiles" ├─[X] "Trace shadows" ├─[X] ----------Barrier---------- ├─[X] "Denoise shadows" ├─[X] "GltfPbrPass::DrawBatchList" ├─[X] "Skydome Proc" ├─[X] "GltfPbrPass::DrawBatchList" ├─[>] "DownSamplePS" │ ├─[X] ----------Barrier---------- │ ├─[>] Draw(VertexCount=3, InstanceCount=1) │ ├─[>] Draw(VertexCount=3, InstanceCount=1) │ ├─[>] Draw(VertexCount=3, InstanceCount=1) │ ├─[>] Draw(VertexCount=3, InstanceCount=1) │ ├─[>] Draw(VertexCount=3, InstanceCount=1) │ └─[>] ----------Barrier---------- ├─[>] "Bloom" │ ├─[>] "BlurPS" │ │ ├─[>] ----------Barrier---------- │ │ ├─[>] Draw(VertexCount=3, InstanceCount=1) │ │ ├─[>] Draw(VertexCount=3, InstanceCount=1) │ │ └─[ ] ----------Barrier---------- │ ├─[ ] ----------Barrier---------- │ ├─[ ] Draw(VertexCount=3, InstanceCount=1) │ ├─[ ] Draw(VertexCount=3, InstanceCount=1) │ ├─[ ] "BlurPS" │ ├─[ ] Draw(VertexCount=3, InstanceCount=1) │ └─[ ] ----------Barrier---------- └─[ ] "Indirect draw simple"The execution marker status is represented by the following symbols:
-
[X]finished -
[>]in progress -
[#]shader in flight -
[ ]not started
The status (not started, in progress, finished) is determined based on commands that are fetched by the GPU driver
from a command list and are executed through the stages of the GPU pipeline, which encompasses more than just execution of the shaders.
It means that further passes and draw calls may appear as in progress before they start executing their shaders,
even if there are barriers between them.
When passes and draw calls markers are shown as in progress (or shader in flight):
-
If they are meant to execute in parallel (e.g. drawing 3D objects into the G-buffer), it is possible that they were really in progress when the crash happened and any of them could be the crashing one.
-
If they are known to execute serially with barriers between them (e.g. screen-space postprocessing passes), then likely the first
in progress(orshader in flight) marker is the one that was executing its shader when the crash happened.
Execution marker tree features:
-
Thread group count is provided for compute dispatches.
-
Queue type is set to ‘Direct’ for graphics and ‘Compute’ for compute queue.
-
Vertex and instance counts are provided for draw calls.
-
Index and instance counts are provided for indexed draw calls.
-
In the text summary output, barriers are printed with dashed line to visually separate the set of markers in-between barriers.
-
When the crash dump is captured with hardware_crash_analysis feature enabled, a new marker status
shader in flightis added.
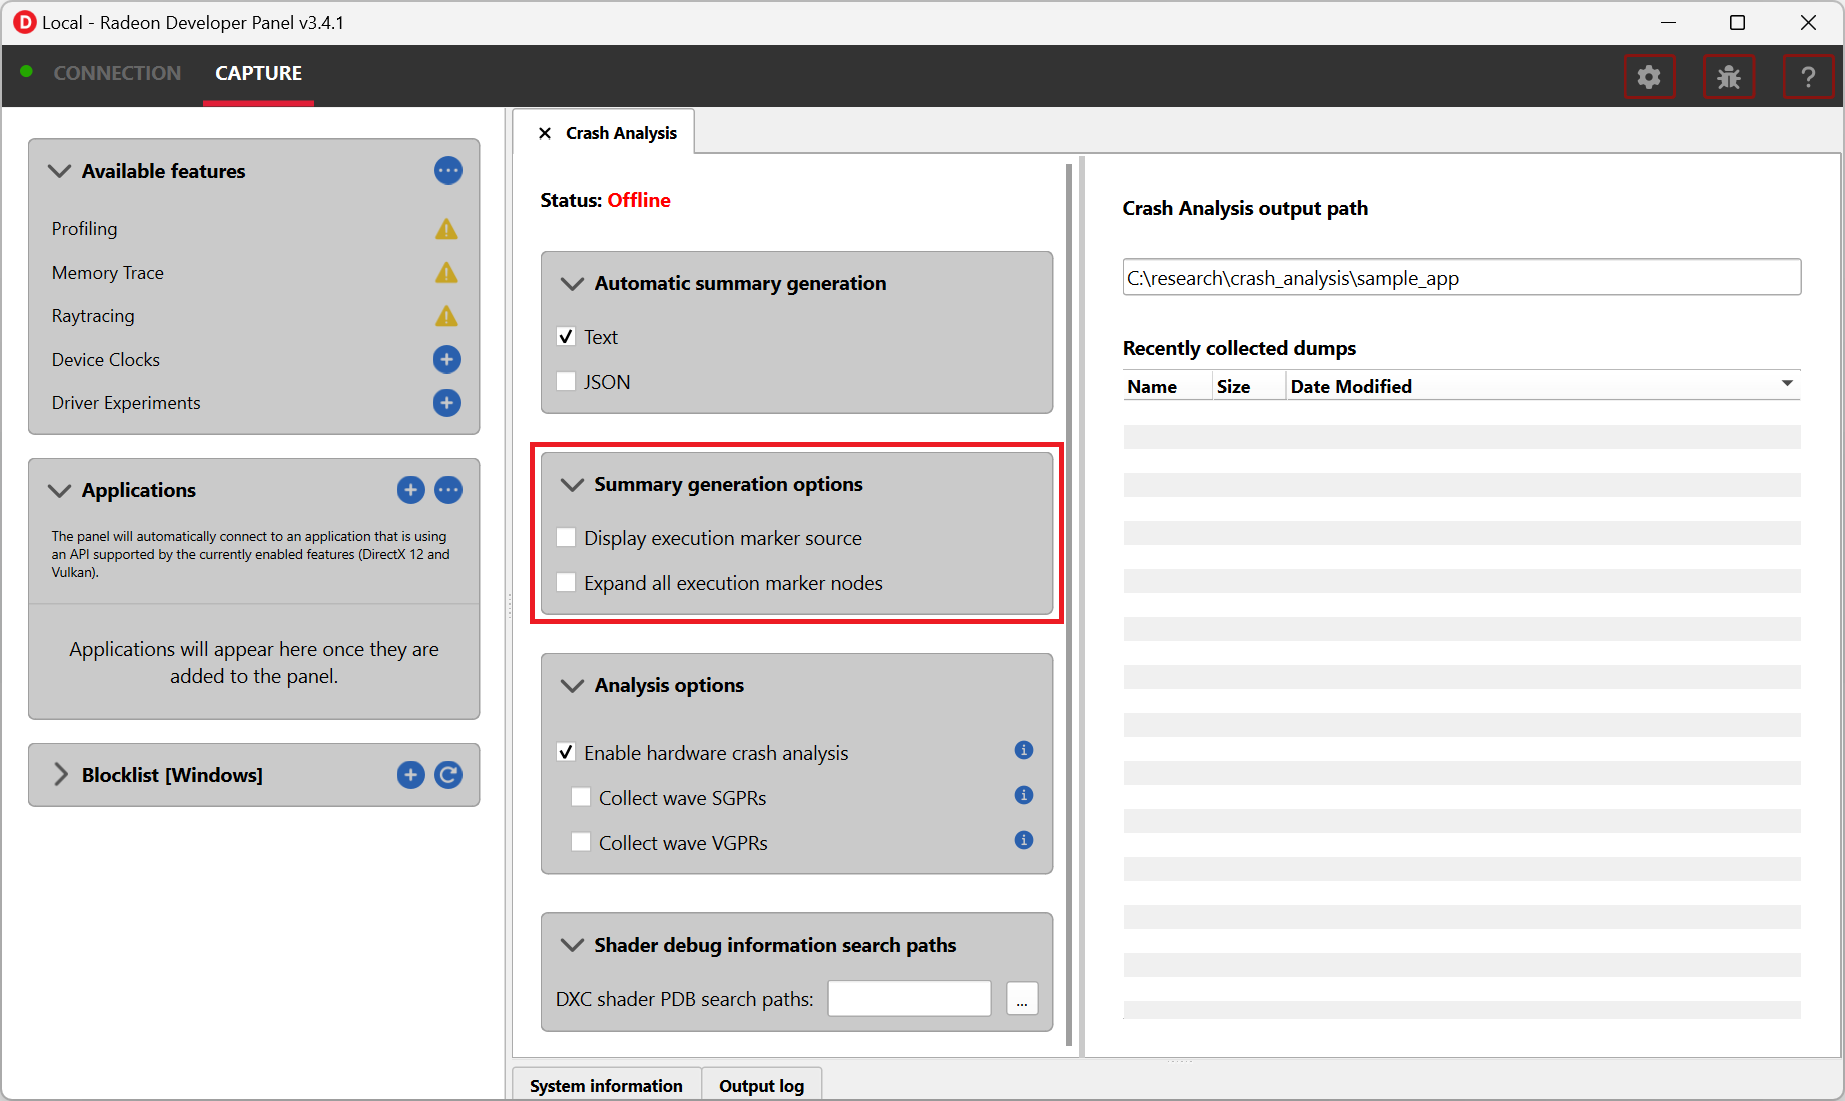
The tree structure and contents are also configurable through the RDP options (or using command line options if running the RGD command line tool directly):
-
Check the Display execution marker source checkbox (or use the
--marker-srccommand line option) to display a suffix that specifies the component that originated the marker (this could be, for instance,[App]for a user marker that originated from the crashing application’s source code). -
Check the Expand all execution marker nodes checkbox (or use the
--expand-markerscommand line option) for all nodes to be expanded. Note that RGD will collapse nodes which have all of their subnodes in finished state to remove noise and improve the tree’s readability.
Page fault summary
In the case that the crash was determined to be caused by a page fault, this section will list the offending virtual address (VA) where the page fault happened. Otherwise, it will be explicitly mentioned that no page fault was detected.
In addition to the offending VA, this section will present information about any resources that ever resided in this address or explicitly mention that no resources ever resided in this address during the crashing application’s lifetime.
If the crash was detected to be caused by a page fault, and resources indeed resided in the relevant VA during the crashing application’s lifetime, the following sections will be added as well:
Resource timeline
The resource timeline chronologically lists relevant events (such as Create, MakeResident and Destroy) for all the resources that ever resided in the relevant VA during the crashing application’s lifetime.
Here is an example of a resource timeline:
Timestamp Event type Resource type Resource identifier Resource size Resource name--------- ---------- ------------- ------------------- ------------- -------------00:00:00.7989056 Create Buffer 0xfcf3bdca0000014f 671088640 (640.00 MB) VidMemBuffer00:00:00.8009888 Bind Buffer 0xfcf3bdca0000014f 671088640 (640.00 MB) VidMemBuffer00:00:00.8009888 Make Resident Buffer 0xfcf3bdca0000014f 671088640 (640.00 MB) VidMemBuffer00:00:06.2607520 Destroy Buffer 0xfcf3bdca0000014f 671088640 (640.00 MB) VidMemBufferThe fields in the Resource timeline section are:
-
Timestamp: the timestamp of the event in
HH:MM:SS.Tickssince the start of the crash analysis session. -
Event type: the type of the event (such as Create, MakeResident and Destroy).
-
Resource type: the type of resource (such as buffer or image).
-
Resource identifier: the resource ID (which is identical to that resource’s ID in RMV).
-
Resource size: the size of the resource.
-
Resource name: the name of the resource (assuming that the resource was named by the developer using
ID3D12Object::SetName()for DX12 memory objects or usingvkSetDebugUtilsObjectNameEXT()for Vulkan memory objects).
Associated resources
Each resource that ever resided in the offending VA during the crashing application’s lifetime, will also be listed under the Associated resources section.
This section will give you more details that can be used to identify the relevant resources that might have played a part in the page fault.
Here is an example of an Image in the Associated resources section:
Resource id: 0x5a49f0600000a7f Type: Image Name: Postprocessing render target 4 Virtual address: 0x236c00000 [size: 16810352 (16.03 MB), parent address + offset: 0x236c00000 + 0x0, preferred heap: Local (GPU memory, CPU-visible)] Commit type: COMMITTED Attributes: Create flags: PREFER_SWIZZLE_EQUATIONS | FIXED_TILE_SWIZZLE (24576) Usage flags: SHADER_READ | SHADER_WRITE | RESOLVE_DESTINATION | COLOR_TARGET (27) Image type: 2D Dimensions <x, y, z>: 1920 x 1080 x 1 Swizzle pattern: XYZW Image format: X16Y16Z16W16_FLOAT Mip levels: 1 Slices: 1 Sample count: 1 Fragment count: 1 Tiling type: Optimal Resource timeline: 00:00:09.4618368 : Create 00:00:09.4622336 : Bind into 0x236c00000 00:00:09.4622336 : Make Resident into 0x236c00000 00:00:09.4634816 : Destroy-
The
Attributessection will be different for different resource types (for example, a buffer will not have anImage formatattribute). -
As you can see, each resource will also have its own
resource timelinefield which will list only the events that apply to that specific resource.
Hardware Crash Analysis
RGD v1.4 brings a powerful new feature: Hardware Crash Analysis. When enabled, RGD collects low-level information about the GPU hardware state upon crash and augments the information that is presented in the Crash Analysis (.rgd) output file with meaningful insights.
New execution marker for in-flight shaders
With Hardware Crash Analysis, a new execution marker state shader in flight is added. RGD correlates the wavefronts in flight to the execution markers and marks nodes that had a running wavefront during the crash and mark the node with [#] symbol.
Below is an example execution marker tree for a DX12 crashing application with Hardware Crash Analysis enabled and shader DXC debug information:
Command Buffer ID: 0x10cc (Queue type: Direct)==============================================[>] "Frame 1060 CL0"├─[X] ----------Barrier----------├─[X] "Depth + Normal + Motion Vector PrePass"├─[X] ----------Barrier----------├─[X] ----------Barrier----------├─[X] "Shadow Cascade Pass"├─[X] "TLAS Build"├─[X] ----------Barrier----------├─[X] "Classify tiles"├─[X] "Trace shadows"├─[X] ----------Barrier----------├─[X] ----------Barrier----------├─[X] "Denoise shadows"├─[X] ----------Barrier----------├─[X] ----------Barrier----------├─[X] "GltfPbrPass::DrawBatchList"├─[X] "Skydome Proc"├─[X] "GltfPbrPass::DrawBatchList"├─[X] ----------Barrier----------├─[>] "DownSamplePS"│ ├─[X] ----------Barrier----------│ ├─[#] Draw(VertexCount=3, InstanceCount=1) <-- has a correlated running wave <SHADER INFO section ID: ShaderInfoID1, Entry point: mainPS, Source file: DownSamplePS.hlsl, API stage: Pixel, API PSO hash: 0xe3204f6b7ea39e98>│ ├─[>] ----------Barrier----------│ ├─[>] ----------Barrier----------│ ├─[#] Draw(VertexCount=3, InstanceCount=1) <-- has a correlated running wave <SHADER INFO section ID: ShaderInfoID1, Entry point: mainPS, Source file: DownSamplePS.hlsl, API stage: Pixel, API PSO hash: 0xe3204f6b7ea39e98>│ ├─[>] ----------Barrier----------│ ├─[>] ----------Barrier----------│ ├─[#] Draw(VertexCount=3, InstanceCount=1) <-- has a correlated running wave <SHADER INFO section ID: ShaderInfoID1, Entry point: mainPS, Source file: DownSamplePS.hlsl, API stage: Pixel, API PSO hash: 0xe3204f6b7ea39e98>│ ├─[>] ----------Barrier----------│ ├─[>] ----------Barrier----------│ ├─[#] Draw(VertexCount=3, InstanceCount=1) <-- has a correlated running wave <SHADER INFO section ID: ShaderInfoID1, Entry point: mainPS, Source file: DownSamplePS.hlsl, API stage: Pixel, API PSO hash: 0xe3204f6b7ea39e98>│ ├─[>] ----------Barrier----------│ ├─[>] ----------Barrier----------│ ├─[#] Draw(VertexCount=3, InstanceCount=1) <-- has a correlated running wave <SHADER INFO section ID: ShaderInfoID1, Entry point: mainPS, Source file: DownSamplePS.hlsl, API stage: Pixel, API PSO hash: 0xe3204f6b7ea39e98>│ └─[>] ----------Barrier----------├─[>] "Bloom"│ ├─[>] "BlurPS"│ │ ├─[>] ----------Barrier----------│ │ ├─[>] Draw(VertexCount=3, InstanceCount=1)│ │ ├─[ ] ----------Barrier----------│ │ ├─[ ] Draw(VertexCount=3, InstanceCount=1)│ │ └─[ ] ----------Barrier----------│ ├─[ ] ----------Barrier----------│ ├─[ ] Draw(VertexCount=3, InstanceCount=1)│ ├─[ ] ----------Barrier----------│ ├─[ ] "BlurPS"│ ├─[ ] ----------Barrier----------│ ├─[ ] Draw(VertexCount=3, InstanceCount=1)│ ├─[ ] ----------Barrier----------│ ├─[ ] "BlurPS"│ ├─[ ] ----------Barrier----------│ ├─[ ] Draw(VertexCount=3, InstanceCount=1)│ ├─[ ] ----------Barrier----------│ ├─[ ] "BlurPS"│ ├─[ ] ----------Barrier----------│ ├─[ ] Draw(VertexCount=3, InstanceCount=1)│ ├─[ ] ----------Barrier----------│ ├─[ ] "BlurPS"│ ├─[ ] ----------Barrier----------│ ├─[ ] Draw(VertexCount=3, InstanceCount=1)│ └─[ ] ----------Barrier----------└─[ ] "Indirect draw simple"Below is an example execution marker tree for a Vulkan crashing application with Hardware Crash Analysis enabled:
Command Buffer ID: 0xea9c (Queue type: Direct)===============================================[>] "Frame 12003 Graphics CB"└─[>] "Vk_Renderer::draw" ├─[X] "Vk_Renderer::draw::Skybox" ├─[X] "Vk_Renderer::draw::Shadow" ├─[X] "Vk_Renderer::draw::Raytracing" ├─[>] "Vk_Renderer::draw::Mesh" │ ├─[X] "Draw Light Spheres" │ ├─[>] "Vk_Renderer::DrawObjectsPBR" │ │ ├─[X] DrawIndexed(IndexCount=2304, InstanceCount=1) │ │ ├─[X] DrawIndexed(IndexCount=2304, InstanceCount=1) │ │ ├─[#] DrawIndexed(IndexCount=2304, InstanceCount=1) <-- has a correlated running wave <SHADER INFO section IDs: {ShaderInfoID1, ShaderInfoID2}> │ │ ├─[#] DrawIndexed(IndexCount=2304, InstanceCount=1) <-- has a correlated running wave <SHADER INFO section IDs: {ShaderInfoID1, ShaderInfoID2}> │ │ │ ⁞ ⁞ ⁞ (7 consecutive occurrences of in progress nodes) │ │ │ │ │ ├─[#] DrawIndexed(IndexCount=6, InstanceCount=1) <-- has a correlated running wave <SHADER INFO section IDs: {ShaderInfoID1, ShaderInfoID2}> │ │ ├─[#] DrawIndexed(IndexCount=6, InstanceCount=1) <-- has a correlated running wave <SHADER INFO section IDs: {ShaderInfoID1, ShaderInfoID2}> │ │ ├─[ ] DrawIndexed(IndexCount=6, InstanceCount=1) │ │ ├─[ ] DrawIndexed(IndexCount=6, InstanceCount=1) │ │ └─[ ] DrawIndexedIndirectMulti │ ├─[ ] DrawIndexed(IndexCount=6, InstanceCount=1) │ ├─[ ] DrawIndexed(IndexCount=6, InstanceCount=1) │ └─[ ] "Vk_Renderer::draw::mesh_shader" ├─[ ] "Vk_Renderer::draw::Bloom" └─[ ] "Vk_Renderer::draw::Fullscreen"Details about the crashing shader
For each marker node annotated with [#] (shader in flight):
-
a unique associated SHADER INFO section ID, API PSO hash and API stage for associated shader is provided.
-
when a PDB search path is provided and the files that contain the debug information are successfully correlated to their corresponding in-flight shaders, the shader’s entry point and source file are also provided.
-
when more than one in-flight shaders is associated with the same execution marker, only a list of unique associated SHADER INFO section IDs is provided.
As you can see, the annotation of the in-flight execution markers contains a reference to ShaderInfoID1. This is a handle which you can use to jump to a new section that is added to the RGD output file: the SHADER INFO section. The name ShaderInfoID1 is arbitrary. Its purpose is to serve as a unique string identifier in the scope of the RGD output text file, which will allow you to jump quickly to the relevant sections of the text file when searching that string.
SHADER INFO
This section is titled SHADER INFO and contains a low-level information about the shaders which are identified as in-flight at the time of the crash.
-
The
SHADER INFOsection will list the following information for each shader that was in flight at the time of the crash::: - Shader Info ID : Arbitrary identifier for the shader info. -
API stage : The API stage of the given shader.
-
API PSO hash : Hash value that uniquely identifies the API Pipeline State Object (PSO) that was used to create the shader.
-
API shader hash : Hash value that uniquely identifies the shader.
-
File name : [DX12 only] The name of the source file in which the shader was defined, if available (e.g. “DownSamplePS.hlsl”).
-
Entry point name : [DX12 only] The name of the shader’s entry point, if available (e.g. “mainPS”).
-
Shader IO and resource bindings : [DX12 only] Information about the shader’s input/output and resource bindings, if available.
-
HLSL source code : [DX12 only] The HLSL source code of the shader, if available.
-
Disassembly : Disassembly of the shader showing the consolidated pointers to instruction/s which were being executed by one or more wavefronts at the time of the crash.
-
Shader Resource Descriptor (SRD) Analysis: When the offending (or in‑flight) instruction uses SGPR-resident resource descriptors (e.g. image / buffer / sampler / BVH SRDs) and wave SGPRs collection was enabled at capture time, RGD decodes the relevant 32 or 64 bit words and appends an
SRD ANALYSISsubsection to the SHADER INFO entry. See the section Shader Resource Descriptor (SRD) Analysis for more details.
Here is an example of a shader info:
===========SHADER INFO===========
Shader info ID  : ShaderInfoID1API stage       : PixelAPI PSO hash    : 0xe3204f6b7ea39e98API shader hash : 0x9447bd598a9ffcb7022a22c95d0031c4 (high: 0x9447bd598a9ffcb7, low: 0x22a22c95d0031c4)Entry point name: N/A (requires debug information, recompile shader with "-Zi -Qembed_debug'", '-Zi -Qsource_in_debug_module' or '-Zs')Source file     : N/A (requires debug information, recompile shader with "-Zi -Qembed_debug'", '-Zi -Qsource_in_debug_module' or '-Zs')
Shader IO and resource bindings===============================N/A (requires debug information, recompile shader with "-Zi -Qembed_debug'", '-Zi -Qsource_in_debug_module' or '-Zs')

HLSL source code================N/A (requires debug information, recompile shader with "-Zi -Qembed_debug'", '-Zi' or '-Zs')
Disassembly===========    .    .    .    v_interp_p2_f32 v2, v3, v1, v0 wait_exp:7                  // 000000000360: CD010702 04020303    s_mov_b32 s4, s5                                           // 000000000368: BE840005    s_mov_b32 s5, s9                                           // 00000000036C: BE850009    s_load_b256 s[4:11], s[4:5], null                          // 000000000370: F40C0102 F8000000    s_waitcnt lgkmcnt(0)                                       // 000000000378: BF89FC07    v_mul_f32_e64 v3, 2.0, s0                                  // 00000000037C: D5080003 000000F4    v_mul_f32_e64 v0, 2.0, s1                                  // 000000000384: D5080000 000002F4    s_delay_alu instid0(VALU_DEP_2) | instskip(NEXT) | instid1(VALU_DEP_2)// 00000000038C: BF870112    v_sub_f32_e32 v1, v4, v3                                   // 000000000390: 08020704    v_sub_f32_e32 v3, v2, v0                                   // 000000000394: 08060102    v_fma_f32 v0, s0, 2.0, v4                                  // 000000000398: D6130000 0411E800    v_fma_f32 v6, s1, 2.0, v2                                  // 0000000003A0: D6130006 0409E801    s_mov_b32 s12, 0x8007092                                   // 0000000003A8: BE8C00FF 08007092    s_mov_b32 s13, 0xfff000                                    // 0000000003B0: BE8D00FF 00FFF000    s_mov_b32 s14, 0x64500000                                  // 0000000003B8: BE8E00FF 64500000    s_mov_b32 s15, 0x80000000                                  // 0000000003C0: BE8F00FF 80000000    s_clause 0x8                                               // 0000000003C8: BF850008>   image_sample  v[8:11], [v0, v6], s[4:11], s[12:15] dmask:0xf dim:SQ_RSRC_IMG_2D// 0000000003CC: F06C0F05 0C010800 00000006   <-- ***PAGE FAULT SUSPECT (128 waves)***    image_sample  v[12:15], [v4, v6], s[4:11], s[12:15] dmask:0xf dim:SQ_RSRC_IMG_2D// 0000000003D8: F06C0F05 0C010C04 00000006    image_sample  v[18:21], [v1, v6], s[4:11], s[12:15] dmask:0xf dim:SQ_RSRC_IMG_2D// 0000000003E4: F06C0F05 0C011201 00000006    image_sample  v[22:25], [v0, v2], s[4:11], s[12:15] dmask:0xf dim:SQ_RSRC_IMG_2D// 0000000003F0: F06C0F05 0C011600 00000002    image_sample  v[26:29], [v4, v2], s[4:11], s[12:15] dmask:0xf dim:SQ_RSRC_IMG_2D// 0000000003FC: F06C0F05 0C011A04 00000002    image_sample v[30:33], v[1:2], s[4:11], s[12:15] dmask:0xf dim:SQ_RSRC_IMG_2D// 000000000408: F06C0F04 0C011E01    image_sample  v[34:37], [v0, v3], s[4:11], s[12:15] dmask:0xf dim:SQ_RSRC_IMG_2D// 000000000410: F06C0F05 0C012200 00000003    image_sample  v[4:7], [v4, v3], s[4:11], s[12:15] dmask:0xf dim:SQ_RSRC_IMG_2D// 00000000041C: F06C0F05 0C010404 00000003    image_sample  v[0:3], [v1, v3], s[4:11], s[12:15] dmask:0xf dim:SQ_RSRC_IMG_2D// 000000000428: F06C0F05 0C010001 00000003    s_cmp_eq_i32 s2, 0                                         // 000000000434: BF008002    s_cbranch_scc1 _L5                                         // 000000000438: BFA20041    s_waitcnt vmcnt(7)                                         // 00000000043C: BF891FF7    v_add_f32_e32 v8, v8, v12                                  // 000000000440: 06101908    v_add_f32_e32 v9, v9, v13                                  // 000000000444: 06121B09    v_add_f32_e32 v10, v10, v14                                // 000000000448: 06141D0A    v_add_f32_e32 v11, v11, v15                                // 00000000044C: 06161F0B    s_waitcnt vmcnt(6)                                         // 000000000450: BF891BF7    s_delay_alu instid0(VALU_DEP_4) | instskip(NEXT) | instid1(VALU_DEP_4)// 000000000454: BF870214    v_add_f32_e32 v8, v18, v8                                  // 000000000458: 06101112    .    .    .
The example SHADER INFO section contains a shader (ShaderInfoID1), which matches the execution marker tree. Alongside the shader metadata you can see the relevant subset of the crashing shader’s disassembly. If the crash was caused by a page fault that the shader triggered, RGD will mark the offending instruction for you with a > prefix in the relevant disassembly line and an annotation that marks the page fault culprit suspect and the number of wavefronts that were executing that instruction at the time of the crash. By default, the tool will only include the relevant subset of the shader’s disassembly in the output file, in order to remove as much noise as possible. Around a page fault suspect instruction, you will find a small number of instructions to give you the context in which the suspect instruction was executing in. The vertical … lines denote filtered instructions.
In case that you do need to see the full shader disassembly, you can do that by manually running the rgd command line tool with the AMD GPU crash dump (.rgd) file as the input and using the —all-disassembly command line option (refer to the rgd command line tool help manual for more information by running rgd -h).
For the tool to be able to retrieve the additional low-level information for your GPU crash case a few things need to happen. First, you must make sure that the Hardware Crash Analysis checkbox is checked in Radeon Developer Panel’s (RDP) Crash Analysis tab (that is the case by default). In addition, since this version of the tool focuses on offending shaders, the GPU crash obviously needs to be triggered by a shader-executing hardware block. If the GPU crash happened somewhere else, no shader will be associated with the execution tree markers, and you will not have the benefits of the new Hardware Crash Analysis mode. However, in the case that your crash case is supported by RGD, you can count on the “standard” (RGD v1.3) information to be included, whether or not the Hardware Crash Analysis feature was applicable to your crash case.
DXC debug information
With DXC debug information support, the debug information that is produced by Microsoft®‘s DirectX Shader Compiler (DXC) is used to augment the crash analysis output file with helpful information about offending high-level shaders.
Supported Formats
DXC can generate debug information in the following formats, all of which are supported by RGD:
- Embedded (-Zi -Qembed_debug): Debug information is embedded in the same file that contains the compiled shader.
- Separate (-Zi -Qsource_in_debug_module -Fd
<PDB output path>): Debug information is stored in a separate PDB file. - Small (Slim) (-Zs -Fd
<PDB output path>): A minimal PDB file containing only high-level source code and compile options.
Usage
How to use DXC debug information to improve RGD output?
-
Ensure that Hardware Crash Analysis is enabled in the Radeon Developer Panel (RDP).
-
Configure the debug information file search paths:
-
All the PDB search paths that were listed in RDP during the crash dump capture will be recorded in the AMD GPU crash dump (.rgd) file and automatically used by the RGD command line when parsing that file.
-
If the relevant path is only known later during analysis, you can use the —pdb-path command line option to ensure that the rgd command line tool locates and uses the files that include the debug information.
-
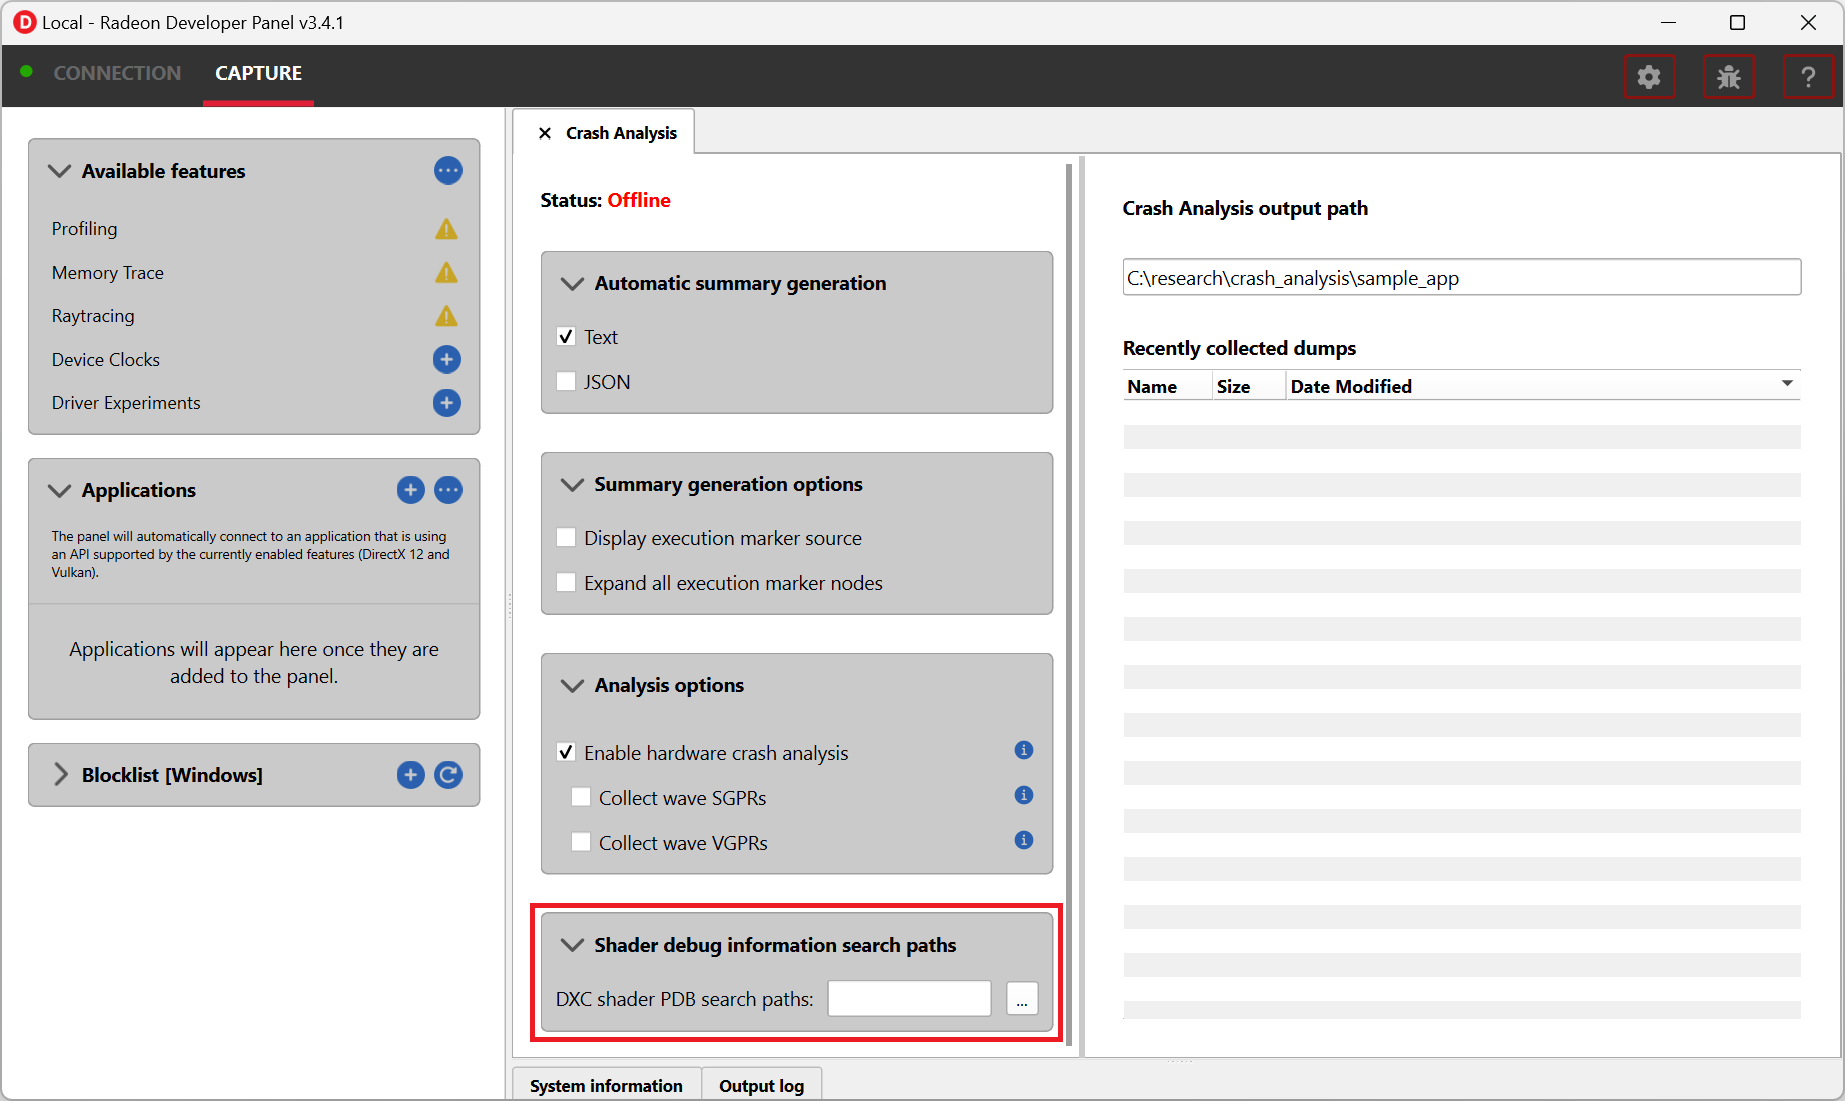
Configuration in RDP
You can configure the debug information file search paths using the “Shader debug information search paths” UI in RDP. This allows RGD to locate the relevant debug information files during crash analysis.
New Information in Crash Reports
When debug information is available, the crash analysis report includes:
-
File name and entry point name of the offending shader.
-
Shader IO and resource bindings, detailing inputs, outputs, and resource usage.
-
HLSL source code for the shader, with relevant sections highlighted.
Here is an example of the SHADER INFO when debug information is available:
===========SHADER INFO===========
Shader info ID  : ShaderInfoID1API stage       : PixelAPI PSO hash    : 0xe3204f6b7ea39e98API shader hash : 0x9447bd598a9ffcb7022a22c95d0031c4 (high: 0x9447bd598a9ffcb7, low: 0x22a22c95d0031c4)File name       : DownSamplePS.hlslEntry point name: mainPS

Shader IO and resource bindings===============================;; Input signature:;; Name                 Index   Mask Register SysValue  Format   Used; -------------------- ----- ------ -------- -------- ------- ------; TEXCOORD                 0   xy          0     NONE   float   xy;;; Output signature:;; Name                 Index   Mask Register SysValue  Format   Used; -------------------- ----- ------ -------- -------- ------- ------; SV_Target                0   xyzw        0   TARGET   float   xyzw;; shader debug name: 1396690ed550686e26be113392120f5b.pdb; shader hash: 1396690ed550686e26be113392120f5b;; Pipeline Runtime Information:;;PSVRuntimeInfo:; Pixel Shader; DepthOutput=0; SampleFrequency=0; MinimumExpectedWaveLaneCount: 0; MaximumExpectedWaveLaneCount: 4294967295; UsesViewID: false; SigInputElements: 1; SigOutputElements: 1; SigPatchConstOrPrimElements: 0; SigInputVectors: 1; SigOutputVectors[0]: 1; SigOutputVectors[1]: 0; SigOutputVectors[2]: 0; SigOutputVectors[3]: 0;;; Input signature:;; Name                 Index             InterpMode DynIdx; -------------------- ----- ---------------------- ------; TEXCOORD                 0                 linear;; Output signature:;; Name                 Index             InterpMode DynIdx; -------------------- ----- ---------------------- ------; SV_Target                0;; Buffer Definitions:;; cbuffer cbPerFrame; {;;   struct cbPerFrame;   {;;       float2 u_invSize;                             ; Offset:    0;       int u_mipLevel;                               ; Offset:    8;;   } cbPerFrame;                                     ; Offset:    0 Size:    12;; };;; Resource Bindings:;; Name                                 Type  Format         Dim      ID      HLSL Bind  Count; ------------------------------ ---------- ------- ----------- ------- -------------- ------; cbPerFrame                        cbuffer      NA          NA     CB0            cb0     1; samLinearMirror                   sampler      NA          NA      S0             s0     1; inputTex                          texture     f32          2d      T0             t0     1;;; ViewId state:;; Number of inputs: 2, outputs: 4; Outputs dependent on ViewId: {  }; Inputs contributing to computation of Outputs:;   output 0 depends on inputs: { 0, 1 };   output 1 depends on inputs: { 0, 1 };   output 2 depends on inputs: { 0, 1 };   output 3 depends on inputs: { 0, 1 };
HLSL source code================// Copyright(c) 2025 Advanced Micro Devices, Inc.All rights reserved.////--------------------------------------------------------------------------------------// Constant Buffer//--------------------------------------------------------------------------------------cbuffer cbPerFrame : register(b0){    float2 u_invSize;    int u_mipLevel;}
//--------------------------------------------------------------------------------------// I/O Structures//--------------------------------------------------------------------------------------struct VERTEX{    float2 vTexcoord : TEXCOORD;};
//--------------------------------------------------------------------------------------// Texture definitions//--------------------------------------------------------------------------------------Texture2D        inputTex         :register(t0);SamplerState     samLinearMirror  :register(s0);
//--------------------------------------------------------------------------------------// Main function//--------------------------------------------------------------------------------------
static float2 offsets[9] = {    float2( 1, 1), float2( 0, 1), float2(-1, 1),    float2( 1, 0), float2( 0, 0), float2(-1, 0),    float2( 1,-1), float2( 0,-1), float2(-1,-1)    };
float4 mainPS(VERTEX Input) : SV_Target{    // gaussian like downsampling
    float4 color = float4(0,0,0,0);
    if (u_mipLevel==0)    {        for(int i=0;i<9;i++)            color += log(max(inputTex.Sample(samLinearMirror, Input.vTexcoord + (2 * u_invSize * offsets[i])), float4(0.01, 0.01, 0.01, 0.01) ));        return exp(color / 9.0f);    }    else    {        for(int i=0;i<9;i++)            color += inputTex.Sample(samLinearMirror, Input.vTexcoord + (2 * u_invSize * offsets[i]) );        return color / 9.0f;    }}
Please note that while the HLSL source code is included in the output file, there is currently no correlation between the offending RDNA instruction and the corresponding high-level source lines. We are actively working with our compiler teams to enable this capability and look forward to sharing updates in a future release.
Shader Resource Descriptor (SRD) Analysis
In RGD 1.6, when an offending or in-flight RDNA instruction utilizes an SRD for a resource such as an image, buffer, sampler, or BVH, the tool will decode the SRD, disassemble it and present the information in the output file in a new Shader Resource Descriptor (SRD) Analysis subsection, under the SHADER INFO section.
This feature can be helpful in diagnosing issues like stale, corrupted, or incorrectly indexed descriptors, which often manifest as page faults or invalid memory access.
For more information about individual SRD fields, please refer SRD Field Descriptions section.
Here is an example output when SGPRs collection was enabled at capture time and the offending instruction uses image and sampler SRDs:
Shader Resource Descriptor (SRD) Analysis=========================================Instruction: image_sample v[8:11], [v4, v6], s[0:7], s[12:15] dmask:0xf dim:SQ_RSRC_IMG_2D// 0000000004D0: E7C6C001 06000008 00000604
    Image SGPRs (s[0:7]):      Image (RDNA4):        BaseAddress: 0x236dc0000        Max_Mip: 0x0        Format: IMG_FMT_16_16_16_16_FLOAT        Base_Level: 0x0        Width: 0x780        Height: 0x438        DstSel_X: DstSel.X        DstSel_Y: DstSel.Y        DstSel_Z: DstSel.Z        DstSel_W: DstSel.W        No_Edge_Clamp: false        Last_Level: 0x0        SW_MODE: SW_64KB_2D        BC_SWIZZLE: TEX_BC_Swizzle_XYZW        Resource_Type: SQ_RSRC_IMG_2D        Pitch: 0x1        Base_Array: 0x0        UAV_3D: false        Min_Lod_Warn: 0x0        Perf_Mod: 0x4        Corner_Sample: false        Linked_Resource: false        Min_Lod: 0x0        Iterate_256: false        Sample_Pattern_Offset: 0        Max_Uncompressed_Block_Size: 1        Max_Compressed_Block_Size: 2        Write_Compress_En: true        Compression_En: true        Compression_Access_Mode: 0        Speculative_Read: 0
    Sampler SGPRs (s[12:15]):      Sampler (RDNA4):        Clamp X: SQ_TEX_CLAMP_LAST_TEXEL (2)        Clamp Y: SQ_TEX_CLAMP_LAST_TEXEL (2)        Clamp Z: SQ_TEX_CLAMP_LAST_TEXEL (2)        Max Aniso Ratio: SQ_TEX_ANISO_RATIO_1        Depth Compare Function: TEX_DepthCompareFunction_Always        Force Unnormalized: false        Aniso Threshold: 0        MC Coord Trunc: false        Force Degamma: false        Aniso Bias: 0        Trunc Coord: true        Disable Cube Wrap: false        Filter Mode: SQ_IMG_FILTER_MODE_BLEND (0)        Skip Degamma: false        Min LOD: 0        Max LOD: 31.9961        Perf Z: 0        LOD Bias: 0        LOD Bias Sec: 0        XY Mag Filter: TEX_XYFilter_Linear (1)        XY Min Filter: TEX_XYFilter_Linear (1)        Z Filter: TEX_ZFilter_None (0)        Mip Filter: TEX_MipFilter_Point (1)        Aniso Override: true        Perf Mip: 0        Border Color Ptr: 0        Border Color Type: SQ_TEX_BORDER_COLOR_OPAQUE_WHITE (2)
When wave SGPRs and/or VGPRs collection is enabled, RGD collects the SGPRs and VGPRs for all the active waves at the time of the crash. This may result in a longer capture time and a significantly larger crash dump file generated.
By default, raw VGPR and SGPR data is excluded from RGD crash analysis summary output file to prevent bloating the output. To include this data, rerun the rgd CLI tool with the --raw-gpr-data option.
The SRD analysis feature requires wave SGPRs collection to be enabled at capture time. Since SGPR/VGPR collection may increase the crash dump (.rgd) file size, these options are not enabled by default in the Radeon Developer Panel (RDP). You can easily enable these options individually through the RDP UI before starting any Crash Analysis session if necessary.
Interpreting the results
There are generally 3 possible scenarios when interpreting the crash analysis summary report:
| Page Fault Detected? | VA has associated resources? | Meaning |
|---|---|---|
| Yes | Yes | Attempt to access a resource that’s already destroyed/released (or something similar) |
| Yes | No (means no resource ever resided in this VA) | Either out of bounds access or attempt to access garbage data |
| No | No | Hang (use markers to narrow down) |
Let’s elaborate:
-
If a page fault was detected and associated resources are found, it likely means that the bug is due to accessing a resource after it has been released or evicted from memory. An incorrect (stale or wrongly indexed) descriptor is a possible cause. It would then be a good idea to examine each of the resource’s timelines:
-
When resource timeline ends with
Destroyevent, the resource was accessed by the GPU after it has been released with a D3D12Release()call or a Vulkan equivalent call such asvkDestroyImage()call. -
When resource timeline ends with
Evictevent, the resource was accessed by the GPU after it was evicted with a D3D12Evict()call. -
When resource timeline doesn’t include
MakeResidentevent, the resource was created as non-resident.
-
-
If a page fault was detected but no associated resources are found, it likely means that the GPU (e.g. a shader) tried to access memory at an incorrect address, which may indicate a bug in address calculation or indexing.
-
When no page fault was detected, it likely means the crash was not related to memory access, but a different other type of problem, e.g. a shader hang due to timeout (too long execution) or an infinite loop.
Scope of v1.6
RGD is designed to capture GPU crashes on Windows. If a GPU fault (such as memory page fault or infinite loop in a shader) causes the GPU driver to not respond to the OS for some pre-determined time period (the default on Windows is 2 seconds), the OS will detect that and attempt to restart or remove the device. This mechanism is also known as “TDR” (Timeout Detection and Recovery) and is what we consider to be a GPU crash for the scope of this tool.
From a functional user perspective, when a GPU crash happens, the screen may flash or turn black for a few seconds and the “AMD Bug Report Tool” window will show up.
In the crashing application code, a D3D12 or DXGI function such as IDXGISwapChain::Present() will return an error code such as
DXGI_ERROR_DEVICE_RESET, DXGI_ERROR_DEVICE_REMOVED, DXGI_ERROR_DEVICE_HUNG or DXGI_ERROR_DRIVER_INTERNAL_ERROR,
and the D3D12 Device object will become unusable. Similarly, a Vulkan function such as vkAcquireNextImageKHR will return an error code like VK_ERROR_DEVICE_LOST.
Note that RGD will not detect pure CPU crashes (for example, CPU null pointer dereference or integer division by zero). You will need to use a CPU debugger for that. Please use CPU debugging mechanisms like Microsoft Visual Studio to investigate such cases.
Rendering code which incorrectly uses D3D12 or Vulkan may also fail purely on the CPU and not reach the graphics driver or the GPU.
Therefore, such crashes are not captured by RGD. They usually result in DXGI_ERROR_INVALID_CALL error code returned, and
are usually detected by the D3D12 Debug Layer.
For DX12 applications Hardware Crash Analysis feature now supports debug information. See the section hardware_crash_analysis for more details.
Shader Resource Descriptor (SRD) Analysis is supported when SGPR register collection is enabled at capture time. See the section Shader Resource Descriptor (SRD) Analysis for more details.
When debugging a problem in any D3D12 application, first enable the D3D12 Debug Layer and make sure there are no errors (and preferably no warnings) reported before using more advanced tools, like RGD. The output of the Debug Layer is printed to the “Output” panel in Visual Studio when running the app under the debugger. Otherwise, it can be captured using the DebugView tool, which is part of the Sysinternals utilities that are freely available online from Microsoft®.
In Unreal Engine, you can enable it using -d3ddebug command-line parameter.
When programming in Vulkan, enable Vulkan Validation Layers and check if there are no errors or warnings reported that may be related to the bug you are investigating.
Usage tips for RGD
-
Enable the D3D12 Debug Layer / Vulkan Validation Layers before using RGD. The validation layers can catch certain errors that do not even make it to the GPU driver or the GPU itself and are not detected by the tool. Doing so can save you a lot of time.
-
Unreal Engine already supports our markers. You just need to use Development version of the executable and enable variable
D3D12.EmitRgpFrameMarkers=1in “Engine.ini” file. -
Insert more fine-grained markers: If the execution markers that are shown by RGD do not give you precise enough information about the area of the crash, you can insert more fine-grained markers to your rendering code around some render passes, even individual draw calls and include additional information in their strings, like the name of a material, shader, or specific object. Use the
in progressmarkers shown by RGD as a guideline to where more markers might be needed. -
Try DRED with Crash Analysis Enabled: If your code implements custom functionality to report GPU crashes using
WriteBufferImmediate()or the Device Removed Extended Data (DRED) API, RGD can be used with it as well. Enabling “Crash Analysis” in RDP can make such custom breadcrumb markers more accurate. To do that, follow the same steps for capturing a GPU crash dump with the relevant application. This will make sure that Crash Analysis mode will be enabled in the driver when your application is run. -
In Vulkan, the old device extension VK_EXT_debug_marker is also supported by RGD, but it is now deprecated in favor of the VK_EXT_debug_utils instance extension.
-
Try Crash Analysis with Driver Experiments: If you suspect that certain optimizations or features enabled by the driver might be causing the crash, you can try to disable them using Driver Experiments. This can help you narrow down the search for the cause of the crash.
Known issues and workarounds
-
PIX markers (
PIXBeginEvent,PIXEndEvent) are not captured by RGD. To see the hierarchy of markers around render passes, you need to use the markers from AGS library, either directly (agsDriverExtensionsDX12_PushMarker,agsDriverExtensionsDX12_PopMarker) or using the replacement header for PIX markers provided with this package that uses them automatically. Otherwise, you would see only a flat list of draw calls. This is the same requirement as for RGP. For more information, see the RGP documentation (“User Debug Markers” chapter). -
Only push-pop scopes are captured. Point markers in AGS library (
agsDriverExtensionsDX12_SetMarker) are ignored by RGD, and so are point markers in Vulkan (vkCmdInsertDebugUtilsLabelEXT). -
In the current version of RGD, markers that cross command list boundaries (begin on one command list, end on another one) are not handled properly and may not show up in the RGD output.
-
A system reboot is recommended after the driver installation. An invalid crash dump file may get generated when RGD workflow is executed after a fresh driver installation without a system reboot.
Appendix
This section contains supplementary information and reference materials.
SRD Field Descriptions
Legend:
- ✓ Supported field
- ✗ Unsupported field
Image SRD Fields
| Field Name | RDNA3 | RDNA4 | Description |
|---|---|---|---|
| Base address | ✓ | ✓ | 256-byte aligned (represents bits 47:8). |
| Llc_NoAlloc | ✓ | ✗ | 0: NOALLOC = (PTE.NOALLOC | instruction.dlc) 1: NOALLOC = Read ? (PTE.NOALLOC | instruction.dlc) : 1 2: NOALLOC = Read ? 1 : (PTE.NOALLOC | instruction.dlc) 3: NOALLOC = 1 |
| Big page | ✓ | ✗ | 0 = No page size override 1 = coalesce page translation requests to 64kB granularity. Use only when entire resource uses pages 64kB or greater. |
| Max mip | ✓ | ✓ | MSAA resources: holds Log2(number of samples) others holds: MipLevels-1. This describes the resource, not the resource view. |
| Format | ✓ | ✓ | Memory Data format |
| Width | ✓ | ✓ | width-1 of mip 0 in texels |
| Height | ✓ | ✓ | height-1 of mip 0 in texels |
| Dst_sel_x / Dst_sel_y / Dst_sel_z / Dst_sel_w | ✓ | ✓ | 0 = 0, 1 = 1, 4 = R, 5 = G, 6 = B, 7 = A. |
| No_Edge_Clamp | ✗ | ✓ | Disable edge clamping for load/store so that blocks on the edge of a compressed texture aren’t clamped to zero (when software copies the resource as raw 128bit) |
| Base level | ✓ | ✓ | Largest mip level in the resource view. For MSAA, this should be set to 0 |
| Last level | ✓ | ✓ | Smallest mip level in the resource view. For MSAA, holds log2(number of samples) |
| SW_MODE | ✓ | ✓ | Sets the swizzle(tiling) mode |
| BC swizzle | ✓ | ✓ | Specifies channel ordering for border color data independent of the T# dst_sel*s. Internal xyzw channels get the following border color channels as stored in memory. 0=xyzw, 1=xwyz, 2=wzyx, 3=wxyz, 4=zyxw, 5=yxwz |
| Resource Type | ✓ | ✓ | 0 = buf, 8 = 1d, 9 = 2d, 10 = 3d, 11 = cube, 12 = 1d-array, 13 = 2d-array, 14 = 2d-msaa, 15 = 2d-msaa-array. 1-7 are reserved. |
| Pitch_msb | ✓ | ✓ | 1D or 2D, MSAA resources: MSBs of pitch-1. i.e. (pitch-1)[15:14] of mip 0, if pitch > width. Other resources: Must be zero |
| Base array | ✓ | ✓ | First slice in array of the resource view. |
| UAV3D | ✗ | ✓ | 3D resources: bit 0 indicates SRV or UAV: 0: SRV (base_array ignored, depth w.r.t. base map) 1: UAV (base_array and depth are first and last layer in view, and w.r.t. mip level specified) Other resources: Not used |
| Array pitch | ✓ | ✗ | For Arrays, array pitch for quilts, encoded as trunc(log2(array pitch))+1. values 8..15 reserved For 3D, bit 0 indicates SRV or UAV: 0: SRV (base_array ignored, depth w.r.t. base map) 1: UAV (base_array and depth are first and last layer in view, and w.r.t. mip level specified) |
| Min_Lod_Warn | ✓ | ✓ | feedback trigger for LOD, u5.8 format |
| Perf_mod | ✓ | ✓ | scales sampler’s perf_z, perf_mip, aniso_bias, lod_bias_sec |
| Corner samples mod | ✓ | ✓ | Describes how texels were generated in the resource. 0=center sampled 1=corner sampled |
| Linked_resource | ✓ | ✓ | Indicates if T# contains information describing a linked resource further describes by T#.linked_resource_type 0 : ""Normal"" resource, no linked resource information 1 : Contains linked resource information When this bit is set and linked resource information exists, the following fields are re-defined: base_address, min_lod_warn, bc_swizzle, max_mip, meta_address. See field descriptions for more details. |
| PRT_Default | ✓ | ✗ | PRT unmapped returns 0.0 or 1.0 if this bit is 0 or 1 respectively |
| Min LOD | ✓ | ✓ | smallest LOD allowed for PRTs, u4.8 format |
| Iterate 256 | ✓ | ✓ | MSAA depth surfaces: indicates that compressed tiles in this surface have been flushed out to every 256B of the tile. For other types (with PRT_LOD_STAT feature enabled): This field specifies the bank_id used by PRT counters for LOD stats accumulation |
| Sample_pattern_offset | ✓ | ✓ | For MSAA surfaces, this field contains: samplePatternOffset //must use bit[206:203] For bindless textures, the driver uses these bits to pass a sample index to shader compiler. The index gets used for returning the sample position for a SamplePos op. For other types (with PRT_LOD_STAT feature enabled): This field specifies the bank_id used by PRT counters for LOD stats accumulation |
| Max_uncompressed_block_size | ✓ | ✓ | Maximum uncompressed block size used for compressed shader writes: 0=64B, 1=128B, 2=256B (recommended), 3=reserved |
| Max_compressed_block_size | ✓ | ✓ | For compressed writes: maximum compressed block size and independent block size For compressed reads: independent block size 0=64B not supported with compressed shader write, supported with read 1=128B supported with compressed shader write and read 2=reserved, 3=reserved |
| Meta pipe aligned | ✓ | ✗ | Maintain pipe alignment in metadata addressing (DCC and TILING) |
| Write_compress_en | ✓ | ✓ | Enable compressed writes from shader |
| Compression enable | ✓ | ✓ | Enable Delta Color Compression (DCC) |
| Alpha is on MSB | ✓ | ✗ | Set to 1 if the surface’s component swap is
not reversed (DCC) |
| Color transform | ✓ | ✗ | auto=0, none=1 (DCC) |
| Metadata address | ✓ | ✗ | Upper bits of meta-data address (DCC) [47:8] |
| Compression_Access_Mode | ✗ | ✓ | See table below for interaction with write_compress_enable and compression_en 0x0 = normal 0x1 (= force_existing_data_to_decompress) 0x2 (= compressed_data_access) 0x3 (= metadata_access) |
| Speculative_read | ✗ | ✓ | Fetch compressed data speculatively on a metadata miss in the MALL. Driven by the SRD for the shader, otherwise by a context or config control register. 0 – Auto 1 – Force On 2 – Force Off 3 – Reserved |
Sampler SRD Fields
| Field Name | RDNA3 | RDNA4 | Description |
|---|---|---|---|
| Clamp x / Clamp y / Clamp z | ✓ | ✓ | Clamp/wrap mode 0: Wrap 1: Mirror 2: ClampLastTexel 3: MirrorOnceLastTexel 4: ClampHalfBorder 5: MirrorOnceHalfBorder 6: ClampBorder 7: MirrorOnceBorder |
| Max aniso ratio | ✓ | ✓ | 0: 1:1 1: 2:1 2: 4:1 3: 8:1 4: 16:1 |
| Depth compare func | ✓ | ✓ | 0: Never 1: Less 2: Equal 3: Less than or equal 4: Greater 5: Not equal 6: Greater than or equal 7: Always |
| Force unnormalized | ✓ | ✓ | Force address cords to be unorm: 0 = address coordinates are normalized, in [0,1) 1 = address coordinates are unnormalized in the range [0,dim) |
| Aniso threshold | ✓ | ✓ | threshold under which floor(aniso ratio) determines number of samples and step size |
| Mc coord trunc | ✓ | ✓ | Enables bilinear blend fraction truncation to 1 bit for motion compensation |
| Force degamma | ✓ | ✓ | Force format to srgb if data_format allows |
| Aniso bias | ✓ | ✓ | 6 bits, in u1.5 format. |
| Trunc coord | ✓ | ✓ | Selects texel coordinate rounding or truncation |
| Disable cube wrap | ✓ | ✓ | Disables seamless cubemaps, allows cubemaps to clamp according to clamp_x and clamp_y fields |
| Filter_mode | ✓ | ✓ | 0: Blend (normal lerp/blend) 1: Min 2: Max |
| Skip degamma | ✓ | ✓ | Disabled degamma (sRGB->Linear) conversion. |
| Min lod | ✓ | ✓ | minimum LOD ins resource view space (0.0 = T#.base_level) u5.8. |
| Max lod | ✓ | ✓ | maximum LOD ins resource view space |
| Perf_mip | ✓ | ✗ | Defines range of lod fractions that snap to nearest mip only when mip_filter=Linear |
| Perf_z | ✓ | ✓ | Defines range of z fractions that snap to nearest z layer z_filter=Linear |
| Lod bias | ✓ | ✓ | LOD bias s6.8. |
| Lod bias sec | ✓ | ✓ | bias (s2.4) added to computed LOD |
| XY mag filter | ✓ | ✓ | Magnification filter 0: Point 1: Bilinear 2: Aniso Point 3: Aniso Linear |
| XY min filter | ✓ | ✓ | Minification filter 0: Point 1: Bilinear 2: Aniso Point 3: Aniso Linear |
| Z filter | ✓ | ✓ | Volume filter 0: None, use xy_min_filter or xy_mag_filter depending on LOD calculation 1: Point 2: Linear |
| Mip filter | ✓ | ✓ | Controls how mip layers are filtered 0: None (Disable mipmapping, always fetch from T#.base_level) 1: Point 2: Linear |
| Aniso_override | ✓ | ✓ | Disable aniso filtering if T#.base_level==T#.last_level |
| Blend_zero_PRT | ✓ | ✓ | MUST BE SET TO 1 For PRT fetches, blend the prt_default value for non-resident texels |
| Border color_ptr | ✓ | ✓ | index to border color space |
| Border color type | ✓ | ✓ | Opaque-black, transparent-black, white, use
border color ptr. 0: Transparent Black 1: Opaque Black 2: Opaque White 3: Register (User border color, pointed to by border_color_ptr) |
Buffer SRD Fields
| Field Name | RDNA3 | RDNA4 | Description |
|---|---|---|---|
| Base address | ✓ | ✓ | Byte address. |
| Stride | ✓ | ✓ | Bytes: 0-16383 3 (modified by Stride Scale) |
| Swizzle enable | ✓ | ✓ | Swizzle AOS according to stride,
index_stride and element_size; otherwise linear. 0: disabled 1: enabled w/ element_size == 4bytes 2: reserved 3: enabled w/ element_size == 16bytes |
| Num_records | ✓ | ✓ | In units of stride if (stride >=1), else in bytes. |
| Dst_sel_x / Dst_sel_y / Dst_sel_z / Dst_sel_w | ✓ | ✓ | Destination channel select 0=0, 1=1, 4=R, 5=G, 6=B, 7=A 2,3: RESERVED |
| Format | ✓ | ✓ | Memory data type. Used only by Untyped-buffer “FORMAT” instructions. |
| Stride scale | ✗ | ✓ | Multiply the stride field by: 0: x1; 1: x4;
2: x8; 3: x32. |
| Index stride | ✓ | ✓ | 0:8, 1:16, 2:32, or 3:64. Used for swizzled
buffer addressing. |
| Add tid enable | ✓ | ✓ | Add thread ID to the index for to calculate the address. |
| Write compression enable | ✗ | ✓ | 1 = enable write compression, 0 =
disabled |
| Compression enable | ✗ | ✓ | 0 = Bypass compression - resource is not
compressible. 1 = Don’t bypass compression |
| Compression access mode | ✗ | ✓ | 0x0 = normal 0x1 (= force_existing_data_to_decompress) 0x2 (= compressed_data_access) 0x3 (= metadata_access) |
| Llc_NoAlloc | ✓ | ✗ | 0: NOALLOC = (PTE.NOALLOC |
instruction.dlc) 1: NOALLOC = Read ? (PTE.NOALLOC | instruction.dlc) : 1 2: NOALLOC = Read ? 1 : (PTE.NOALLOC | instruction.dlc) 3: NOALLOC = 1 |
| OOB_SELECT | ✓ | ✓ | Out of bounds select. |
| Type | ✓ | ✓ | Value == 0 for buffer. Overlaps upper two
bits of four-bit TYPE field in 128-bit V# resource. |
BVH SRD Fields
| Field Name | RDNA3 | RDNA4 | Description |
|---|---|---|---|
| Base address | ✓ | ✓ | Base address of the BVH texture, 256 byte aligned. |
| Sort_triangles_first | ✗ | ✓ | 0: Pointers to triangle nodes are not
treated specially during child sorting 1: Pointers to triangle nodes (type 0 and 1 for image_bvh8, type 0,1,2,3 for all other image_bvh ops) are sorted before valid box nodes. |
| Box_sorting_heuristic | ✓ | ✓ | Specifies which heuristic should be utilized
for sorting children when box sorting is enabled. 0: Closest Traversal is ordered to enter the children that intersect the ray closer to the ray origin first. 1: LargestFirst Traversal is ordered to enter the children that have the largest interval where the box intersects the ray first. 2: ClosestMidpoint Traversal is ordered to enter the children that have a midpoint in the interval, where the box intersects that has the lowest intersection time before clamping. 3: Undefined Reserved |
| Box_grow_value | ✓ | ✓ | UINT — used to extend the MAX plane of the box intersection |
| Box_sort_en | ✓ | ✓ | boolean to enable sorting the box intersect results |
| Size | ✓ | ✓ | In units of 64 bytes. Represents the number of nodes in BVH texture minus 1. Used for bounds checking. |
| Compressed_Format_En | ✗ | ✓ | 0: Compressed format support is
disabled 1: Compressed format support is enabled. This includes enabling support for compressed primitive packets, BVH8-128B box nodes, and changes to triangle intersection test return data. |
| box_node_64B | ✗ | ✓ | 0: node type 4 is FP16 box node 1: node type 4 is 64B high precision box node |
| Wide_sort_en | ✗ | ✓ | 0: sort across 4 box children 1: sort across 8 box children |
| Instance_en | ✗ | ✓ | 0: node 6 is user node (RT 2..0) 1: node 6 is instance node |
| Pointer_flags | ✓ | ✓ | 0: Do not use pointer flags or features
supported by pointer flags 1: Utilize pointer flags to enable HW winding, back face cull, opaque/non-opaque culling and primitive type based culling |
| Triangle_return_mode | ✓ | ✓ | 0: return hit/miss with triangle test result dword[3:0] = {t_num, t_denom, triangle_id, hit_status} 1: return barycentrics with triangle test result dword[3:0] = {t_num, t_denom, I_nim, J_num} |
| LLC_NoAlloc | ✓ | ✗ | May be removed from next gen GPUs. Please
use shader instruction fields instead. 0: NOALLOC = (PTE.NOALLOC | instruction.dlc) 1: NOALLOC = Read ? (PTE.NOALLOC | instruction.dlc) : 1 2: NOALLOC = Read ? 1 : (PTE.NOALLOC | instruction.dlc) 3: NOALLOC = 1 |
| Big_Page | ✓ | ✗ | Describes resource page usage 0: No page size override 1: Indicates when a whole resource is only using pages that are >= 64KB in size. UTCL0 in RMI and TCP would have this as an input to override the initial page size allocation to 64KB |
| type | ✓ | ✓ | MSB must be set — 0x8 |