The API Trace allows you to see all the API calls made by your application in a single frame. If your application uses Direct3D markers the API Trace will use them to create a navigation tree to help you explore the trace.
API Trace Features
- Displays a time line which visually displays the start time and duration for each call made by the frame.
- Displays a per-thread sequential list of calls made to render the frame.
- Supports one-click two-way navigation between the time line and call list.
- Supports multithreaded applications, displaying a separate API trace for each thread.
- Supports saving API trace data to disk in XML or TXT format.
- Supports searching the API trace for a given string
- Two-way integration with the Frame Debugger’s draw call slider
Frame Timeline
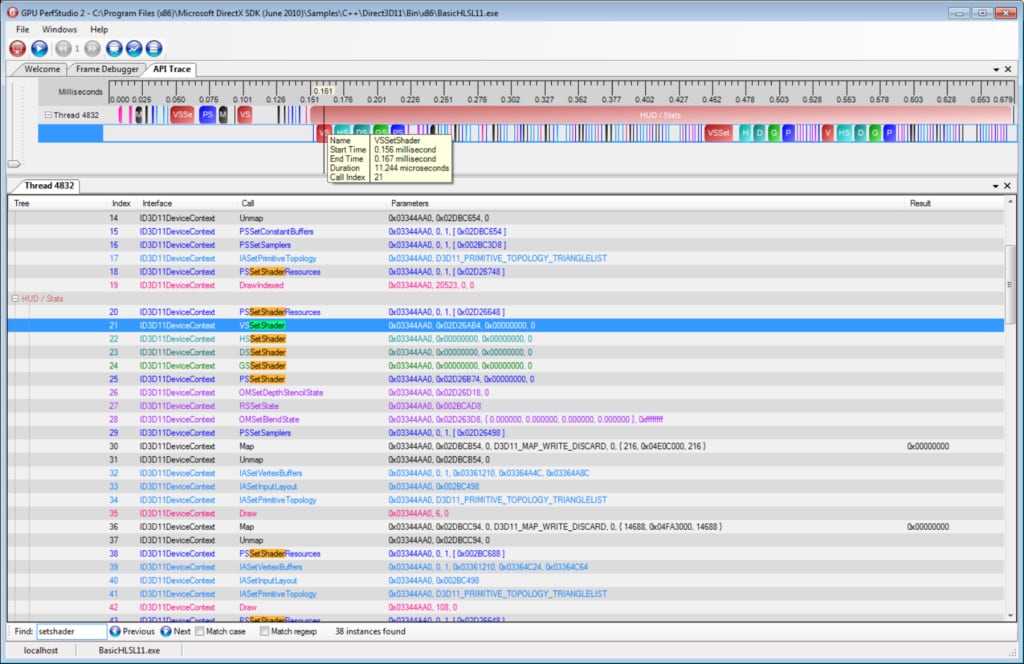
The frame timeline is displayed in the upper portion of the API Trace Window. It provides a visual representation of the function calls that are made to render the current frame. Along the top of the timeline is the time grid which shows the total elapsed time required to render the frame, in milliseconds ( 1000 milliseconds is 1 second ). Timing begins at the start of the frame and ends when the final function call is made. Directly below the time grid, each application thread that contributed to the rendering of the frame is listed. For each thread, the function calls are plotted along the time grid, showing the start time and duration of each call. Function calls are colored based on the part of the pipeline to which they are related. For Direct3D applications which use performance markers or deferred contexts, the timeline will show the performance markers and command lists in one row, while the actual calls that are wrapped by the performance marker or command list will be shown in the row directly below.
Navigating the Frame Timeline
The frame timeline supports zooming, navigating and expanding/collapsing, providing many ways to view and analyze the API trace.
Zooming
When first opened, the timeline view is fully zoomed out, so that the entire frame timeline is visible in the timeline. It can be useful to zoom in to specific parts of the timeline in order to better understand the frame timeline data. As you zoom in and out, the time grid at the top changes to display the timestamp of the currently displayed timeline subsection.
- Manual zoom – To manually zoom in and out, use the vertical trackbar located along the left side of the timeline. The current zoom pivot point (displayed as a vertical line over the entire timeline) represents the point in the timeline into which the view will be zoomed. You can change the location of the zoom pivot point by clicking anywhere within the timeline. You can also use the mouse wheel to manually zoom in and out.
- Zoom into specific function call – To zoom into a particular function call, you can double click the function call in the API Trace list.
- Zoom into specified region – To zoom into a specific region of the timeline, hold down the Control key and drag the mouse to highlight a specific region. When you release the mouse button, the timeline will be zoomed into the highlighted region.
- Zoom into specific block – To zoom into a particular block shown in the timeline, hold down the Control key on the keyboard and right click on a block.
Navigation
When the timeline is zoomed in, you can navigate to different parts of the timeline. You can use either the horizontal scrollbar located along the bottom of the timeline, or you can click and drag the mouse to pan the timeline within the viewable area. To quickly move to a particular call within the timeline, you can click that function call in the API Trace list. This will move the current zoom pivot point to the selected function’s timeline block and, if necessary, pan the timeline to scroll that block into view.
Expanding and Collapsing the timeline tree
When the timeline is first displayed, its tree is fully expanded. It may be useful to collapse parts of the tree in order to limit the amount of data shown. Use the treeview controls within the timeline to collapse or expand parts of the timeline tree.
Viewing timeline item details
There are several ways to view more information about items shown in the timeline view.
- Tooltip hints – Hover the mouse over a block shown in the timeline, and a tooltip hint will appear giving additional details about that block.
- Navigating to the API trace – Click any function block in the timeline, and that block’s corresponding function will be selected in the API Trace, where additional details for that particular function call will be shown.
Frame API Trace
The frame API trace is displayed in the lower portion of the API Trace Window. It provides a list of the function calls that are made to render the current frame. Each application thread that contributed the rendering of the frame is listed in a separate tab. Each tab contains a list of all the function calls made by that particular thread.
For each function call the following information is shown:
- Index – indicates the order in which the function calls were made
- Interface – the interface or structure from which the function call is made
- Call – the name of the function
- Parameters – the parameters passed into the function
- Result – the value returned by the function call
To aid in identifying and distinguishing between function calls, they are colored based on the part of the pipeline to which they are related.
If you enable the D3D debug runtime, the debug runtime messages will also appear in the API Trace under the function call that generated the messages.
- You can enable the debug runtime using the GPU PerfServer command line options or by adding the D3D10_CREATE_DEVICE_DEBUG or D3D11_CREATE_DEVICE_DEBUG flag when you create the device.
For OpenGL functions that fail, additional error information will be shown in the API Trace directly under the function call that failed.
If an application uses Direct3D performance markers or deferred contexts, the Tree column will display a tree structure where the tree nodes represent the performance marker or command list. You can expand the tree node in order to see the function calls that are wrapped by the performance marker or the command list.
You can search for text in the API trace using the Find controls located below the API list. Enter the text you want to search for in the search box, and the API Trace will automatically start searching for that text. Once the search is complete, the number of matches found will be displayed and each match will be highlighted within the API trace. You can navigate to the next match found by either clicking the “Next” button or pressing the “Enter” key. You can navigate to the previous match found by either clicking the “Previous” button or pressing “Shift-Enter” on the keyboard. You can also specify if you want to do a case-sensitive search or if you want to use a regular expression in the search text.
Multithreaded Applications
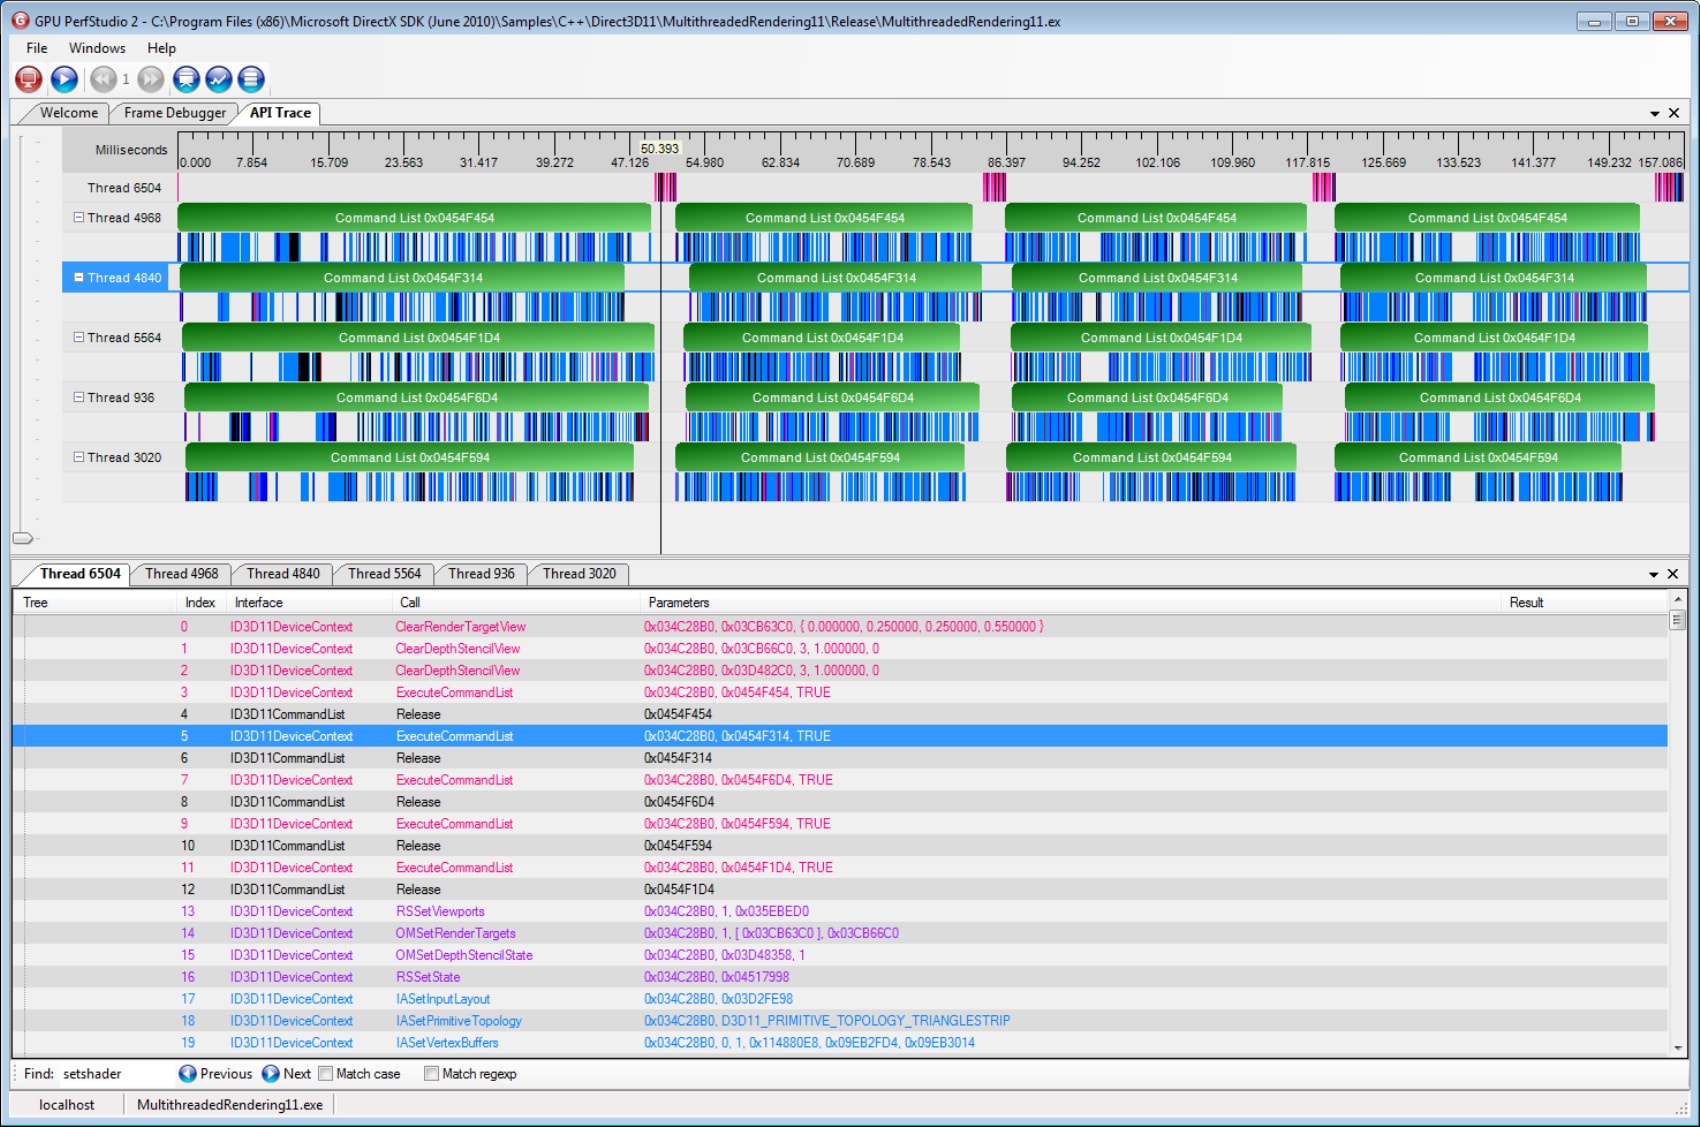
In multithreaded applications, the API trace displays the timing data for each thread. See the screenshot below, and note that there is a row in the timeline and an API trace tab for each thread.
Note the following:
How this application uses 5 worker threads to build up command lists that are then executed by the main thread.
How the main thread waits for the 5 worker threads to build up the command lists and then executes the 5 command lists sequentially.
How the calls that make up a command list are displayed in the timeline under a green block that represents the command list.
Saving the API Trace data
- The API Trace data can be saved by using the File->Save As option in the main File menu.
- It can be saved as a CSV file or as a TXT file.
- The data cannot be loaded back into the API Trace window.
Two-way integration with the Frame Debugger
- When you change the selected draw call in the frame debugger, the API Trace view will automatically display the selected draw call in the frame timeline, and select the draw call in the frame API trace.
- When you click on a function block in the frame timeline, the frame debugger will automatically select the corresponding draw call (or the previous draw call if the selected function block does not represent a draw call).
- When you select a draw call in the frame API trace, the frame debugger will automatically make that draw call the selected draw call.
- Note that the two-way integration with the frame debugger only works for draw calls made by the application’s main thread. You can use the Flatten CommandLists option on the Settings dialog to use the two-way integration with draw calls that occur on other threads.