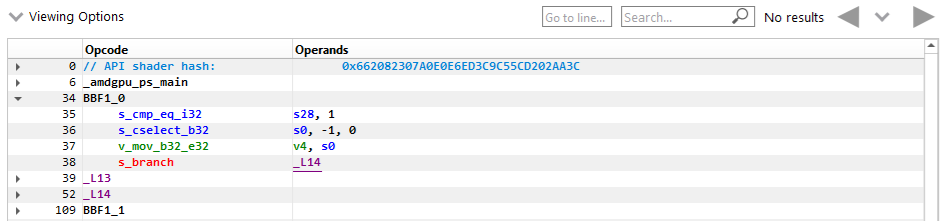
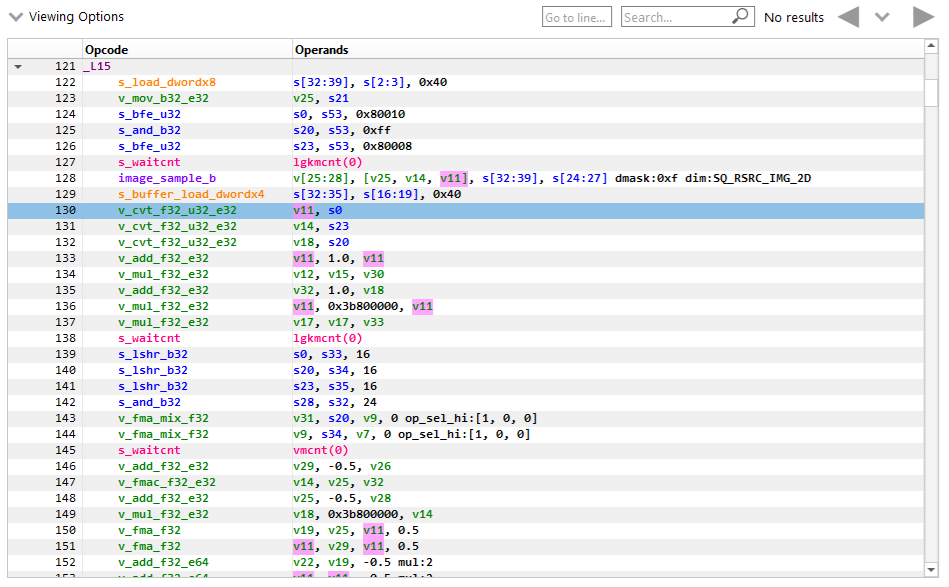
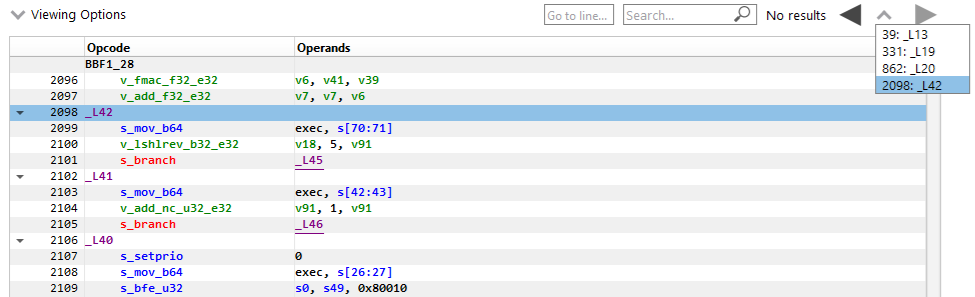
ISA View

Several views in RGP display ISA for API shader stages. ISA is displayed for a single shader stage at a time using the same color coding scheme and tree structure.

ISA views appear in the Pipeline state pane and in the Instruction timing pane.

_images/rgp_isa_view_1.png

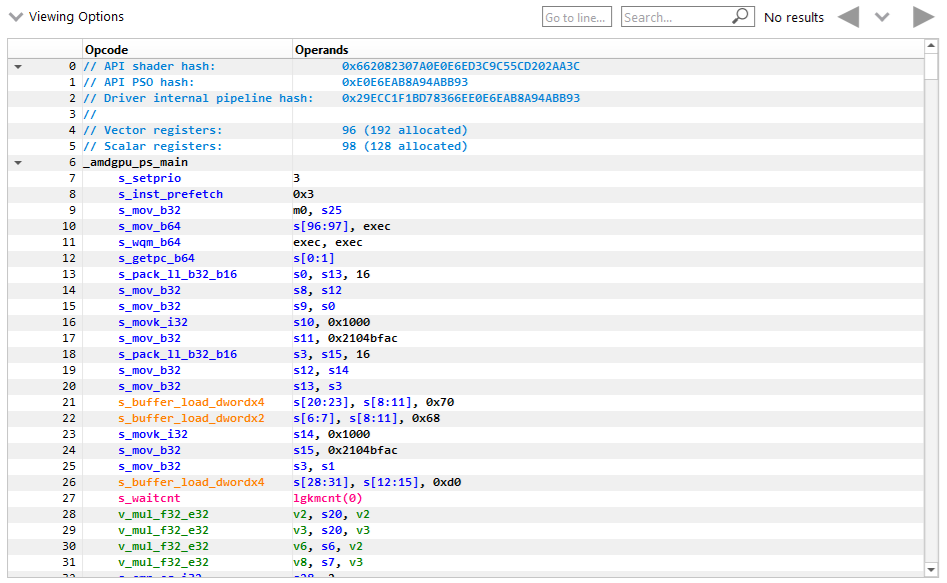
Basic blocks can be expanded and collapsed individually or all at once. To expand or collapse a single block, click on the arrow on the left side of the instruction line. To expand or collapse all blocks in a shader at once, use the (Ctrl + Right) or (Ctrl + Left) shortcut, respectively.

_images/rgp_isa_view_blocks_collapsed.png

Tokens can be selected and highlighted to see other instances of the selected token (instruction opcodes, registers and constants).

_images/rgp_isa_view_token_selected_and_highlighted.png

Basic blocks referenced by a branch instruction(s) can be clicked to scroll to the branch instruction(s). Similarly, the block referenced in the branch instruction can be clicked to scroll to the block. Branch navigations are recorded and can be replayed using the navigation history.

_images/rgp_isa_view_branch_navigation_history.png

Columns can be customized by using the Viewing Options dropdown to show or hide them. They can also be rearranged by clicking on the column header and dragging them to a new location.

_images/rgp_isa_view_customize_columns.png

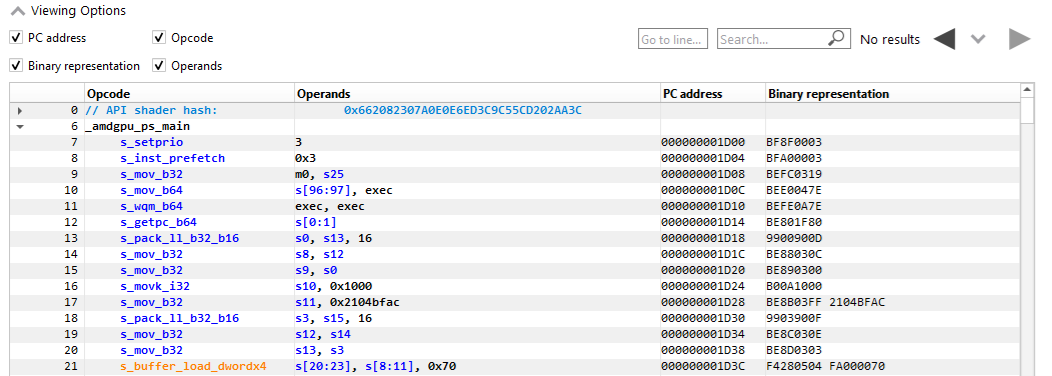
Text in any column can be searched for and the developer can navigate directly to a specific line using the controls displayed below.

_images/rgp_instruction_timing_find.png

Both the Search command (Ctrl + F) and the Go to line command (Ctrl + G) can be invoked using keystrokes.

Text in the isa viewer that matches the current search text is highlighted. The vertical scroll bar will also indicate the location of all matches, giving you a visual indicator of where in the shader the various matches can be found.

_images/rgp_isa_view_search_results.png

Hovering the mouse over opcodes will show a tooltip with the opcode’s explanation, after a short delay.

_images/rgp_isa_view_tooltip.png

The display of line numbers can be toggled using a keyboard shortcut (Ctrl + Alt + L).

Related pages

  • Visit the RGP product page for download links and more information.

Looking for more documentation on GPUOpen?

AMD GPUOpen software blogs

Our handy software release blogs will help you make good use of our tools, SDKs, and effects, as well as sharing the latest features with new releases.

GPUOpen Manuals

Don’t miss our manual documentation! And if slide decks are what you’re after, you’ll find 100+ of our finest presentations here.

AMD GPUOpen Performance Guides

The home of great performance and optimization advice for AMD RDNA™ 2 GPUs, AMD Ryzen™ CPUs, and so much more.

Getting started: AMD GPUOpen software

New or fairly new to AMD’s tools, libraries, and effects? This is the best place to get started on GPUOpen!

AMD GPUOpen Getting Started Development and Performance

Looking for tips on getting started with developing and/or optimizing your game, whether on AMD hardware or generally? We’ve got you covered!

AMD GPUOpen Technical blogs

Browse our technical blogs, and find valuable advice on developing with AMD hardware, ray tracing, Vulkan®, DirectX®, Unreal Engine, and lots more.

Find out more about our software!

AMD GPUOpen Effects - AMD FidelityFX technologies

Create wonder. No black boxes. Meet the AMD FidelityFX SDK!

AMD GPUOpen Samples

Browse all our useful samples. Perfect for when you’re needing to get started, want to integrate one of our libraries, and much more.

AMD GPUOpen developer SDKs

Discover what our SDK technologies can offer you. Query hardware or software, manage memory, create rendering applications or machine learning, and much more!

AMD GPUOpen Developer Tools

Analyze, Optimize, Profile, Benchmark. We provide you with the developer tools you need to make sure your game is the best it can be!