Radeon GPU Profiler - Quick Start
How to generate a profile
The first thing you will need to do is generate a profile. Currently, this is done via the Radeon Developer Panel. Read the documentation provided with this distribution for information on how to capture a profile. This can be obtained from within the Radeon Developer Panel or at: https://gpuopen.com/manuals/rdp_manual/
Starting the Radeon GPU Profiler
The following executables can be found in the download directory.
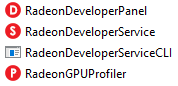
Start RadeonGPUProfiler.exe (this is the tool used to view profile data).
How to load a profile
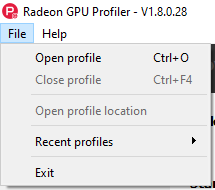
There are a few ways to load a profile into RGP.
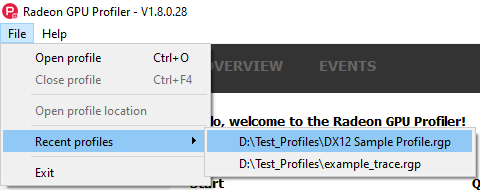
- Use the “File/Open profile” pull down menu item, or the “File/Recent profiles” pull down menu item.
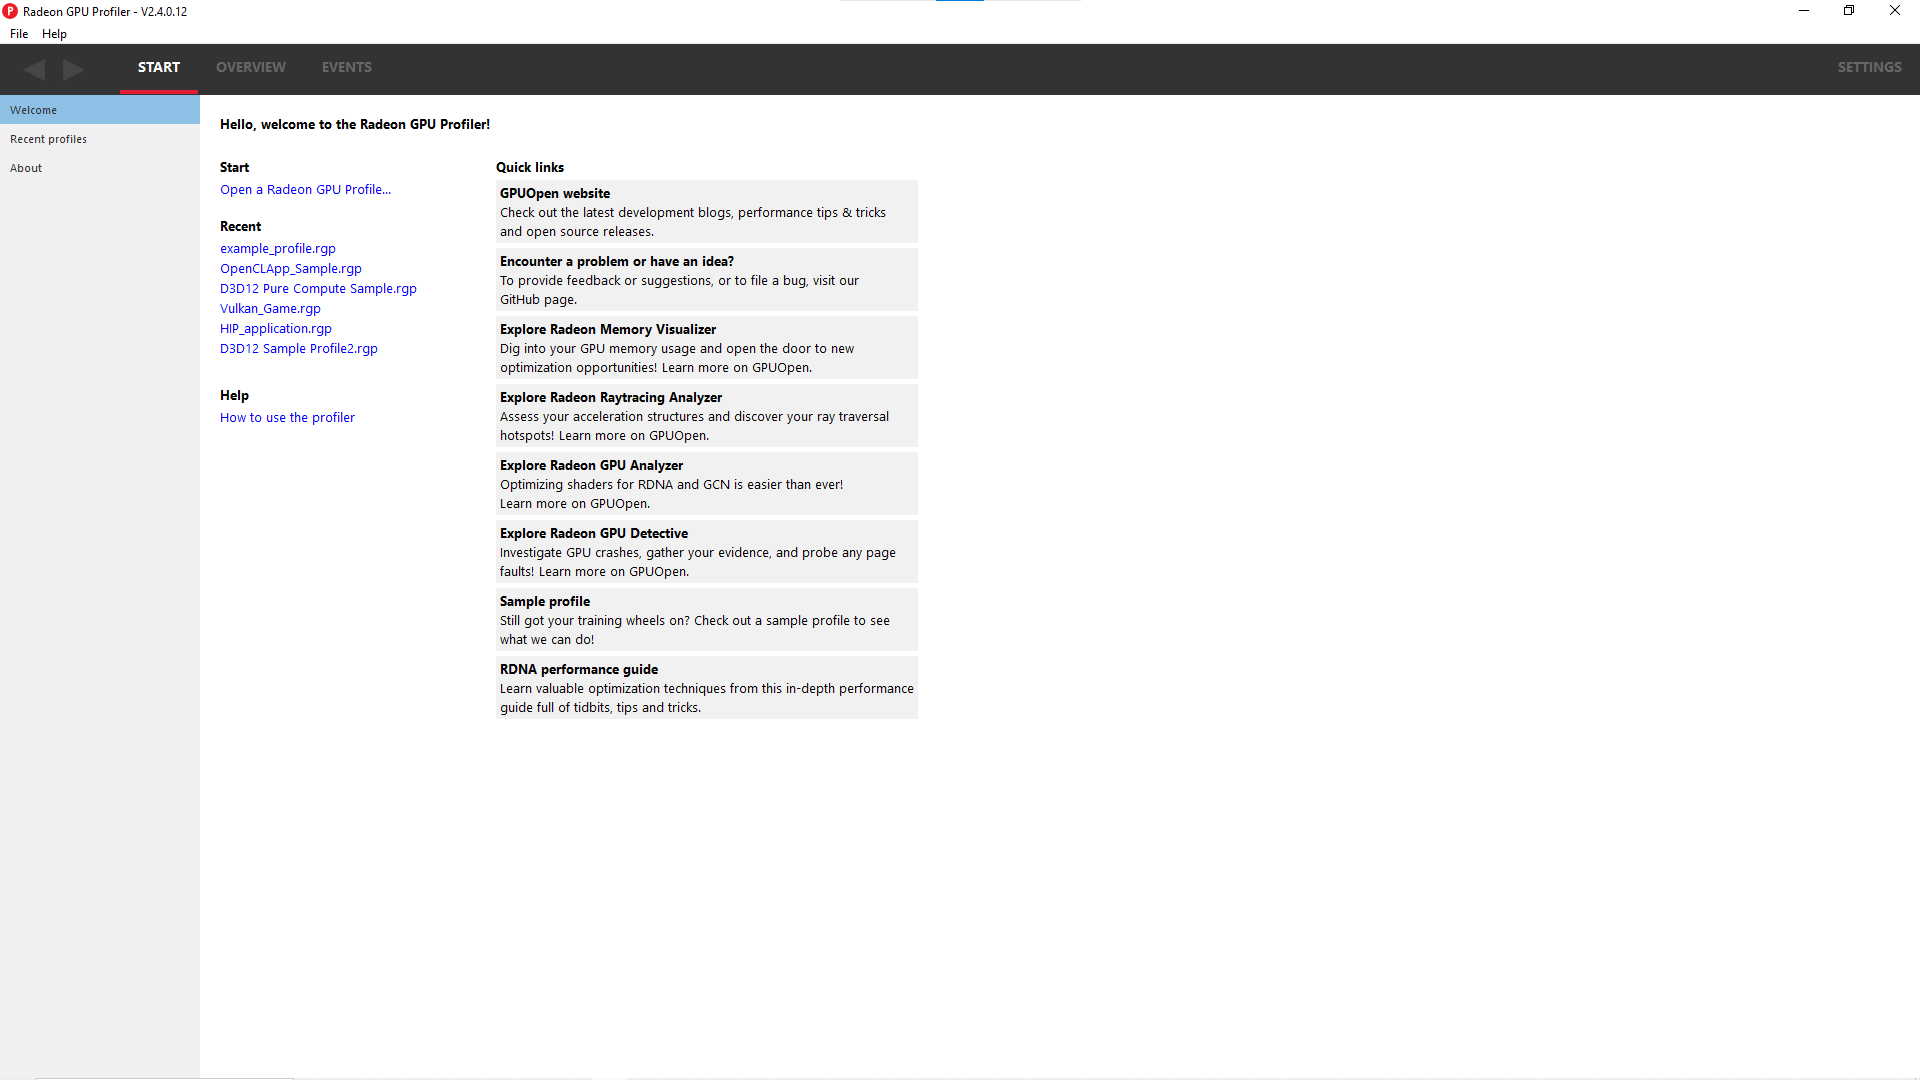
- Go to the “Welcome” view and click on the “Open a Radeon GPU Profile…” link.
- Go to the “Welcome” view and click on a profile that you have previously loaded in the Recent list.
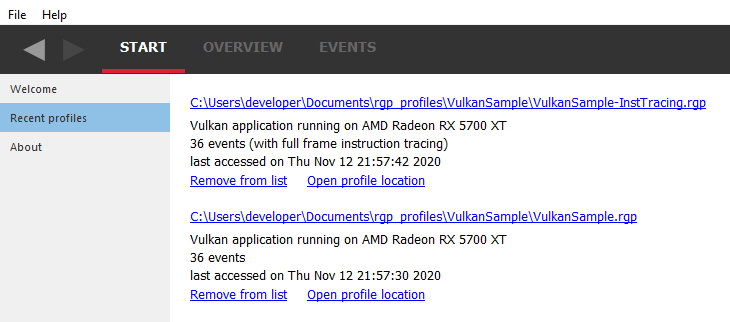
- Go to the Recent profiles view to see a full list of all your recent profiles. Notice that there is additional information provided for each profile when viewed in this pane, such as the GPU the profile was taken on, the date when the capture was performed and the number of events contained in the profile.
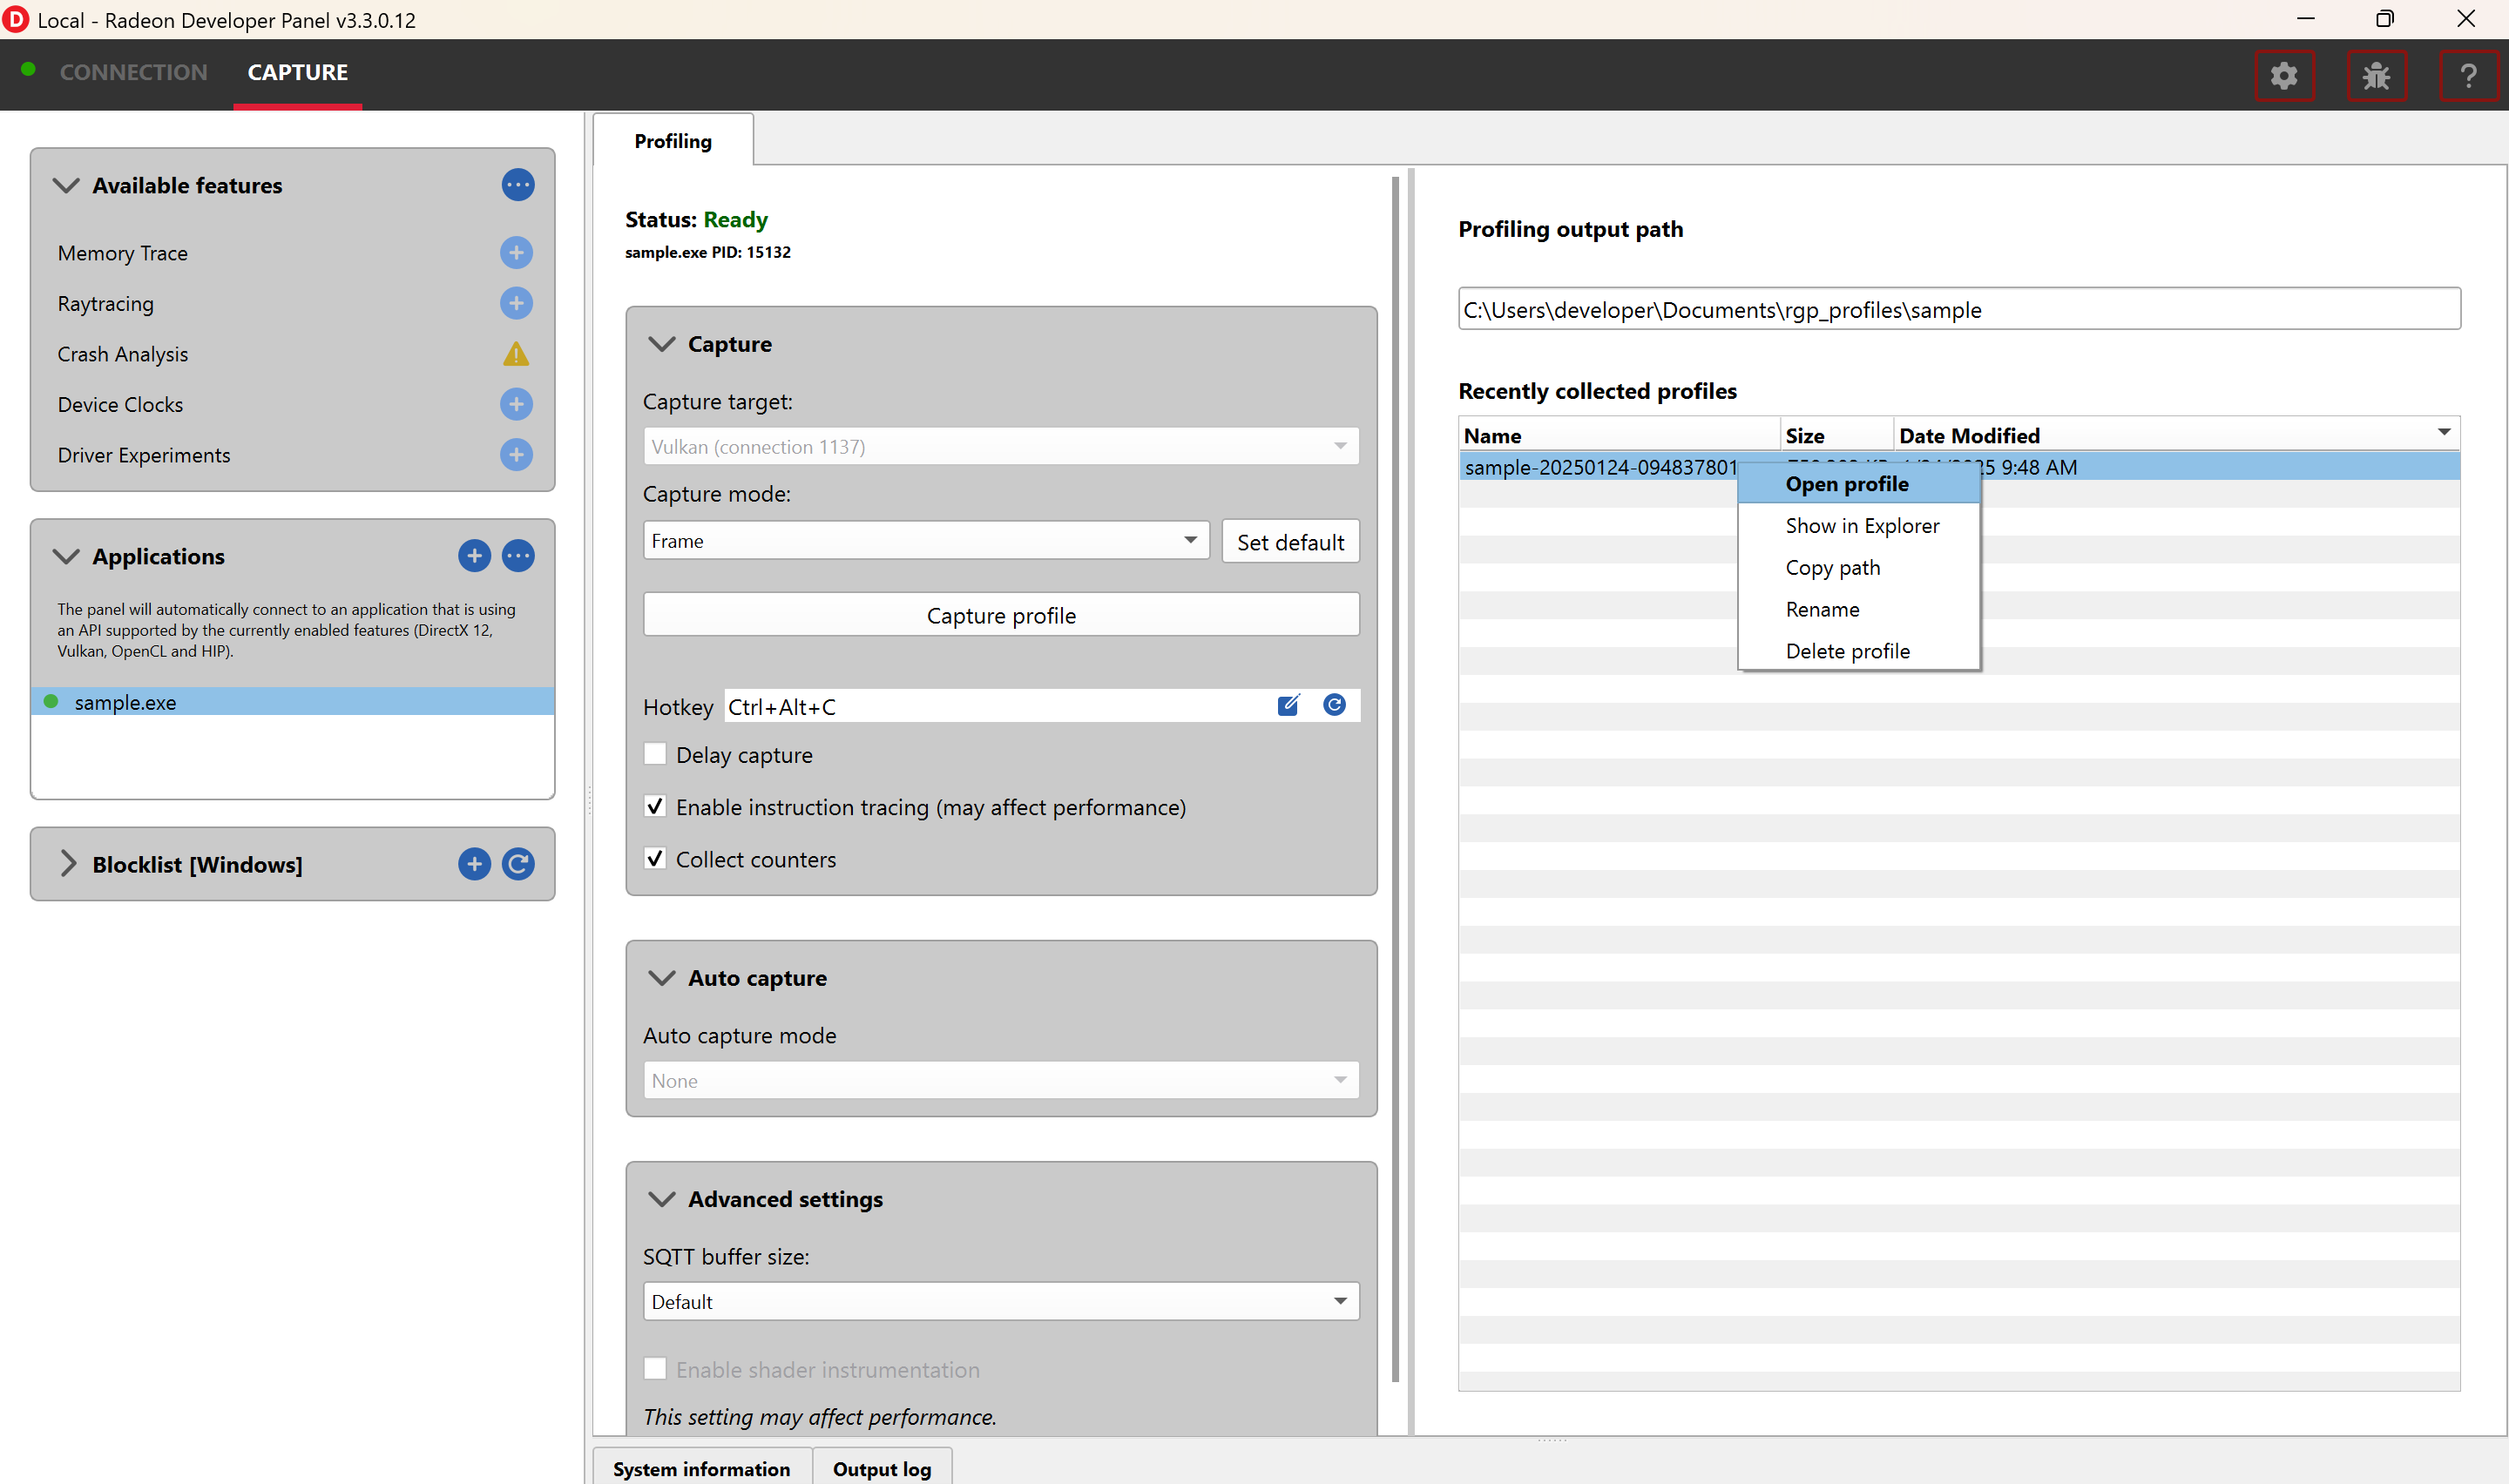
- Load a profile into a new instance of the Radeon GPU Profiler from the Radeon Developer Panel. Select a profile in the list and click on “Open profile”.
- Drag and drop a profile onto the Radeon GPU Profiler executable, or onto an already open RGP instance.
The Radeon GPU Profiler user interface
There are four main menus in the Radeon GPU Profiler and each has a number of sub-windows. The two main UIs that deal with the analysis of the profile data are within the Overview and Events sections.
- Start
- Welcome - Shows links to help documentation, and a list of recently opened profiles, and a sample profile.
- Recent profiles - Displays a list of the recently opened profiles.
- About - Shows build information about RGP and useful links.
- Overview
- Frame Summary - Contains a summary of the structure of the graphics frame. This overview section is not available for OpenCL or HIP profiles, or other non frame-based profiles.
- Profile Summary - Contains a summary of the structure of the OpenCL, HIP, or other non frame-based profiles.
- Barriers - Details of the barrier usage in the profile.
- Context rolls - Details of the hardware context register usage. This overview section is not available for OpenCL or HIP profiles or pure-compute DirectX and Vulkan profiles.
- Most expensive events - List of the most expensive events.
- Render/depth targets - Overview of render targets used throughout the graphics frame. This overview section is not available for OpenCL or HIP profiles or pure-compute DirectX and Vulkan profiles.
- Pipelines - Details of the pipeline usage in the profile.
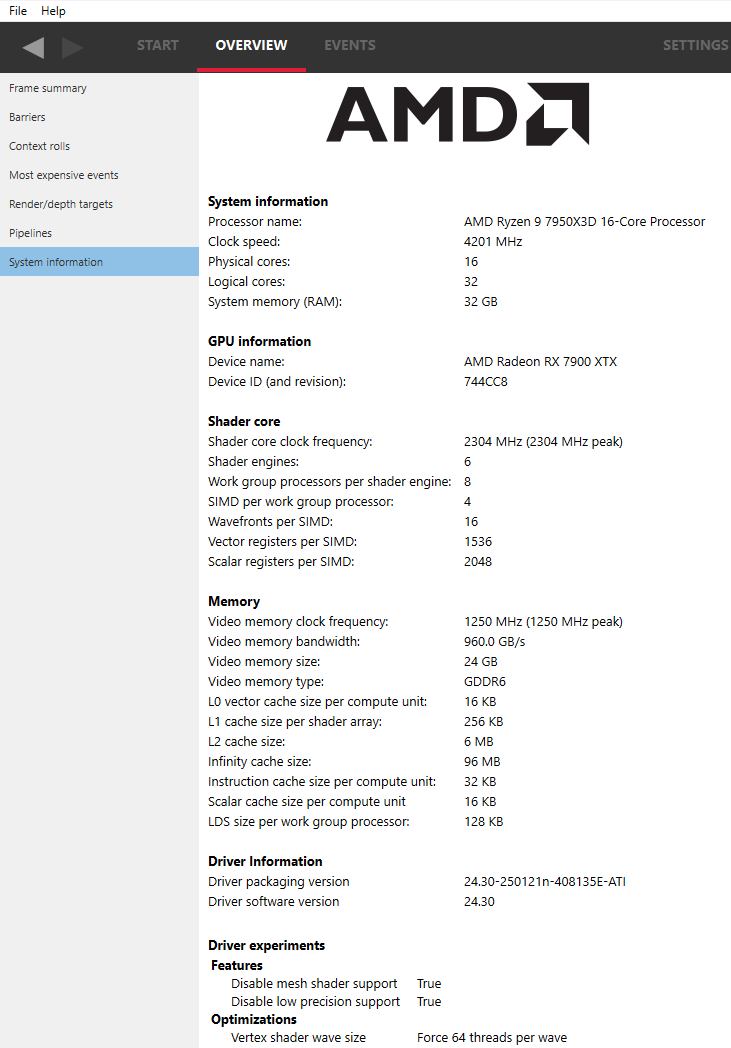
- System information - Information about the GPU the profile was generated on.
- Events
- Wavefront occupancy - Shows detailed information about wavefront occupancy and event timings.
- Event timing - Tree view of profile events and their timing data.
- Pipeline state - Tree view of profile events and their graphics/compute pipeline state.
- Instruction timing - Shows detailed instruction timing information for each instruction of a single shader.
- Settings
- General - Adjust desired time units, state buckets, GPU boundness percentage, and wavefront view detail levels.
- Themes and colors - Customize colors for graphics API and hardware data.
- Keyboard shortcuts - Shortcuts for navigating various parts of the UI.
Driver experiments
Driver experiments can be configured when capturing a profile and allow the behavior of certain driver operations to be adjusted. Please see the Radeon Developer Panel documentation for more details on configuring Driver experiments. Modified Driver experiments included in a profile will be listed on the System information pane under the section labeled Driver experiments.
When a profile that includes Driver experiments is loaded, a notification banner is displayed below the main drop down menu.
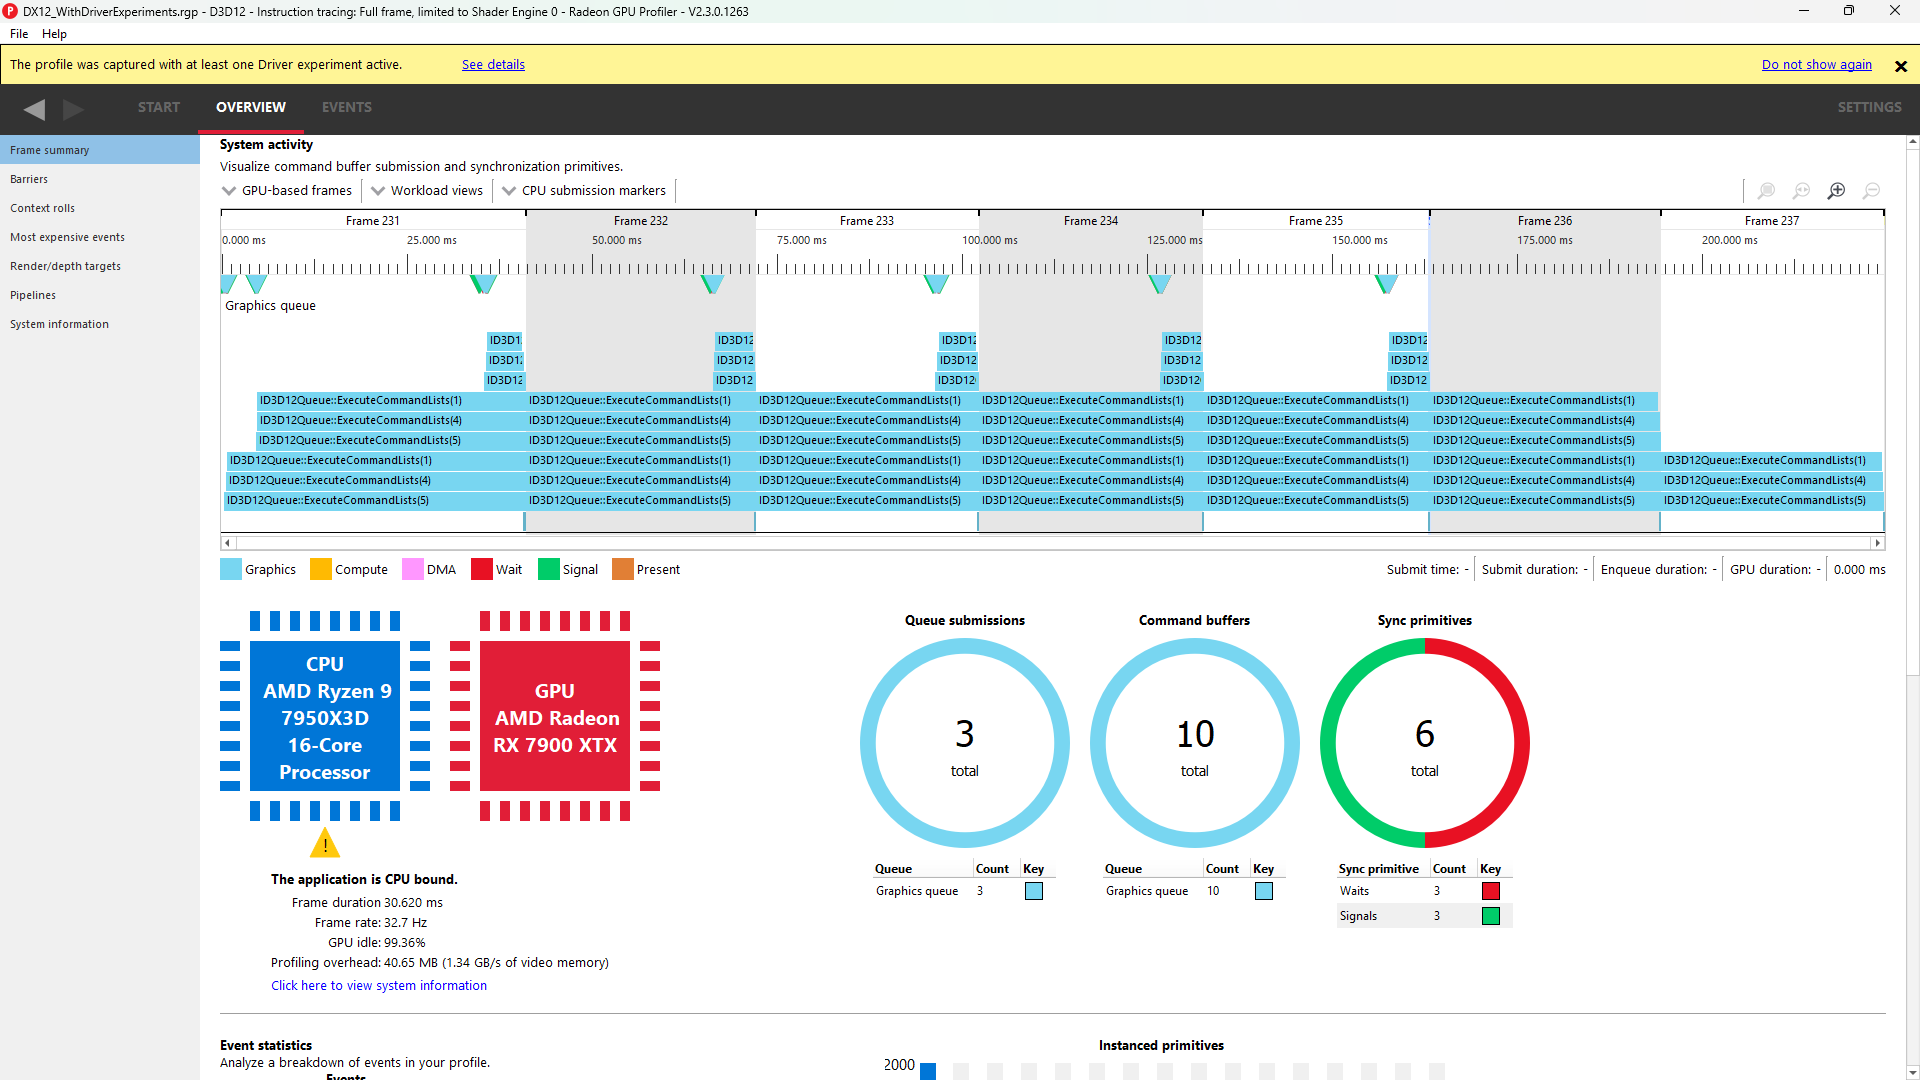
The notification banner includes a “See details” shortcut link that navigates to the System information pane. The banner can be dismissed by clicking the “X” button. Clicking the “Do not show again” link prevents the banner from being shown for subsequently loaded trace files. The notification banner can be re-enabled from the Settings pane.