The Frame Debugger gives you access to the drawcalls within your application and allows you to view their states and resources. It is possible to pause your application on any given frame and analyze the elements
that make up the current frame buffer image. The user may scrub through the draw calls to locate the draw call of interest. The Frame Debugger specializes in viewing the active state for any draw call in a frame
and has specialized data viewers for image and description based data. Each data viewer is a dockable window that can be placed and resized by the user to make custom layouts that can be saved and reloaded.
What’s new?
- PerfMarker View
- A new tree control has been added to the Frame Debugger for easy viewing and navigation of Direct3D performance markers (D3DPERF_BeginEvent and D3DPERF_EndEvent).
- It displays perfmarker blocks as nested tree items making it easy to navigate the frame based on the structure of your perfmarkers
- Individual draw calls within the perfmarker blocks are shown by default and can be turned off if required
- GPU Time for the perfmarker blocks and individual draw calls can be displayed
- Rows can be ordered by draw call index
- Rows can also be ordered by GPU Time to identify the most expensive perfmarker blocks and draw calls
- The perfmarkers can be expanded and collapsed by using the right click context menu
- A Perfmarker block or an individual draw call can be re-profiled on demand
-
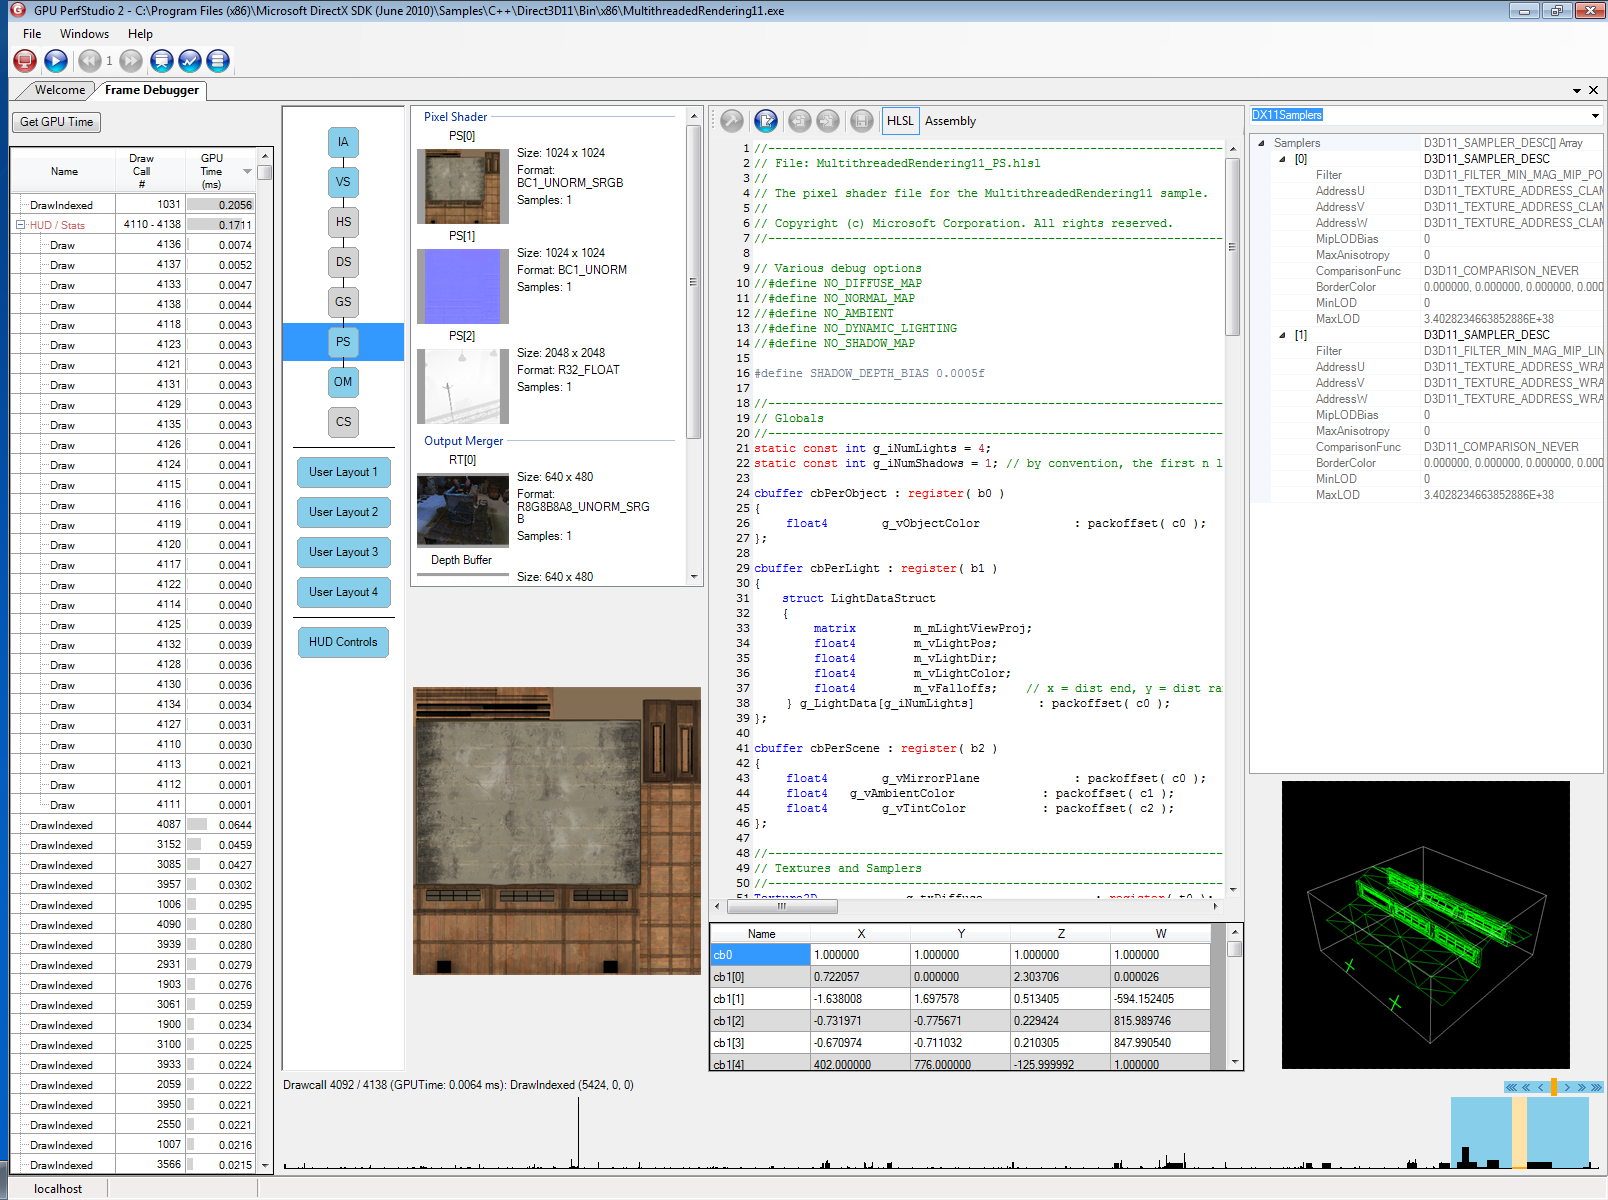
Pipeline Stage View
- To the right of the PerfMarker View is a control that opens a layout for each stage of the graphics pipeline.
- Each layout gives the user access to the resources used in the currently selected draw call.
- The icons for each stage indicate if it is in use at the current draw call – blue is active.
- Clicking a stage will open the associated layout in the Content Pane.
- Layouts can be edited and saved by the user to create custom layouts.
- The image below shows a DX11 application with the pixel shader stage selected.
-
Image Resource Thumbnail Viewer
- The above image shows the new image resource viewer.
- Thumbnails of images relevant to the selected stage are included by default.
- The user can edit which images are included in the viewer.
- Clicking on a thumbnail will open it in the larger image window at the bottom.
- Double-clicking will open the image in a large modal image viewer.
-
Image based data includes:
- RenderTargets
- Textures
- Swapchain
- Depth buffer
- Stencil buffer
- Input geometry
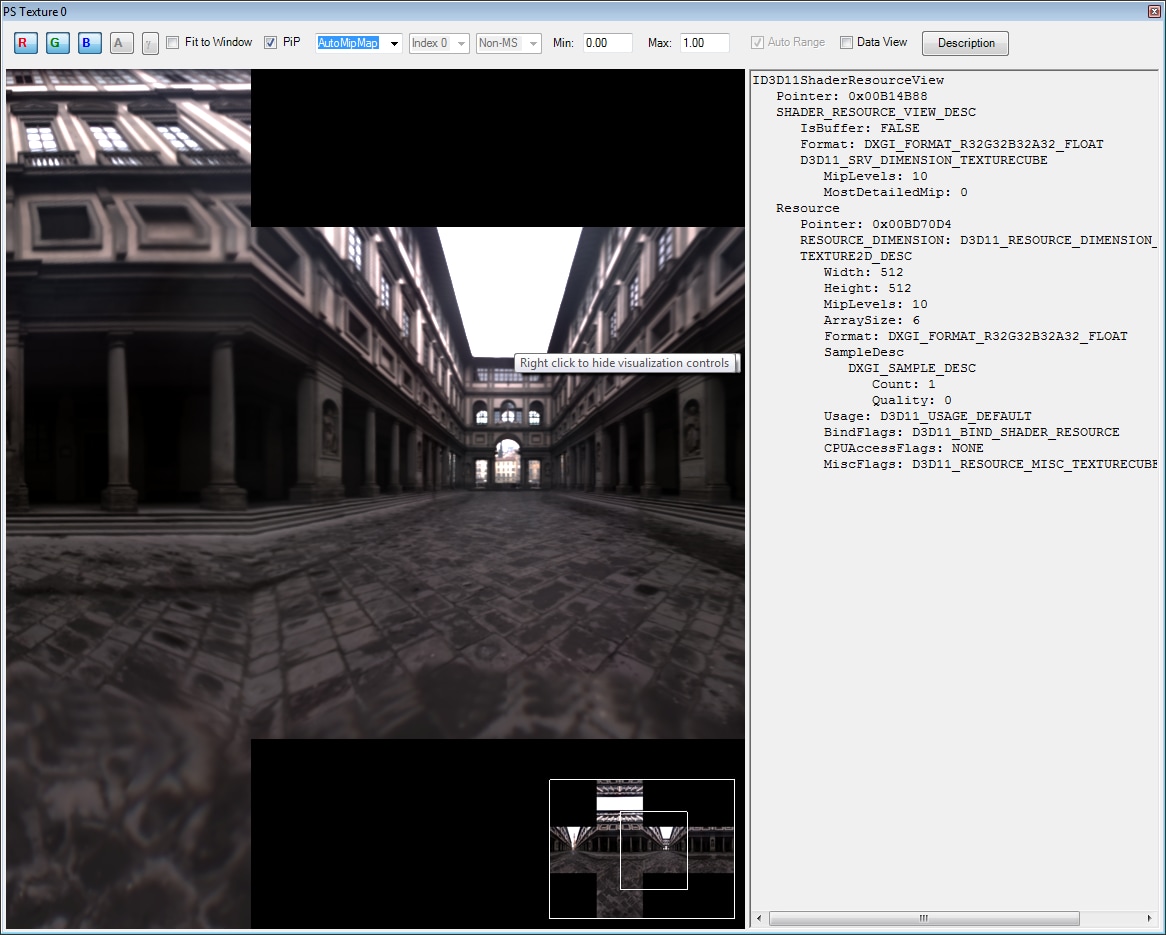
Screen shot of the texture viewer showing the resource and resource view information. Users can select the mipmap level and index of the cube array to be displayed, zoom and pan around the image.
- Index and Vertex Buffer layout
- The Index and Vertex Buffer Window allows you to see information about the geometry being passed into the graphics pipeline.
- Input Topology – Indicates the way the index buffer is interpreted by the pipeline and how the primitives are assembled.
- Index Buffer – Shows the values contained within the index buffer. Offsets and counts that are specified by the draw calls will be reflected in the starting index of the table and the number of
elements it contains. - Vertex Buffer – Shows the values of each component of the input elements.
- Input Elements – Contains a list of input elements that are specified by the application. Selecting an item in this list will cause its description to be shown in the textbox to the right.

Above is a screen shot of the DX11 Input Assembly layout showing the Index and Vertex buffer contents, topology and input layout information.
Draw Call Slider
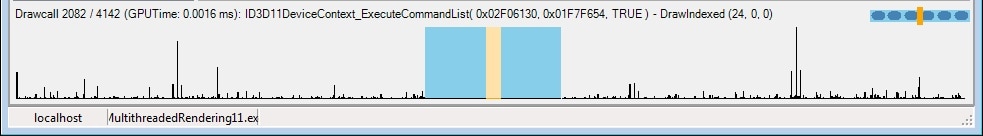
Located along the bottom of the window is a bar graph / slider that allows you to select which draw call you are investigating and immediately identify how costly it is compared to other draw calls. The height of
the bar represents the relative time that the draw call took to execute relative to the most expensive draw call in the current frame. The vertical orange bar represents the currently selected draw call and the
blue region around it shows a magnified view of the draw calls on either side of the selected call. The heights of the bars do not change, but they do become wider. Clicking anywhere on the bar graph area will
change the selected draw call. Clicking in the blue zoomed area allows easy selection of the next or previous draw call. You can also click and drag the orange bar to continually change the selected draw call
and get a quick understanding of how the application is rendering.
The small blue area to the top right of the bar graph can also be used to smoothly scroll through the frame. Move the orange bar a little to increase / decrease the selected draw call by one; the further the
orange bar is moved from the center, the faster the slider moves through the frame.