GPUPerfAPI
GPUPerfAPI provides access to GPU Performance Counters. It analyzes performance and execution characteristics of applications using a Radeon™ GPU.
In Dyson Sphere Program, you step into the role of an engineer piloting the mech “Icarus,” starting from scratch in a procedurally generated universe. By gathering resources, building production lines, and researching technologies, players gradually piece together an interstellar industrial empire. In the late game, with hundreds of planets, tens of thousands of facilities, and hundreds of thousands of items flying around, every frame is backed by a staggering amount of CPU computation happening quietly behind the scenes.
As the game’s features grow and the system becomes more complex, we’ve increasingly felt that our current performance ceiling is getting uncomfortably close. If we implement the logistics-vehicle system in the future, the game could easily add thousands of components requiring physics simulation — something our current architecture simply can’t handle efficiently.
![]()
Let’s briefly cover some multithreading basics, why Dyson Sphere Program (DSP) uses it, and why we’re rebuilding the system.
Take the production cycle of an Assembler as an example. Ignoring logistics, its logic can be broken into three phases:
Individually, these calculations are trivial — each Assembler might only take a few hundred to a few thousand nanoseconds. But scale this up to tens or hundreds of thousands of Assemblers in late-game saves, and suddenly the processor could be stuck processing them sequentially for milliseconds, tanking your frame rate.
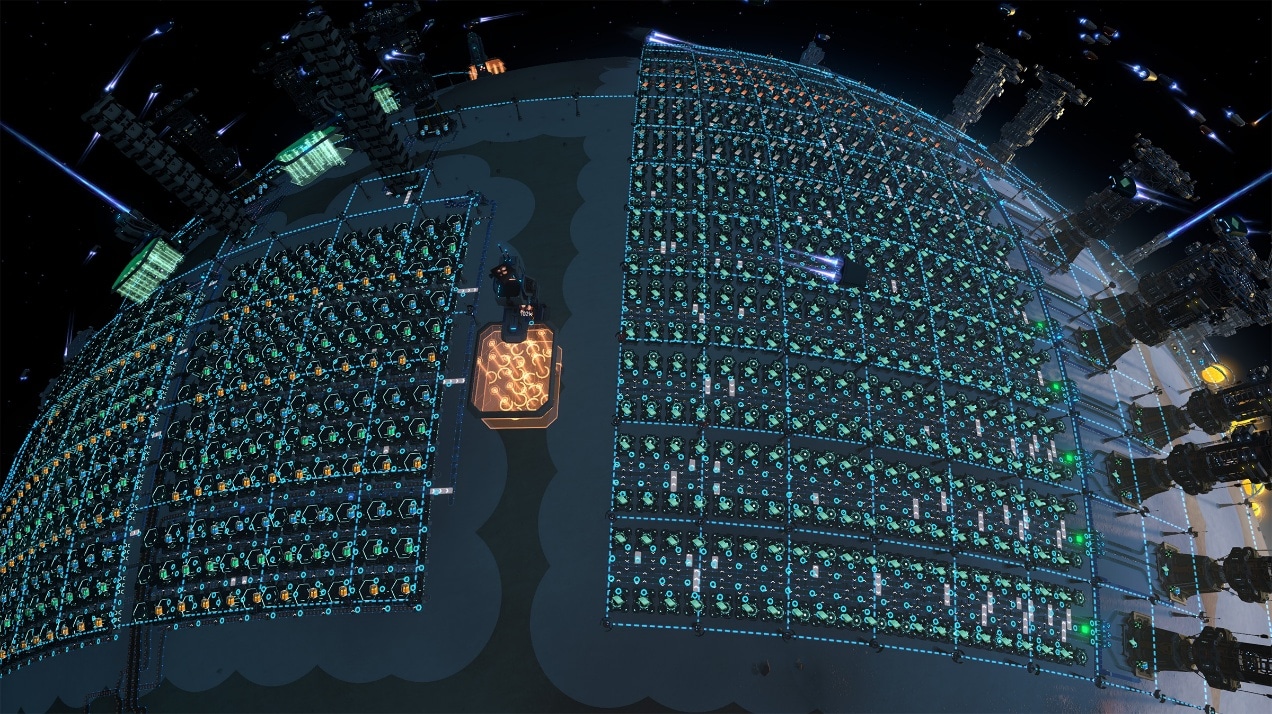 This sea of Assemblers runs smoothly thanks to relentless optimization.
Luckily, most modern CPUs have multiple cores, allowing them to perform calculations in parallel. If your CPU has eight cores and you split the workload evenly, each core does less, reducing the overall time needed.
But here’s the catch: not every Assembler takes the same time to process. Differences in core performance, background tasks, and OS scheduling mean threads rarely finish together — you’re always waiting on the slowest one. So, even with 8 cores, you won’t get an 8x speedup.
So, next stop: wizard mode.
Okay, jokes aside. Let’s get real about multithreading’s challenges. When multiple CPU cores work in parallel, you inevitably run into issues like memory constraints, shared data contention, false sharing, and scheduling overhead, especially around synchronization points. For instance, when multiple threads need to read or modify the same data, a communication mechanism must be introduced to ensure data integrity. This mechanism not only adds overhead but also forces one thread to wait for another to finish.
There are also timing dependencies to deal with. Let’s go back to the three-stage Assembler example. Before Stage 2 (grid load calculation) can run, all Assemblers must complete Stage 1 (power demand update) — otherwise, the grid could be working with outdated data from the previous frame.
To address this, DSP’s multithreading system breaks each game frame’s logic into multiple stages, separating out the heavy workloads. We then identify which stages are order-independent. For example, when Assemblers calculate their own power demand for the current frame, the result doesn’t depend on the power demand of other buildings. That means we can safely run these calculations in parallel across multiple threads.

Our old multithreading system was, frankly, showing its age. Its execution efficiency was mediocre at best, and its design made it difficult to schedule a variety of multithreaded tasks. Every multithreaded stage came with a heavy synchronization cost. As the game evolved and added more complex content, the logic workload per frame steadily increased. Converting any single logic block to multithreaded processing often brought marginal performance gains — and greatly increased code maintenance difficulty.
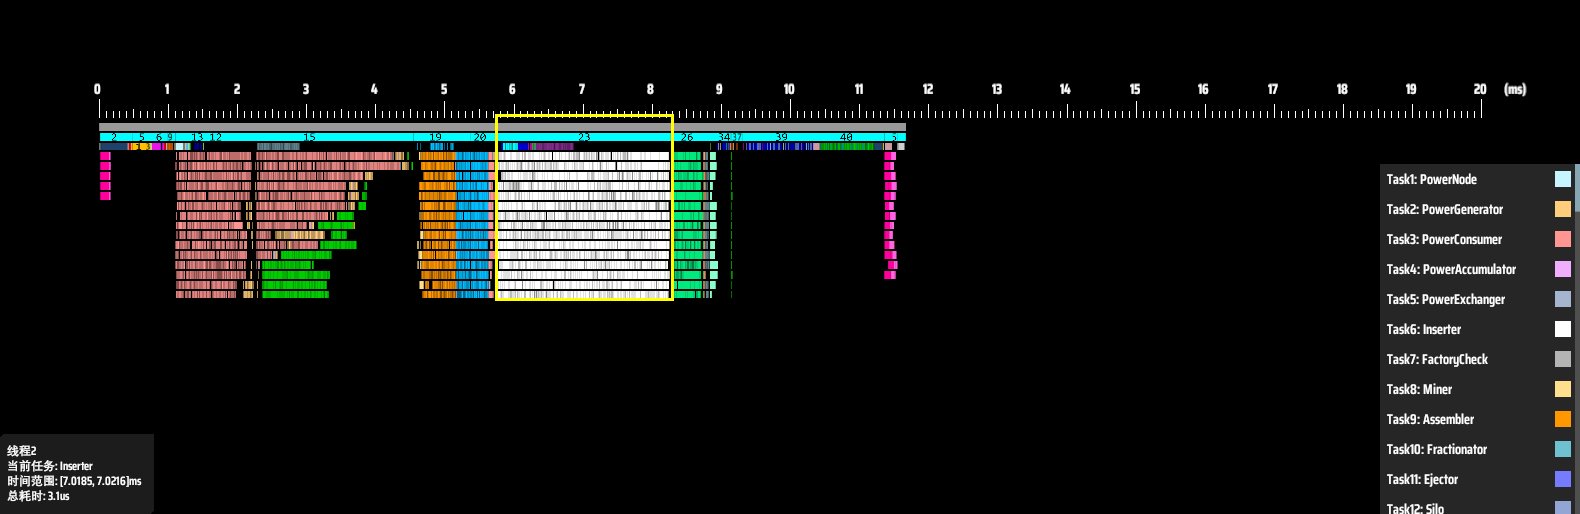
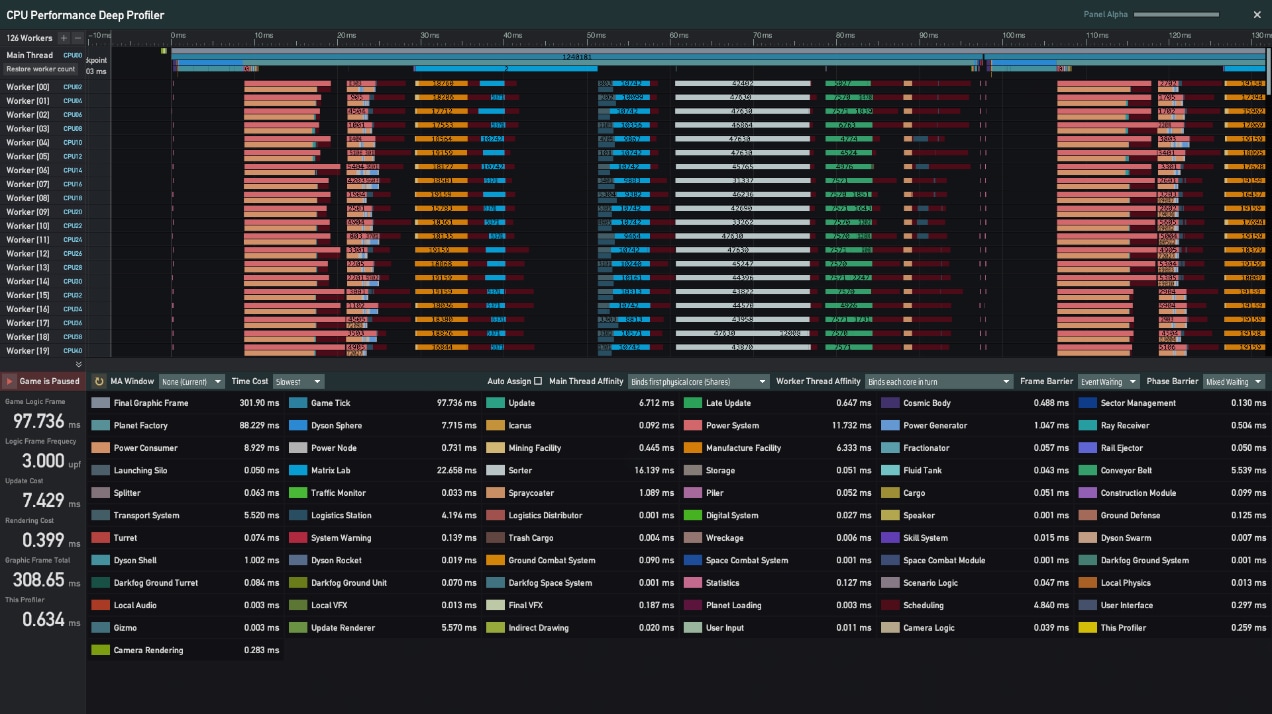
To better understand which parts of the logic were eating up CPU time — and exactly where the old system was falling short — we built a custom performance profiler. Below is an example taken from the old framework:
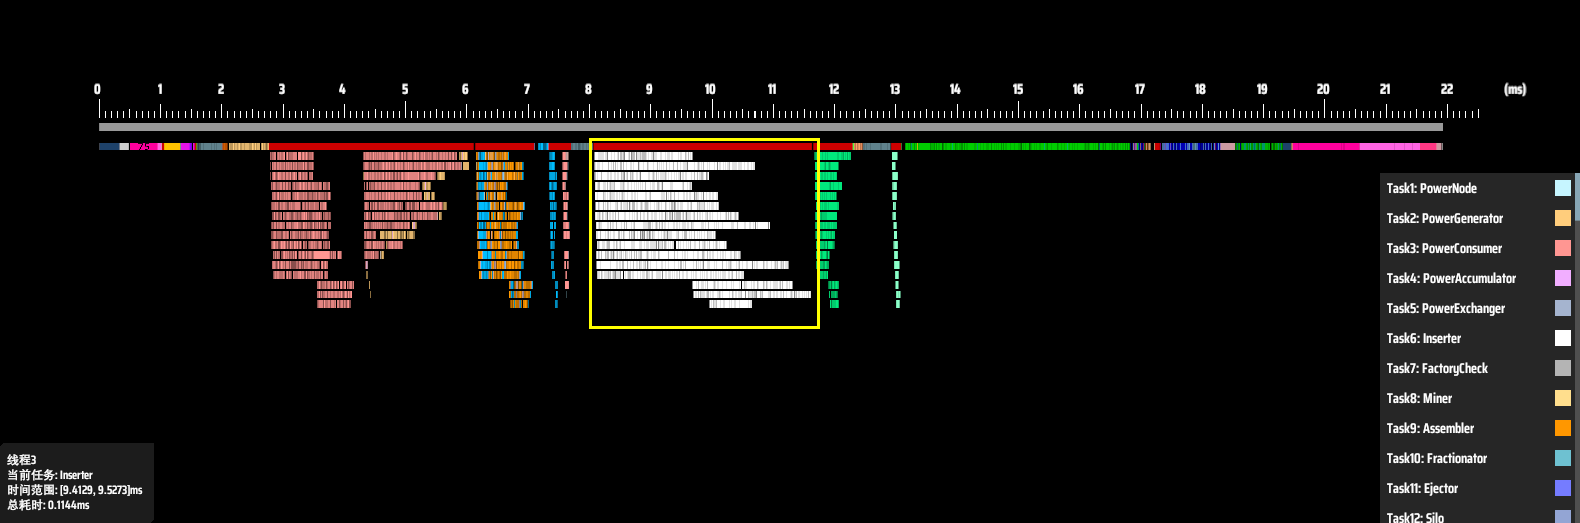 Thread performance breakdown in the old system.
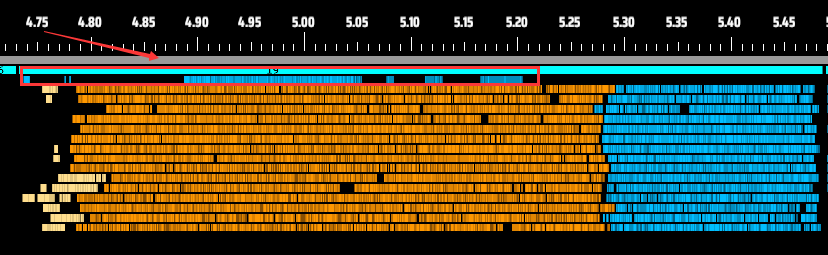
In this chart, each row represents a thread, and the X-axis shows time. Different logic tasks or entities are represented in different colors. The white bars show the runtime of each sorter logic block in its assigned thread. The red bar above them represents the total time spent on sorter tasks in that frame — around 3.6 ms. Meanwhile, the entire logic frame took about 22 ms.
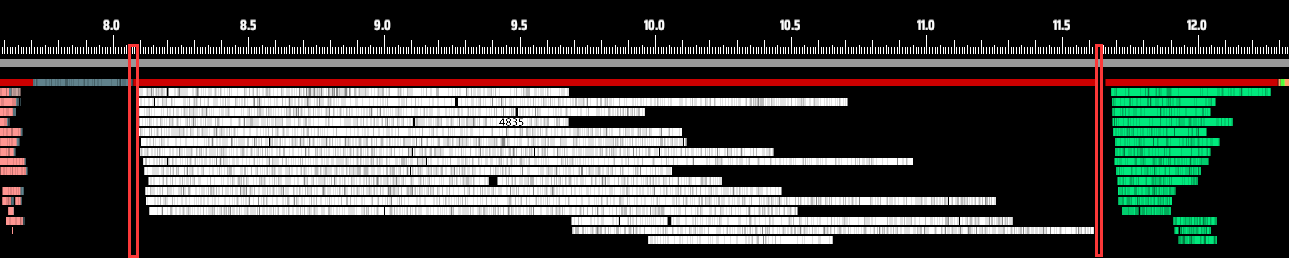 The red box marks the total time from sorter start to sorter completion.
Zooming in, we can spot some clear issues. Most noticeably, threads don’t start or end their work at the same time. It’s a staggered, uncoordinated execution. Take a closer look between red and yellow lines, some threads even need to wait for other threads to finish then begin their own tasks.
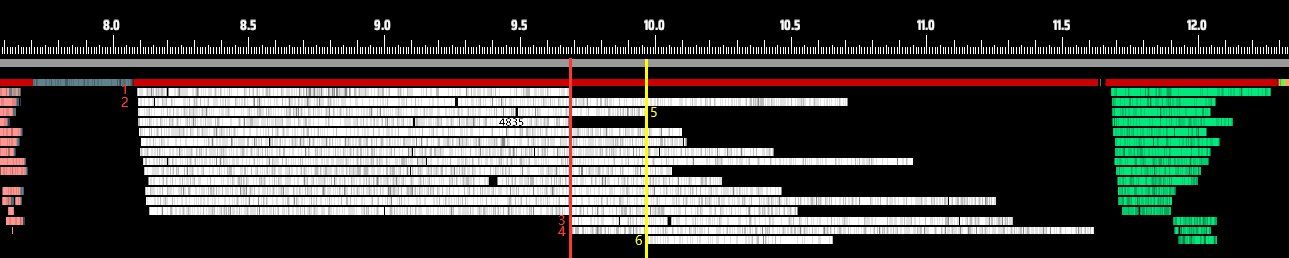 Here, threads 1, 2, and 5 finish first — only then do threads 3, 4, and 6 begin their work.
There are many possible reasons for this behavior. Sometimes, the system needs to run other programs, and some of those processes might be high-priority, consuming CPU resources and preventing the game’s logic from fully utilizing all available cores.
Or it could be that a particular thread is running a long, time-consuming segment of logic. In such cases, the operating system might detect a low number of active threads and, seeing that some cores are idle, choose to shut down a few for power-saving reasons — further reducing multithreading efficiency. Frame time is set by the slowest change of dependent work: if one thread falls behind, others can end up waiting at a barrier even if there is theoretical CPU capacity remaining.
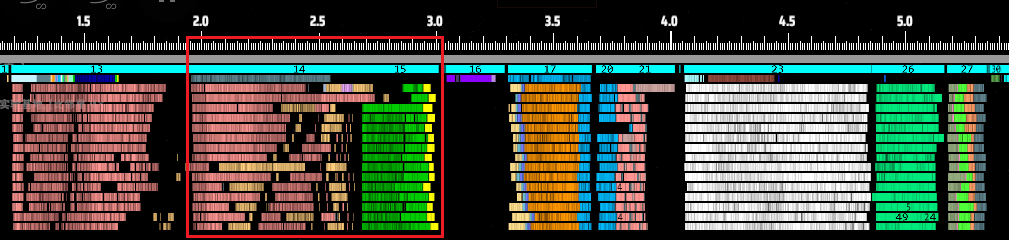
In short, OS-level automatic scheduling of threads and cores is a black box, and in some cases may result in available cores going unused. The issue isn’t as simple as “16 cores being used as 15, so performance drops by 1/16.” In reality, if even one thread falls behind due to reasons like those above, every other thread has to wait for it to finish, dragging down the overall performance. Take the chart below, for example. The actual CPU task execution time (shown in white) may account for less than two-thirds of the total available processing window.
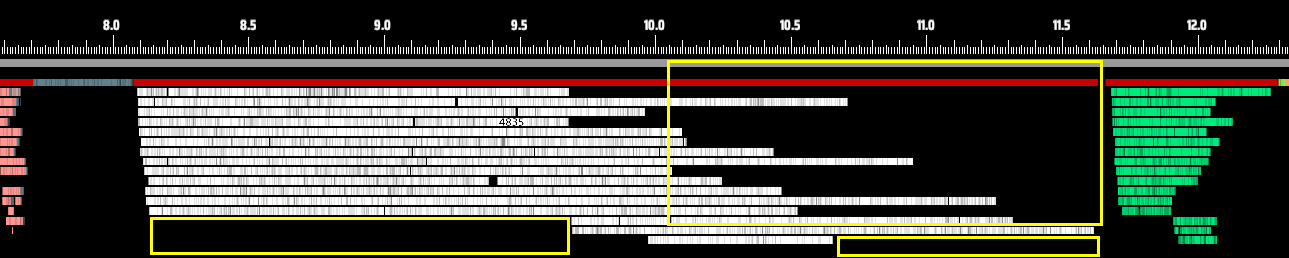 The yellow areas highlight significant zones of CPU underutilization.
Even when scheduling isn’t the issue, we can clearly see from the chart that different threads take vastly different amounts of time to complete the same type of task. In fact, even if none of the threads started late, the fastest thread might still finish in half the time of the slowest one.
Now look at the transition between processing stages. There’s a visible gap between the end of one stage and the start of the next. This happens because the system simply uses blocking locks to coordinate stage transitions. These locks can introduce as much as 50 microseconds of overhead, which is quite significant at this level of performance optimization.
To maximize CPU utilization, we scrapped the old framework and built a new multithreading system and logic pipeline from scratch.
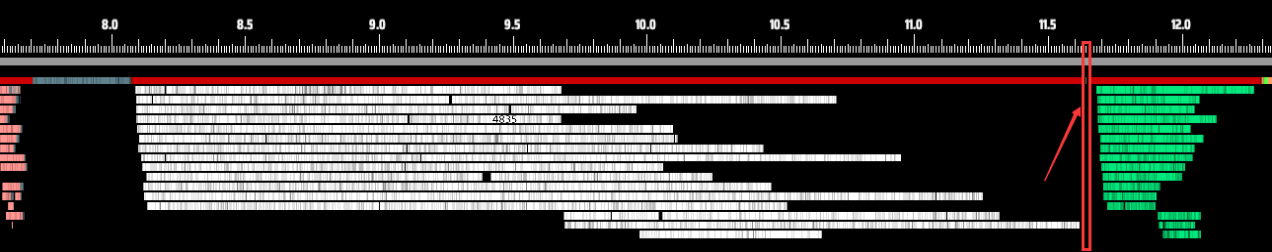
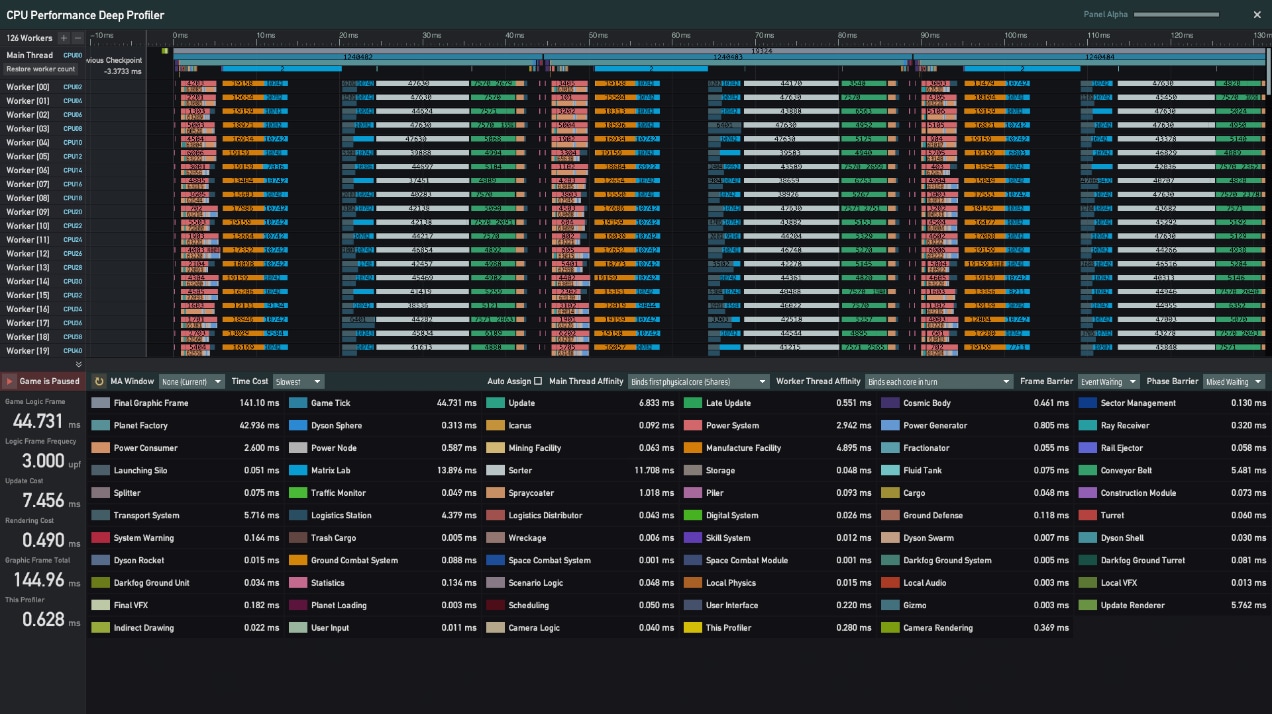
In the brand-new Multithreading System, every core is pushed to its full potential. Here’s a performance snapshot from the new system as of the time of writing:
The white sorter bars are now tightly packed. Start and end times are nearly identical — beautiful. Time cost dropped to ~2.4 ms (this is the same save). Total logic time fell from 22 ms to 11.7 ms — an 88% improvement (Logical frame efficiency only). That’s better than upgrading from an AMD Ryzen™ 5 7600 to a Ryzen 9 7950X CPU. Here’s a breakdown of why performance improved so dramatically:
1. Custom core binding: Previously, worker thread placement was left to the OS, which can sometimes result in migration and less predictable utilization depending on system load and CPU topology. We now offer an advanced option to bind worker threads to specific cores, which can improve consistency and performance in some cases.
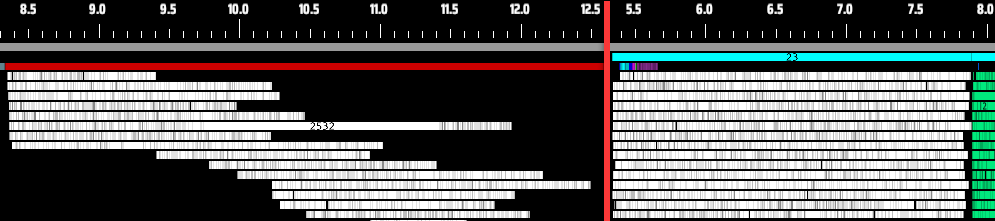 Zoomed-in comparison shows new framework (right) no longer has threads queuing while cores sit idle like old version (left).
2. Dynamic task allocation: Even with core binding, uneven task distribution or core performance differences could still cause bottlenecks. Some cores might be handling other processes, delaying thread starts. To address this, we introduced dynamic task allocation.
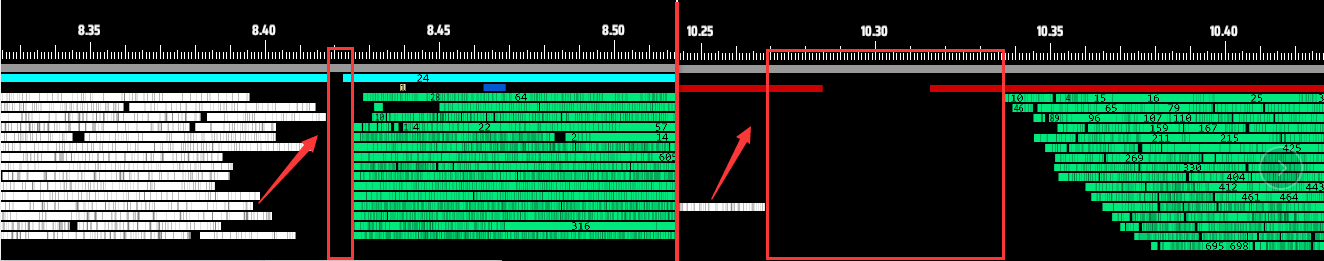
Here’s how it works: Tasks are initially distributed evenly. Then, any thread that finishes early will “steal” half of the remaining workload from the busiest thread. This loop continues until no thread’s workload exceeds a defined threshold. This minimizes reallocation overhead while preventing “one core struggling while seven watch” scenarios. As shown below, even when a thread starts late, all threads now finish nearly simultaneously.
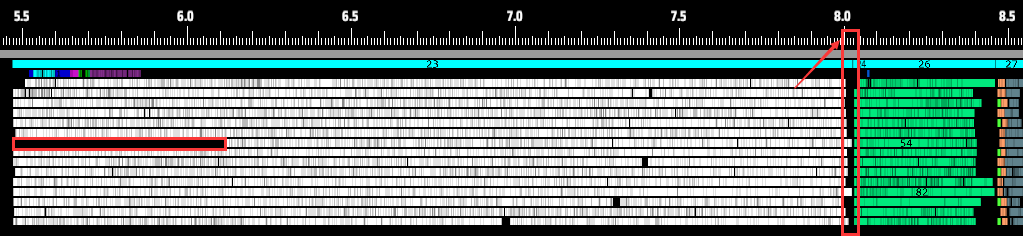 Despite occasionally delayed starts, all threads now complete computations together.
3. More flexible framework design: Instead of the old “one-task-per-phase” design, we now categorize all logic into task types and freely combine them within a phase. This allows a single core to work on multiple types of logic simultaneously during the same stage. The yellow highlighted section below shows Traffic Monitors, Spray Coaters, and Logistics Station outputs running in parallel:
 Parallel execution of Traffic Monitor/Spray Coater/Logistics Station cargo output logic now takes <0.1 ms.
 Previously single-threaded, this logic consumed ~0.6 ms.
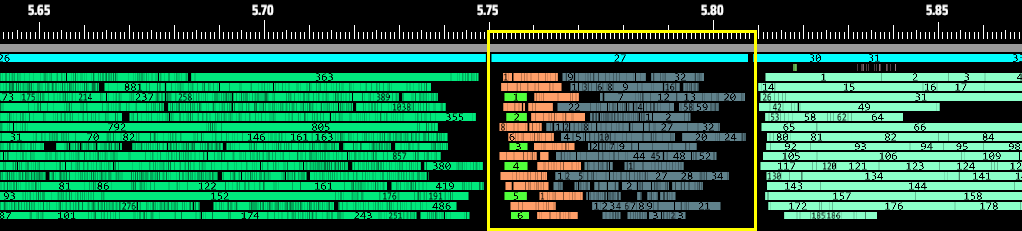
Thanks to this flexibility, even logic that used to be stuck in the main thread can now be interleaved. For example, the blue section (red arrow) shows Matrix Lab (Research) logic — while still on the main thread, it now runs concurrently with Assemblers and other facilities, fully utilizing CPU cores without conflicts.
 More flexible than waiting for other tasks to complete.
The diagram above also demonstrates that mixing dynamically and statically allocated tasks enables all threads to finish together. We strategically place dynamically allocatable tasks after static ones to fill CPU idle time.
 Updating enemy turrets/Dark Fog units alongside power grids utilize previously idle CPU cycles.
4. Enhanced thread synchronization: The old system required 0.02 - 0.03 ms for the main thread to react between phases, plus additional startup time for new phases. As shown, sorter-to-conveyor phase transitions took ~0.065 ms. The new system reduces this to 6.5 μs — 10x faster.
 New framework’s wait times (left) are dramatically faster than old (right).
We implemented faster spinlocks (~10 ns) with hybrid spin-block modes: spinlocks for ultra-fast operations and blocking locks for CPU-intensive tasks. This balanced approach effectively eliminates the visible “gaps” between phases. As the snapshot shows, the final transition now appears seamless.
In the gaming community, you never know what surprises players will bring. During the public test, one player shocked us by running the multithreaded version of DSP on an AMD Ryzen Threadripper CPU. Not only was it jaw-dropping, but it also brought us valuable feedback: our game didn’t seem to support more than 64 threads.
We fixed that issue quickly, but then a new problem surfaced: we didn’t actually have hardware anywhere near that level for testing. Which meant: If another issue comes up, how would we even verify it? And, honestly, who wouldn’t want to test their lovingly hand-tuned code on ultra-high-end hardware?
Just when we were stuck, we reached out to AMD — and to our surprise, they generously offered to help. They sent us an absolute performance monster: a fully equipped workstation powered by an AMD Ryzen Threadripper PRO 9985WX processor.
Just reading the specs was enough to get our blood pumping: 64 cores, 128 threads, 3.2 GHz base, up to 5.4 GHz boost, and support for up to 8 channels of memory.
It really felt like the ultimate test platform tailor-made just for us.
Naturally, the moment we unboxed it, we immediately started running tests.
We loaded a save file producing 6.8 million Universe Matrices per minute — basically filling every possible corner of the game. On this setup, non-critical frame time landed around 100 ms. For comparison, a player using an Intel i9-14900K loaded the same save with non-critical frame time at around 170 ms.
It looked like even with 128 threads on the table, the real-world gains weren’t as huge as you might expect. After digging into it, we found that scheduling overhead was growing rapidly with thread count, especially since we dynamically allocate workloads several times per frame. This scheduling alone cost nearly 20 ms. On top of that, we discovered many cases of false sharing — multiple cores touching the same memory regions — which seriously hurt inter-thread communication efficiency.
We performed a round of targeted optimizations on these issues. Now, the same save shows non-critical frame time dropping to about 43 – 46 ms, effectively doubling the frame rate.
We’ll continue deep optimization for this monster-tier AMD hardware, so feel free to look forward to more performance breakthroughs.