AMD RDNA™ 2 – Radeon™ GPU Profiler 1.10 - YouTube link
RGP 1.9 and 1.10 introduce support for AMD Radeon™ RX6000 series GPUs, a new memory cache counter feature, and support for DirectX® and Vulkan® ray tracing.
It’s time for another release of Radeon™ GPU Profiler (RGP)!
RGP is our ground-breaking low-level optimization tool that provides detailed information on Radeon™ GPUs.
This latest release – version 1.10 – adds support for:
And there’s more too! Read on to find out.

While RGP has always used low level data from Radeon GPUs to give you insight into your game’s performance, we have taken this a bit further in this release. With the introduction of the cache counters, you can now see how your frame accesses the various cache levels of the GPU’s memory hierarchy. RGP can now visualize data from the Level 0, Level 1, and Level 2 memory caches, as well as data from the shader core’s instruction and scalar caches.
Built on the GPU hardware’s streaming performance metrics (SPM), this data provides unique insight into what is happening on the hardware, and gives you the opportunity to optimize a shader’s memory access patterns to achieve higher performance.
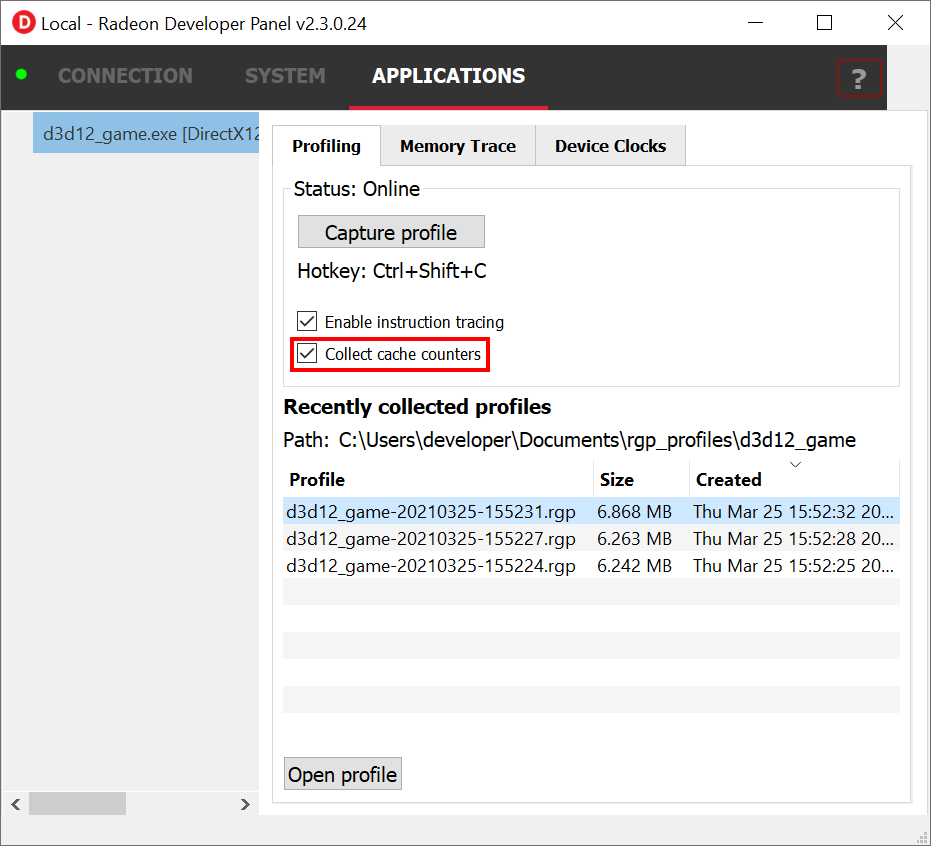
This functionality is supported on RDNA and RDNA 2 hardware, so you’ll need to have a Radeon RX 5000 series GPU or newer. To collect this data, just make sure the Collect cache counters option is checked in Radeon Developer Panel when you capture a profile.
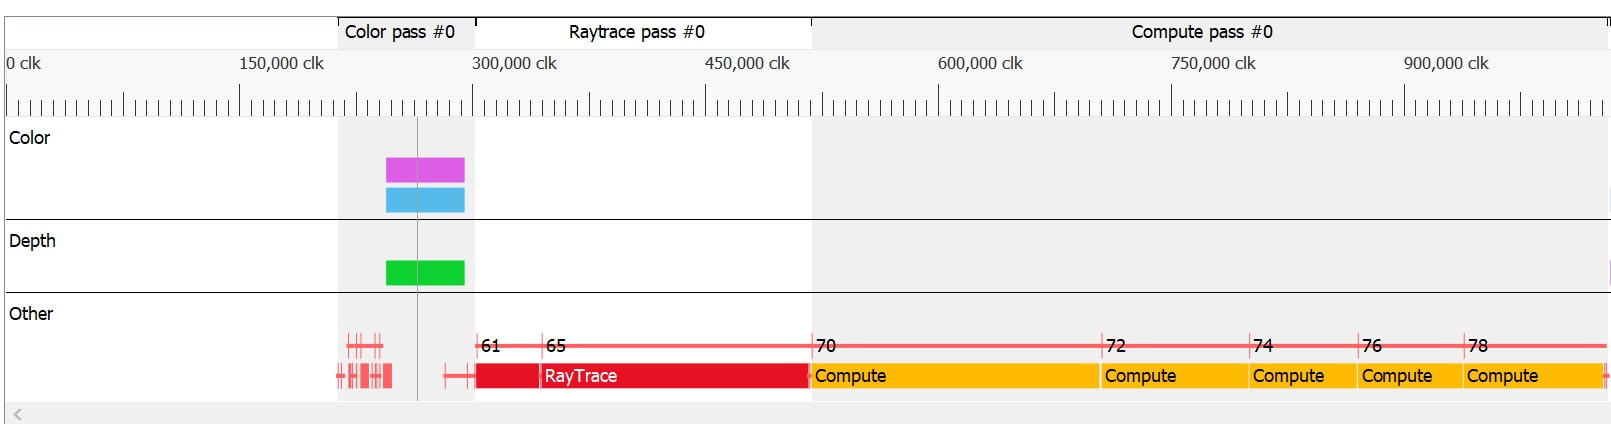
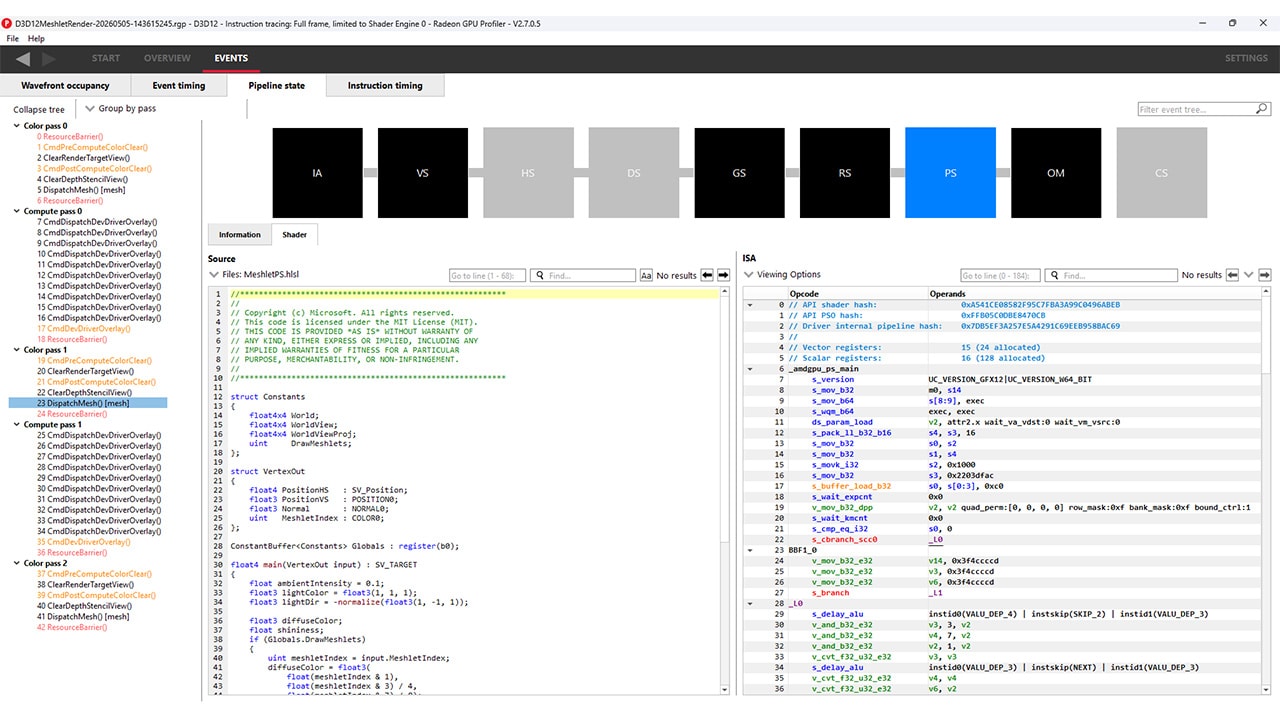
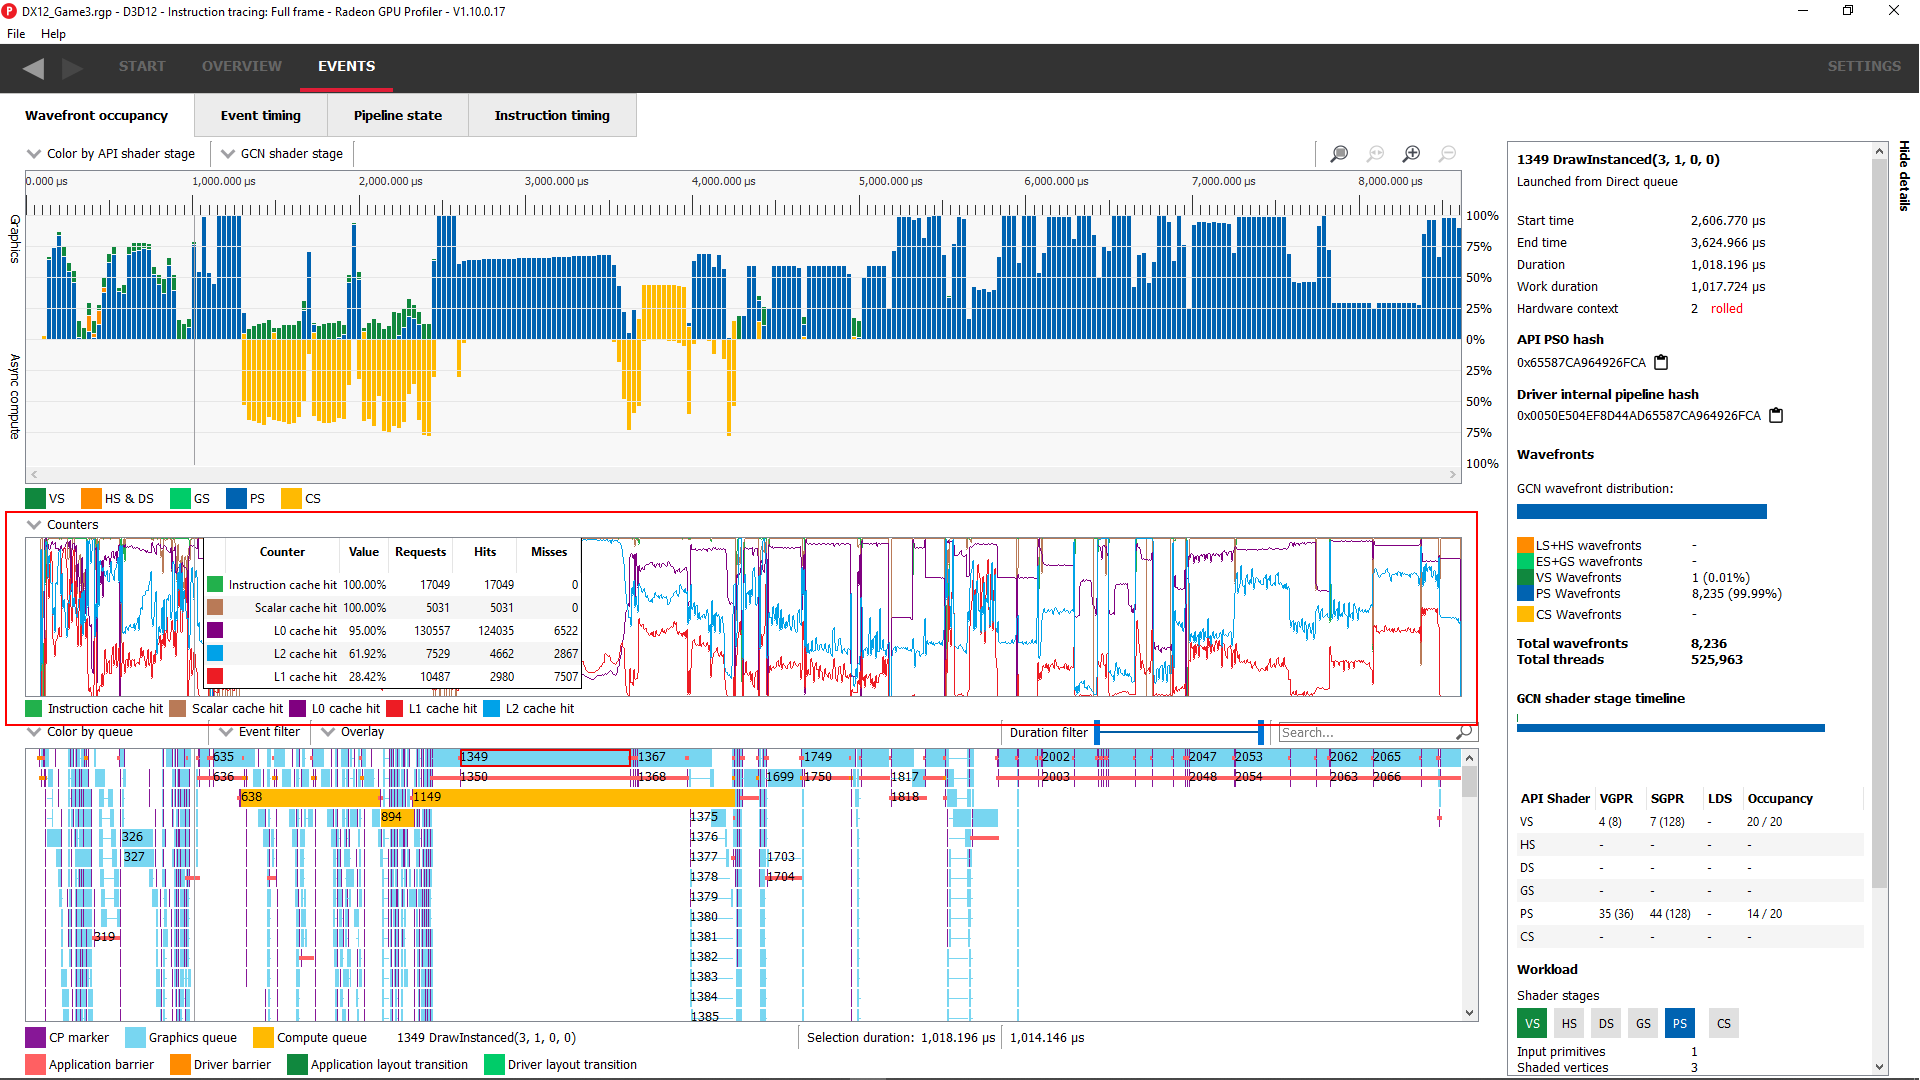
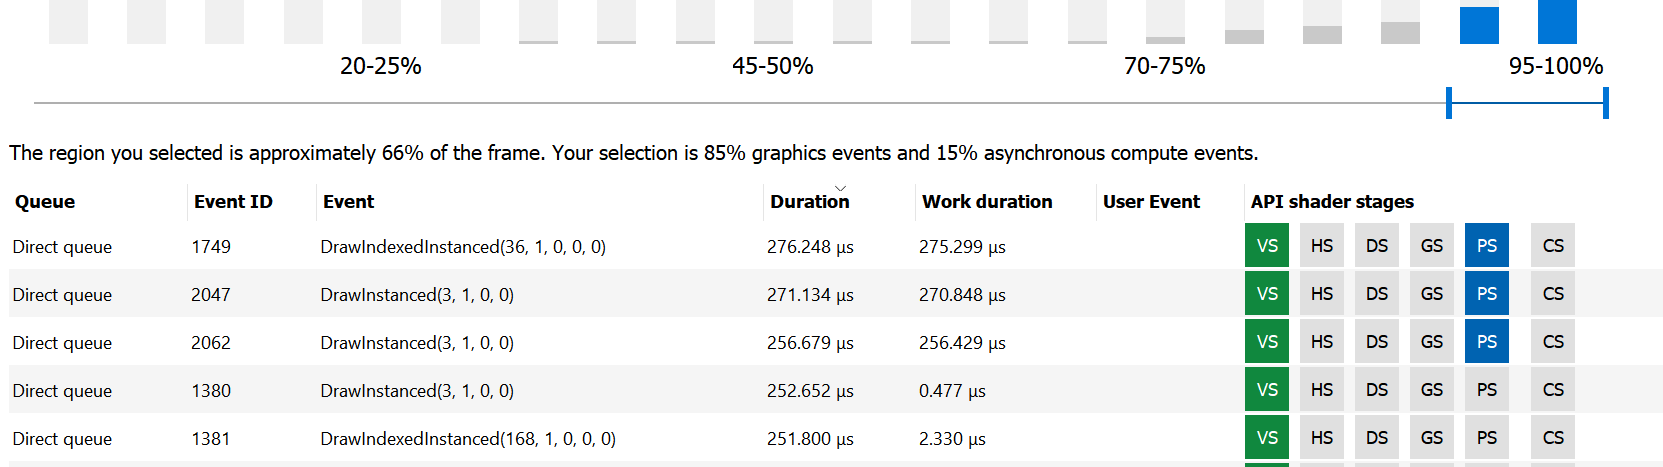
When you open the captured profile in RGP, the Wavefront Occupancy pane has a new UI element which visualizes the cache data. Below, you can see the five cache statistics that are collected. The graphs plot the hit percentages for each cache across the frame timeline. Using this view, you can correlate the cache statistics with both the wavefront occupancy and the event timeline.
Here’s how it looks in RGP (see the area outlined in red in the below screenshot):
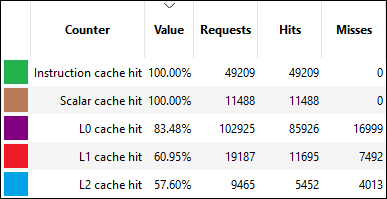
Simply hover the mouse over the graph to view more details about each cache at the point in the graph under the mouse, including the hit percentage, the number of cache requests, hits, misses:
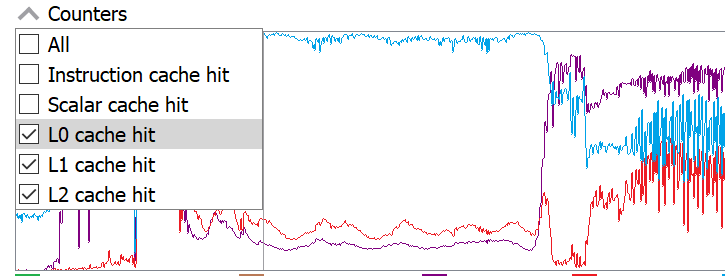
You can enable or disable the graph for any of the caches using the Counters dropdown which appears above the graphs. Here, we have unselected the Instruction and Scalar caches, so the graph will only show the L0, L1, and L2 cache counters:
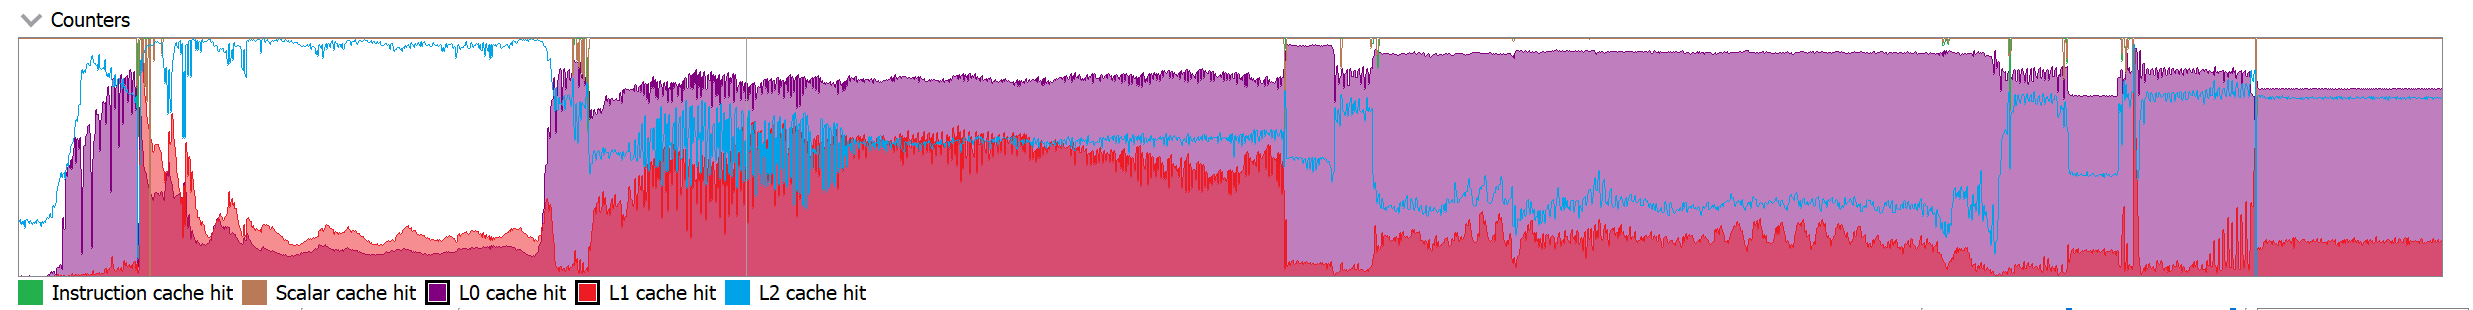
You can also fill in the area under one or more of the graphs by clicking on that item’s color box in the legend below the graphs.
Here, we have clicked the purple L0 cache hit color box and the red L1 cache hit color box, to fill in the area under both line graphs:
Want a more verbose description of each statistic? Simply hover the mouse over the counter name in the legend:

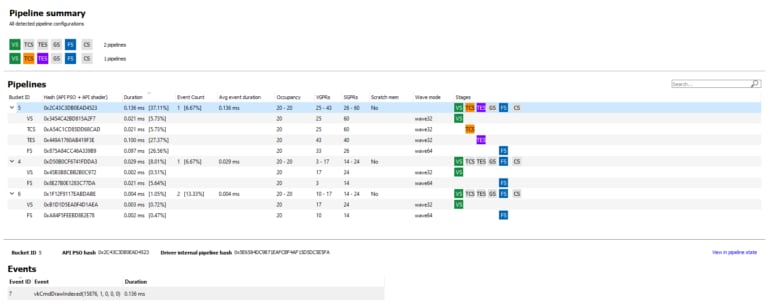
This release adds support for Vulkan® ray tracing, building on the DirectX® raytracing support introduced in the 1.9 release. In fact, the Vulkan® ray tracing support is nearly identical to the DirectX® raytracing support.
When visualizing profile data from an application that uses the Vulkan® ray tracing API, you will see one or more of the following events:
vkCmdTraceRaysKHR<Indirect>
vkCmdTraceRaysKHR<Unified>
vkCmdTraceRaysIndirectKHR<Indirect>
vkCmdTraceRaysIndirectKHR<Unified>
vkCmdBuildAccelerationStructuresKHR
vkCmdBuildAccelerationStructuresIndirectKHR
vkCmdCopyAccelerationStructureKHR
vkCmdCopyAccelerationStructureToMemoryKHR
vkCmdCopyMemoryToAccelerationStructureKHR
The exact events you see will depend on how the application being profiled uses the Vulkan® ray tracing API. You can read more about the ray tracing support in this article, which also contains a description of the difference between the and variants of vkCmdTraceRaysKHR and vkCmdTraceRaysIndirectKHR .
There have also been several other minor updates:
WinPIXEventRuntime headers – please check out the latest documentation for instructions on using PIX markers with RGP.And as is the case with all RGP releases, there have been plenty of other changes intended to improve quality in this release.
Please check out the RGP product page, where you can find links to download RGP 1.10. And please feel free to reach out to us via the Issues section on the RGP page on GitHub. We value all feedback provided.