AMD Radeon™ Memory Visualizer
AMD Radeon™ Memory Visualizer (RMV) is a tool to allow you to gain a deep understanding of how your application uses memory for graphics resources.
We previewed the main RGP 1.5 features at GDC 2019 late last month, but didn’t set the release free because it relied on driver support that wasn’t quite ready for primetime. It’s one of the biggest upgrades in feature set since the 1.0 release back in July 2017, adding two of the most requested features we’ve been asked for since 1.0, along with some really great improvements to frame navigation that we hope you’ll love. That driver work is now baked and ready, so let’s dive into what’s new.
Note that the first release of the RGP 1.5 series is 1.5.1, not 1.5.0. While waiting for the driver support we needed to mature into a release driver, we had time to iterate on things such that 1.5.1 was ready in time.
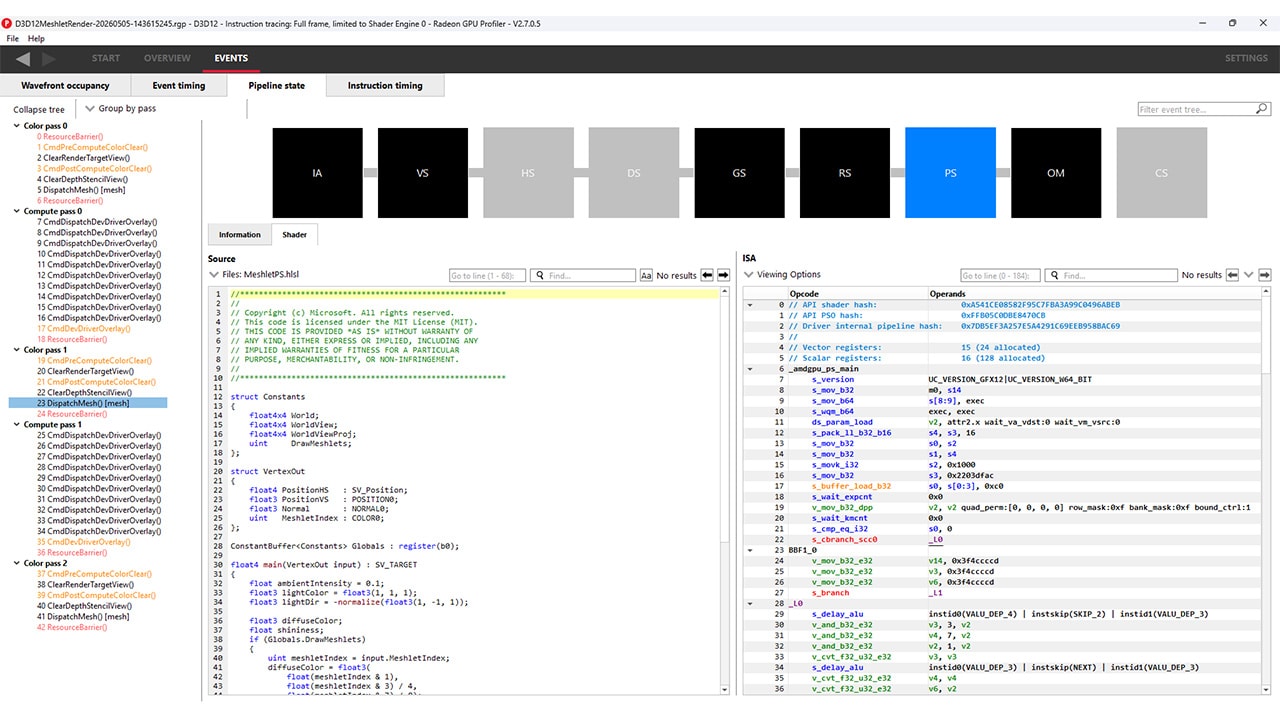
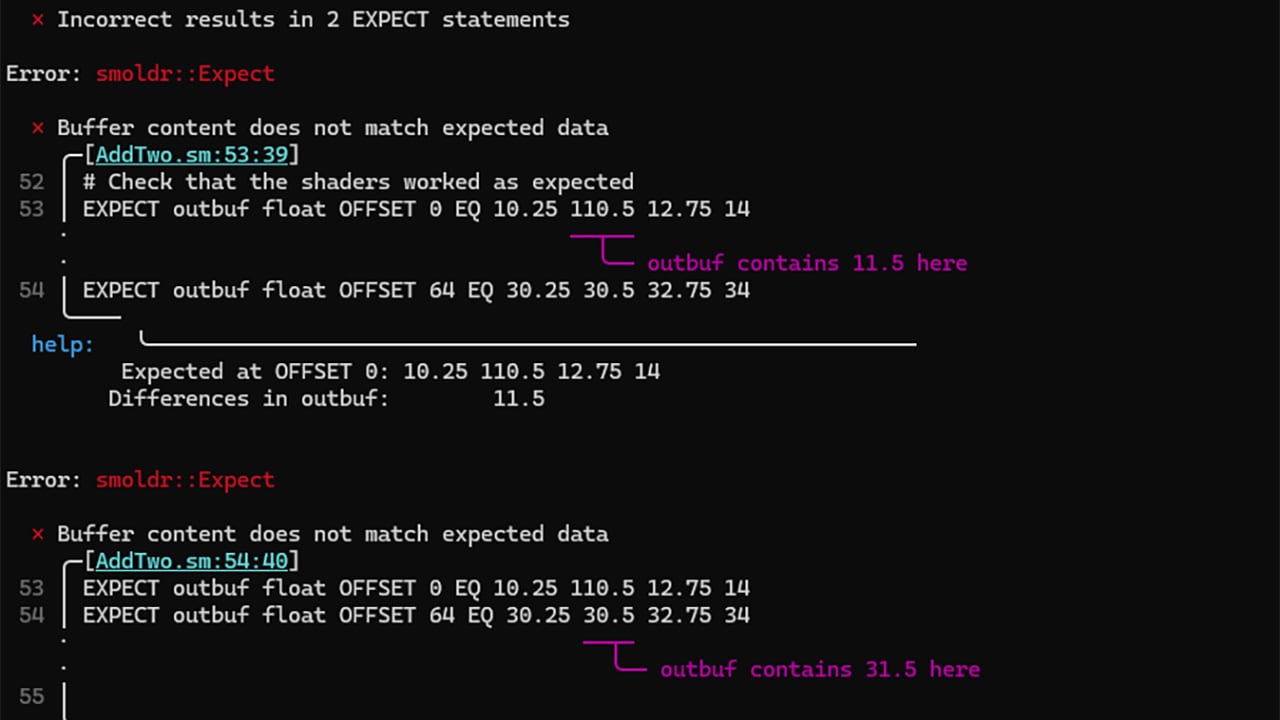
If you’ve ever used RGP to profile your frame and wondered what was going on deep in the hardware as it issues instructions, now you can find out! Using the built in hardware-level tracing support to dump instruction level trace data during a capture, RGP now shows you that data with a built-in timing view to help you understand how it performs.
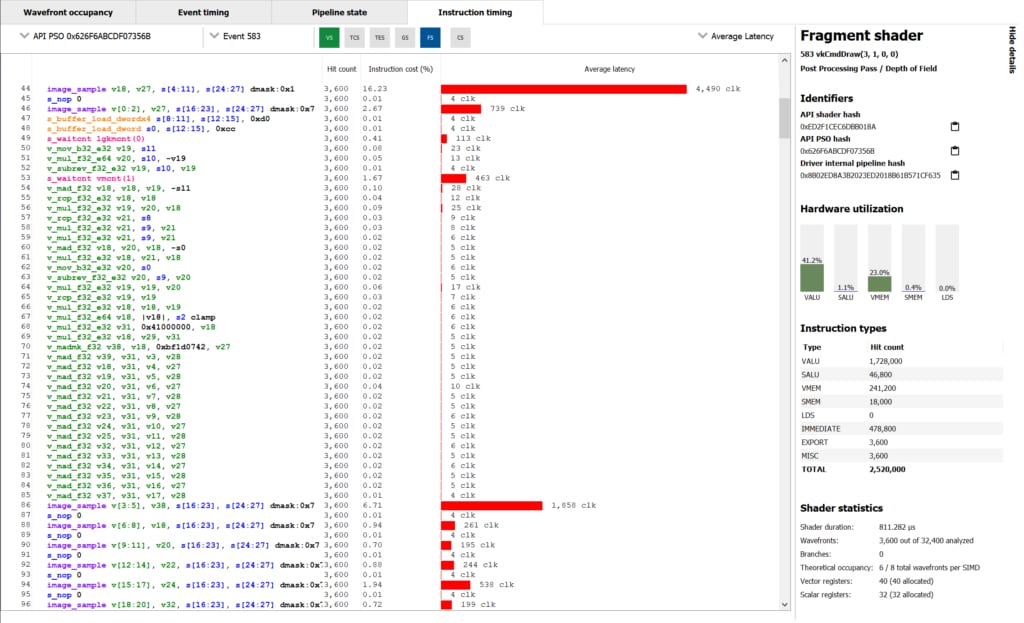
Dumping the instruction-level data doesn’t require any extra work or instrumentation on your part, or any recompilation of shaders; all you need to do is profile a frame. As you can see in the screenshot above, you get GCN ISA on the left, along with timing data to follow as the program flows from top-to-bottom. You get average timings in clocks and as a percentage of the shader program, along with an intuitive time-based graph on the right.
The screenshot shows something worth noting: instruction timings shown are an average, and variable. That might be counter intuitive, so here’s why: because of the way GPUs work to hide memory latency, and how they share execution resources, sometimes the shader core needs to wait for memory or other data dependencies to be satisfied before an instruction can make forward progress.
In general, if you see a long bar on the timing view it’s because off-chip memory accesses were involved in running that particular instruction. You can also use the new data to decide if max occupancy is what you need to achieve in the shader you’re analysing. Because wavefronts share access to resources, particularly the cache hierarchy, fully occupying the machine can be detrimental to performance by decreasing the effectiveness of the caches. Instruction timing data along with RGP’s data on VALU utilisation can help you work on that balance if needed!
The high-level workflow to get instruction timing is pretty straightforward. Highlight an expensive event in the normal timeline view and copy the identifying hash for that pipeline state object (PSO), then hop over the Radeon Developer Panel and plug that hash in before triggering a profile to be collected. That’ll instruct the GPU to dump instruction timing data for that particular PSO.
Back in RGP, select an event that contains the traced PSO and pick a shader stage to get access to the new view. Done!
The natural companion to instruction timing is being able to view the GPU ISA that’s part of a pipeline state object, so RGP 1.5 adds that into the pipeline state pane like so:
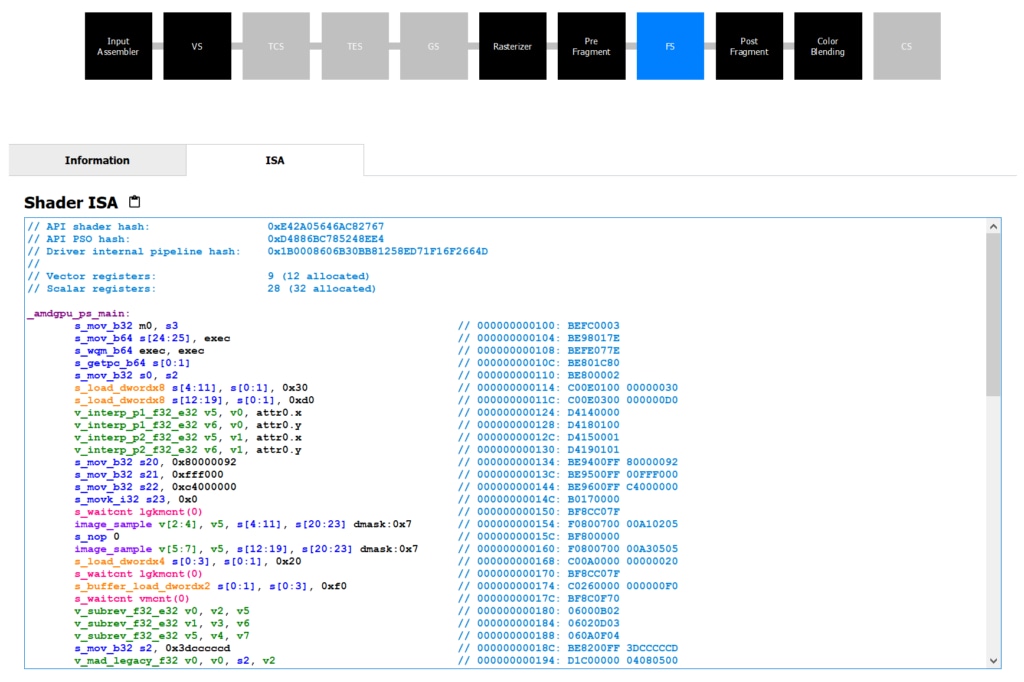
Each active shader stage that has embedded GPU ISA that we can show you will now have two tabs. The first is the same information tab that you’re familiar with that contains information about the hardware occupancy of the particular event you’re interested in. That’s where you see number of wavefronts launched, the average number of active threads inside those wavefronts, the average duration of a wavefront, and information about the theoretical occupancy.
Next to that tab is a new one labelled ISA , showing you the hardware instructions sent to the GPU, after being compiled from the higher level language you submitted with the dispatch or draw using one of RGP’s supported high-level APIs. It’s very similar to what you’ll see in the instruction-level timing view above, colour coded to help you separate instructions and operands, jump labels, different instruction types and other relevant parts in the disassembly.
Lastly we’ve got a couple of nice quality of life improvements that improve on functionality already there. The first is related to user markers: if the thing you’re profiling has user marker support, we now show you those user markers in the event view as labels on top of the event!
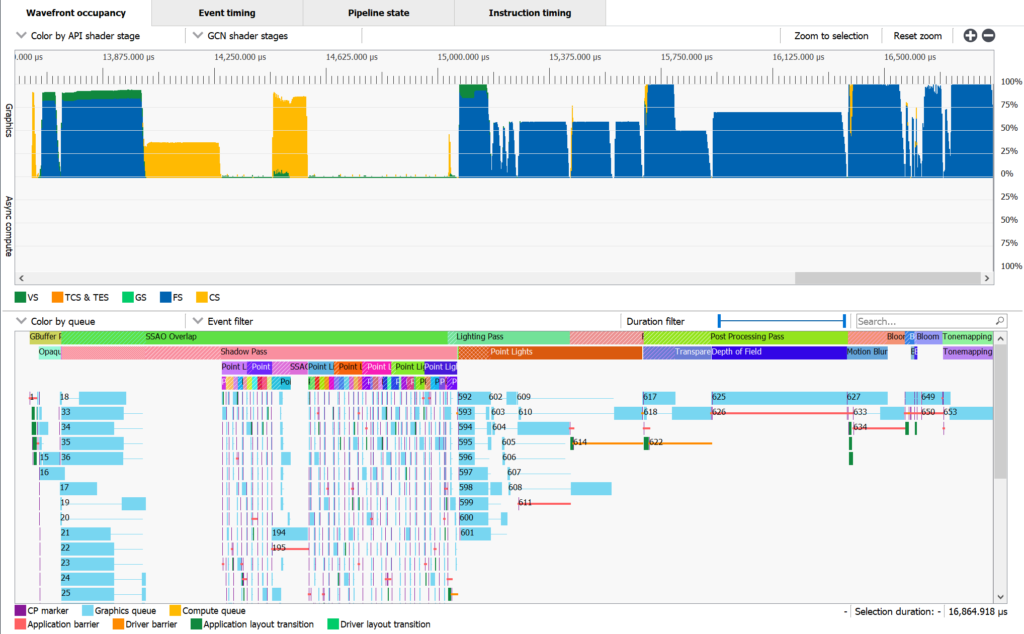
In that screenshot you can see what I mean, with the coloured events overlayed with contrast-appropriate text labels to help you annotate what you can see above in the wavefront occupancy view. That makes it easier to see how your frame is put together, get a better idea of what is overlapping when that’s happening, and follow the general flow of what you’re submitting to the GPU a lot easier than before.
Secondly, we’ve improved how the UI lets you group and filter events to make it easier to navigate your profiled frame, find events of interest, search for PSO hashes, and group together events by related state in a nicer way. RGP tries to make it easy to find actionable data in your frame and the filtering and grouping changes are designed to help you narrow down to an area of interest and do something about what you can see.
RGP 1.5 requires specific driver support in order to work correctly, so please make sure you have at least 19.5.1 installed, which was released yesterday.
As always, you can find out more about RGP, including links to the release binaries on GitHub and the full release notes list, on our product page. As always: please send us your feedback so that we can keep making RGP the very best developer-focused performance analysis tool for modern graphics and compute profiling work.
Your feedback is incredibly valuable to us and helps drive the RGP roadmap forward. The vast majority of change in RGP 1.5 were user-driven, so if you want something and it makes sense then just let us know!