AMD Radeon™ Memory Visualizer
AMD Radeon™ Memory Visualizer (RMV) is a tool to allow you to gain a deep understanding of how your application uses memory for graphics resources.
We are happy to announce the release of Radeon™ GPU Profiler (RGP) v1.7. This release adds support for the latest Radeon™ graphics cards: the RX 5500 series and the RX 5300 series. In addition, this release adds new UI features to help you better understand your GPU workloads.
RGP generates easy to understand visualizations of how your DirectX®12, Vulkan®, and OpenCL™ applications interact with the GPU at the hardware level. Profiling a game is both a quick and simple process using the Radeon Developer Panel and our public GPU driver.
First, a new Overview pane has been added: the Pipelines pane. This pane summarizes the pipeline usage for the profile, including detailed information about the shaders contained in the pipeline and the events which use the pipeline. In the image below, you can see this new pane.
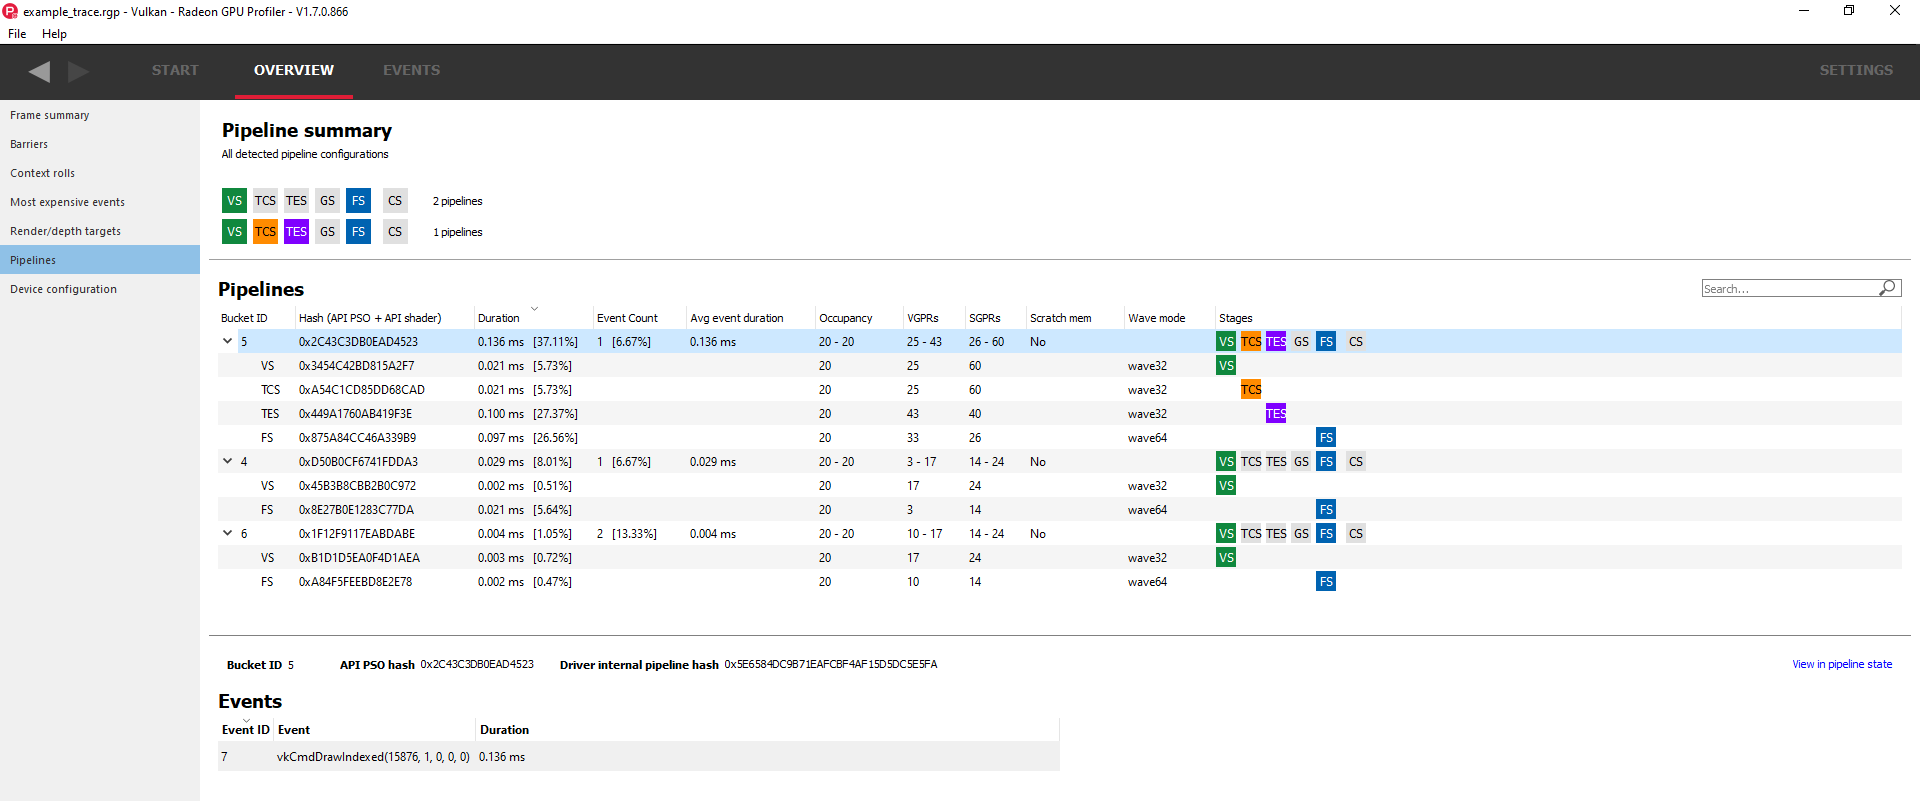 New Pipelines Pane
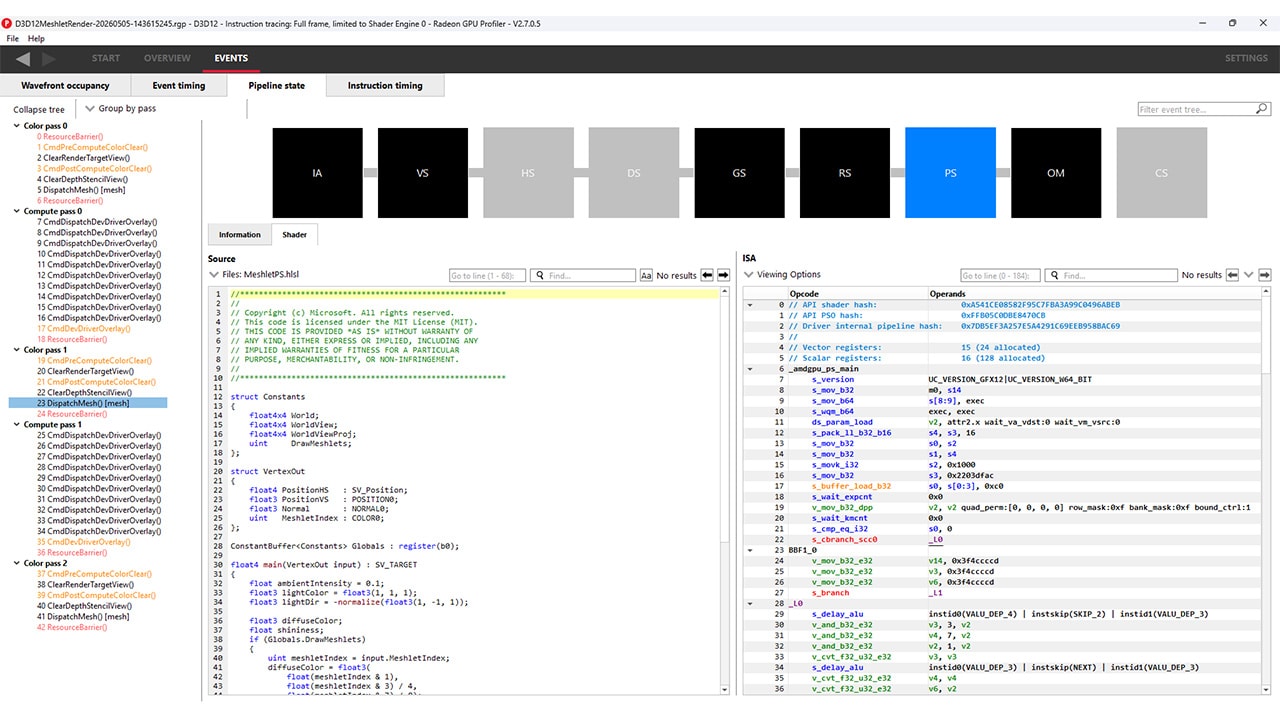
In the above image, you can see another new addition. When viewing traces taken on RDNA hardware, RGP will now tell you whether a shader was compiled in wave32 vs. wave64 mode. In addition to being displayed in the Pipelines overview, this is also displayed in the Pipeline State view for a particular event.
Next, the timeline in the Wavefront Occupancy view now includes several overlays which allow you to visualize additional data alongside the events. In previous RGP releases, user events were displayed at the top of the timeline to provide extra context to the actual GPU events. In RGP 1.7, this has been enhanced to allow optional display of additional overlays. The new overlays supported are Hardware Contexts, Command Buffers, and Render Targets.
In the image below, you can see the UI element used to select which overlays are displayed. In the timeline itself, you can see each of the four types of overlays displayed in rows at the top of the timeline.
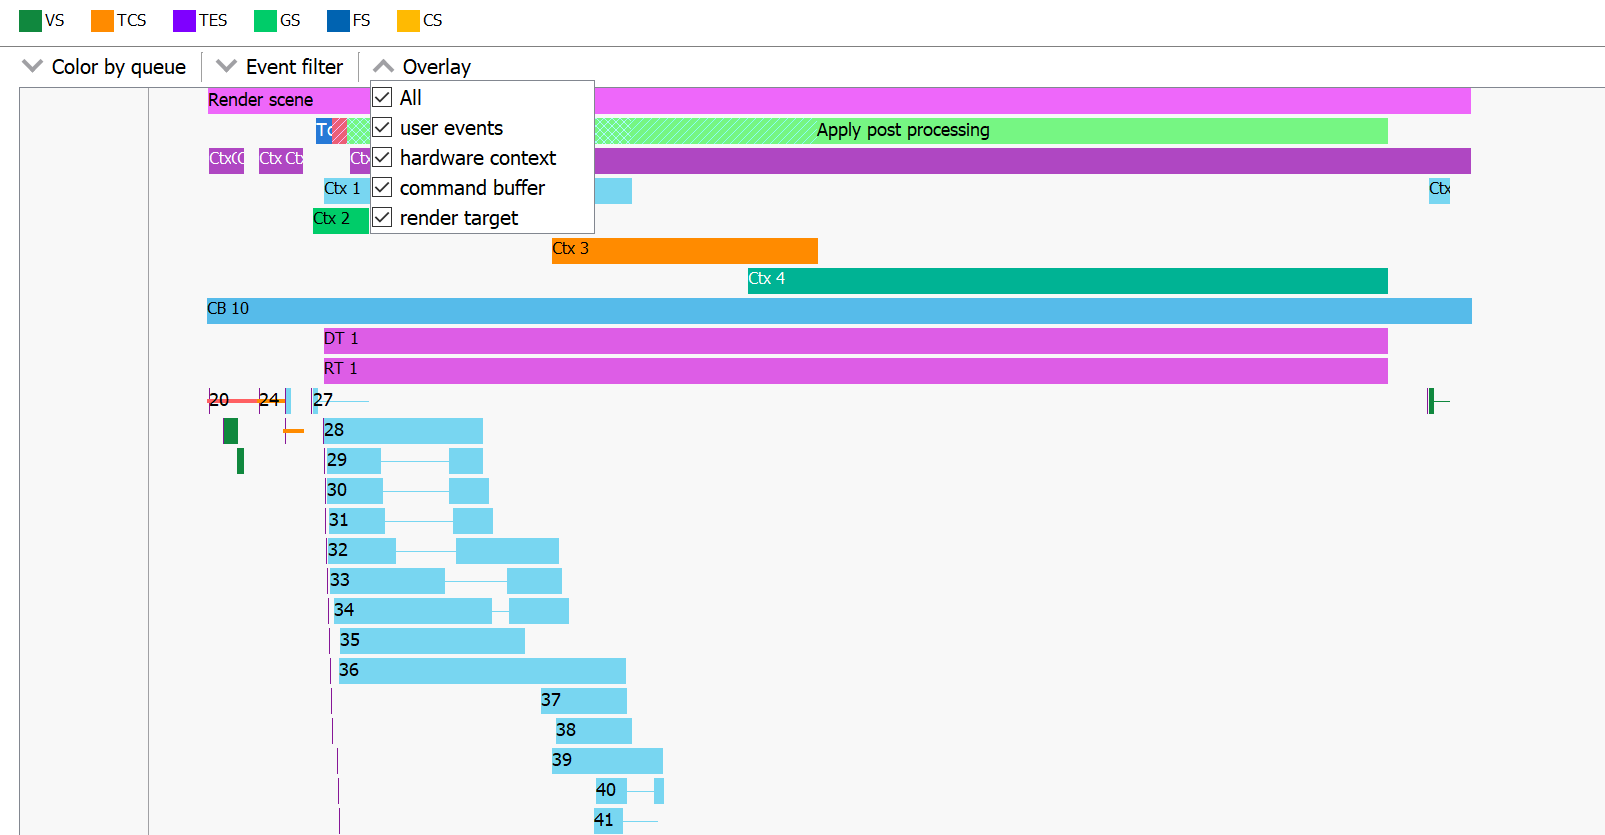 New Overlays for Wavefront Occupancy View
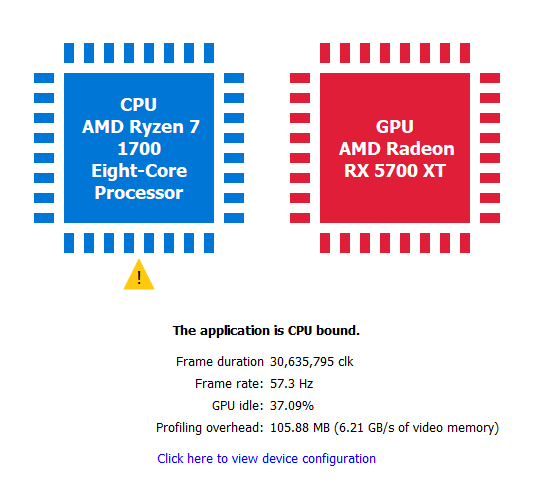
One other new feature is the display of the amount of overhead incurred and bandwidth used when the profile was captured. This can be found in the Frame Summary pane, as seen below.
In addition to the above UI items, RGP 1.7 also includes an improved algorithm for assigning latencies to instructions in the Instruction Timing view. This should lead to more accurate instruction timing data.
This release also includes many bug fixes and smaller enhancements, all designed to improve the profiling experience.
Click here to find out more about RGP.
As always: please send us your feedback so that we can keep working to make RGP the very best developer-focused performance analysis tool for modern graphics and compute profiling work.
Your feedback is incredibly valuable to us and helps drive the RGP roadmap forward, so if you want something and it makes sense then just let us know!