AMD RDNA™ 2 – Radeon™ GPU Profiler 1.10 - YouTube link
RGP 1.9 and 1.10 introduce support for AMD Radeon™ RX6000 series GPUs, a new memory cache counter feature, and support for DirectX® and Vulkan® ray tracing.
The AMD Developer Tools team is pleased to announce a new version of the Radeon™ GPU Profiler (RGP).
RGP is our ground-breaking low-level optimization tool that provides detailed information on Radeon™ GPUs.
This latest release – version 1.11 – offers several enhancements to our existing feature set:
Ray tracing call targets.
Cache counters.
And there’s more too! Read on to find out.
On the ray tracing front, there is a new feature available in the Instruction timing pane. When viewing instruction timing data for an ray tracing event, you’ll now be able to visualize and follow the control flow when one shader in the ray tracing pipeline calls another one. These calls are represented by a s_swappc instruction and the returns are represented by a s_setpc instruction.
When either of those instruction types with a non-zero hit count appears in the ISA view, a glyph appears next to that instruction. This is an indication that the Details panel on the right will show a list of targets for the selected instruction.
s_swappc , the targets are the functions that are called.s_setpc , the target shown is the caller function – i.e. the target that control will return to.In the following screenshot, you can see this glyph next to the selected s_swappc_b64 instruction. You can also see the Call targets table in the Details panel:

In the above case, the s_swappc_b64 instruction has a Hit count of 2938 . In the Call targets list, you can see that of those 2938 hits, 2737 resulted in calls to the AnyHitMeshClipFromRed shader function, while the remaining 201 resulted in calls to the AnyHitIgnore shader function.
You can also click any item in the Call targets list to quickly jump to that shader function. When you do this, the main ISA pane will get updated to show the ISA for the newly-selected shader function.
There have been a few minor enhancements to the Cache Counters features introduced in the previous RGP release. Previously, this feature was supported only for DirectX® 12 and Vulkan® applications. With RGP v1.11, this feature is now also available for OpenCL applications. In order to use this feature with OpenCL, you’ll need to have a 21.20-based Adrenaline driver installed. Older drivers do not have the support required for OpenCL Cache Counter collection.
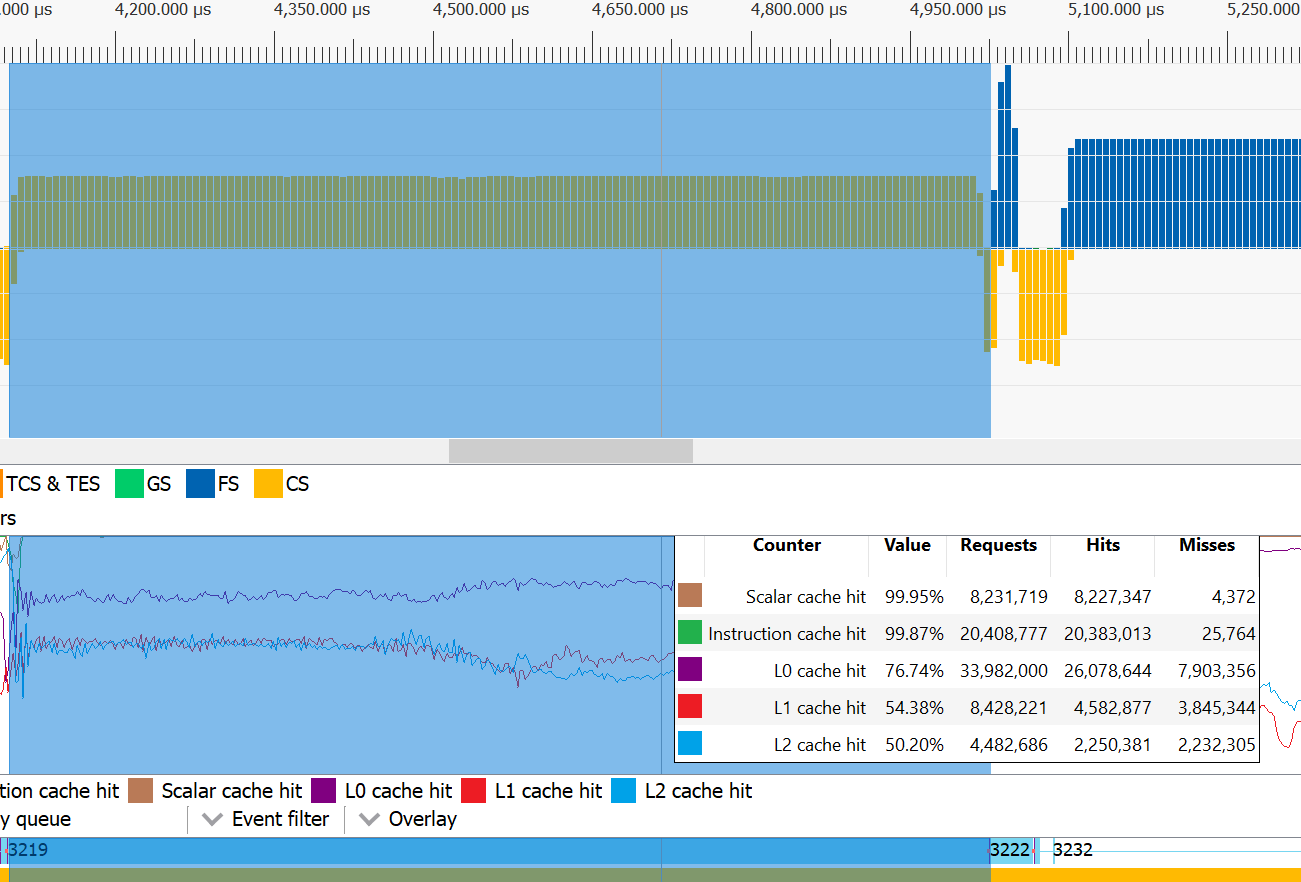
In addition, there has been a change to the Cache Counter tooltip that appears when the mouse hovers over the counter graphs. Now when a region of the frame is selected, the tooltip will show aggregate values of the counters for the selected region.
In the screenshot below, a region representing a single dispatch on the graphics queue is selected. The tooltip shows the cache hit percentages as well as the number of Requests, Hits, and Misses for the selected region. Contrast this with the tooltip contents when there is no selection – in this case, the tooltip simply shows the counter value of the nearest counter timestamp.

You can find out more about RGP, including download links the latest release notes list, on our product page.
As always, we love to get feedback and suggestions from developers. If there is something you’d like to see in RGP or if you run into any issues, please let us know!
