AMD Radeon™ Memory Visualizer
AMD Radeon™ Memory Visualizer (RMV) is a tool to allow you to gain a deep understanding of how your application uses memory for graphics resources.

Radeon™ Memory Visualizer (RMV) v1.1 is available to download now and has several new features, which we will be talking about here.
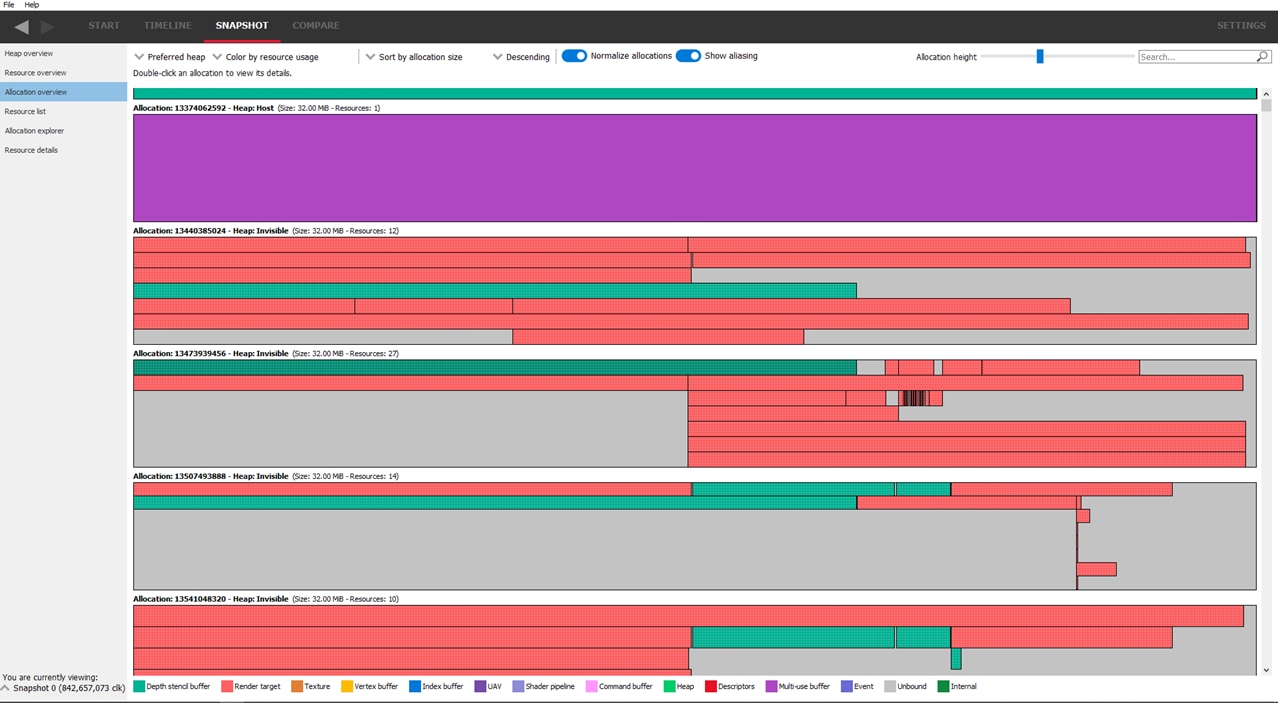
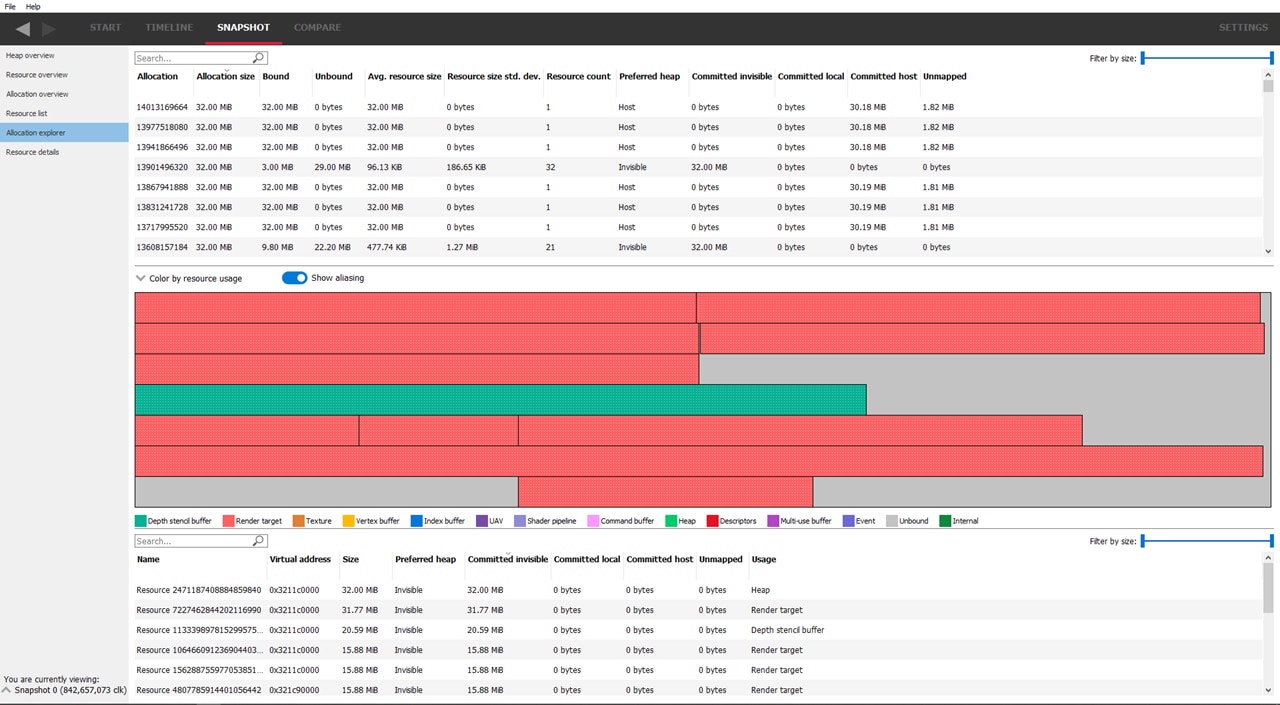
We have improved the support for showing aliased resources. In RMV version 1.0, it was only possible to know that a resource was aliased by the way it had a textured pattern, and only one of the aliased resources would be drawn, since they are effectively drawn on top of each other. It is now possible to see the aliasing as a series of stacked resources by enabling the “show aliasing” toggle button.
In the allocation overview pane, the height of each allocation can be changed using the ‘Allocation height’ slider. By default, the allocation height has been slightly reduced so that more allocations can be seen at once.
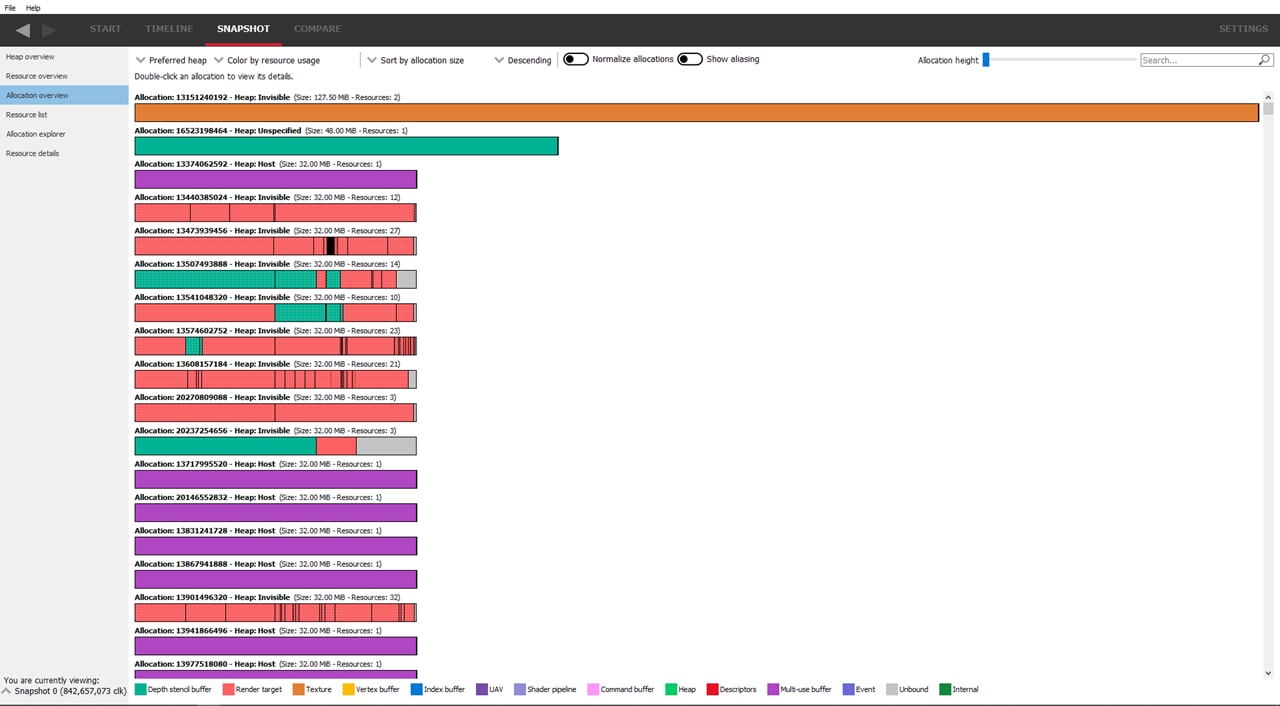
Simply scroll down to the allocation you’re interested in and adjust the allocation height so that the aliased resources can be seen easily. You’ll need a larger height for allocations with lots of aliasing. Clicking the ‘Normalize allocations’ toggle button will ensure that the allocation uses the maximum screen width available.
In the allocation explorer pane, The ‘Show aliasing’ will be grayed out if the allocation doesn’t contain any aliased resources. A quick aside here: a search box and a ‘Filter by size’ slider have been added for the allocations, allowing you to sort and search for specific allocations in the same way as searching for resources, seen below:
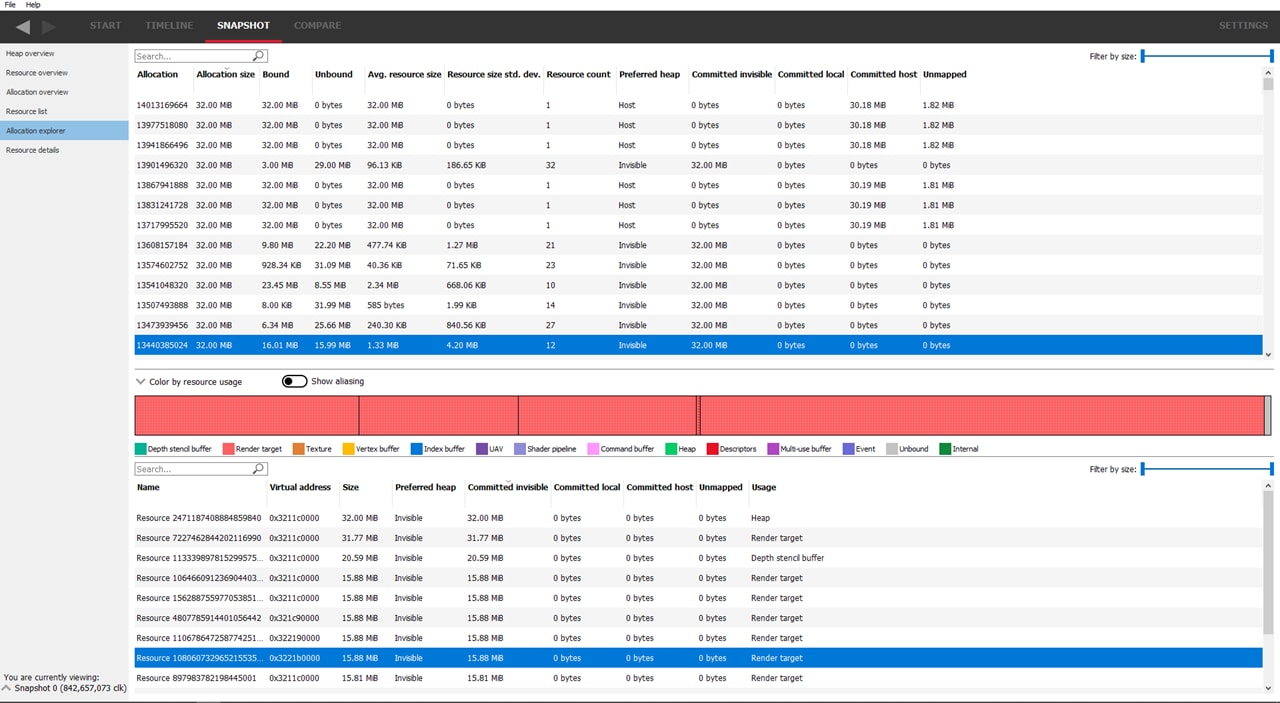
The height of the allocation can be changed by dragging the 2 horizontal splitter lines, which are above and below the allocation diagram, as seen below:
It is now possible to see the resource details from any resource displayed in the memory leak finder pane in the same way as in the resource list pane. Simply double-click on a resource and the display will jump to the resource details pane.
These are just the major highlights of what you can expect in RMV 1.1. There are many smaller enhancements as well as bug fixes, all designed to improve your experience.
You can find out more about RMV, including links to the release binaries on GitHub and the full release notes list, on our product page.
As always, please send us your feedback so that we can keep making RMV the very best developer-focused memory analysis tool for modern graphics work.
Your feedback is incredibly valuable to us and helps drive the RMV roadmap forward, so if you want something and it makes sense then just let us know!
