Enhancing AMD Radeon GPU Detective Output with DirectX Debug Information

Capture. Examine. Investigate. Now available as part of the AMD Radeon™ Developer Tool Suite.

Meet AMD Radeon™ GPU Detective (RGD), a powerful tool for developers to help with post-mortem analysis of GPU crashes.
Supports:
Important: To use AMD RGD, please make sure you have the AMD Software: Adrenalin Edition™ 25.10.2 driver or newer installed.
AMD Radeon™ GPU Detective allows you to easily and reliably capture AMD GPU crash dumps from your crashing DirectX® 12 and Vulkan® applications. A concise crash analysis report file will include detailed information that can help to narrow down the cause of the crash.
This command line tool makes the process simple with an intuitive and concise crash analysis summary and useful visualizations.
Capture AMD GPU crash dumps and generate crash analysis reports with ease.
AMD RGD ensures you can reproduce the crash with minimum impact on your runtime performance.
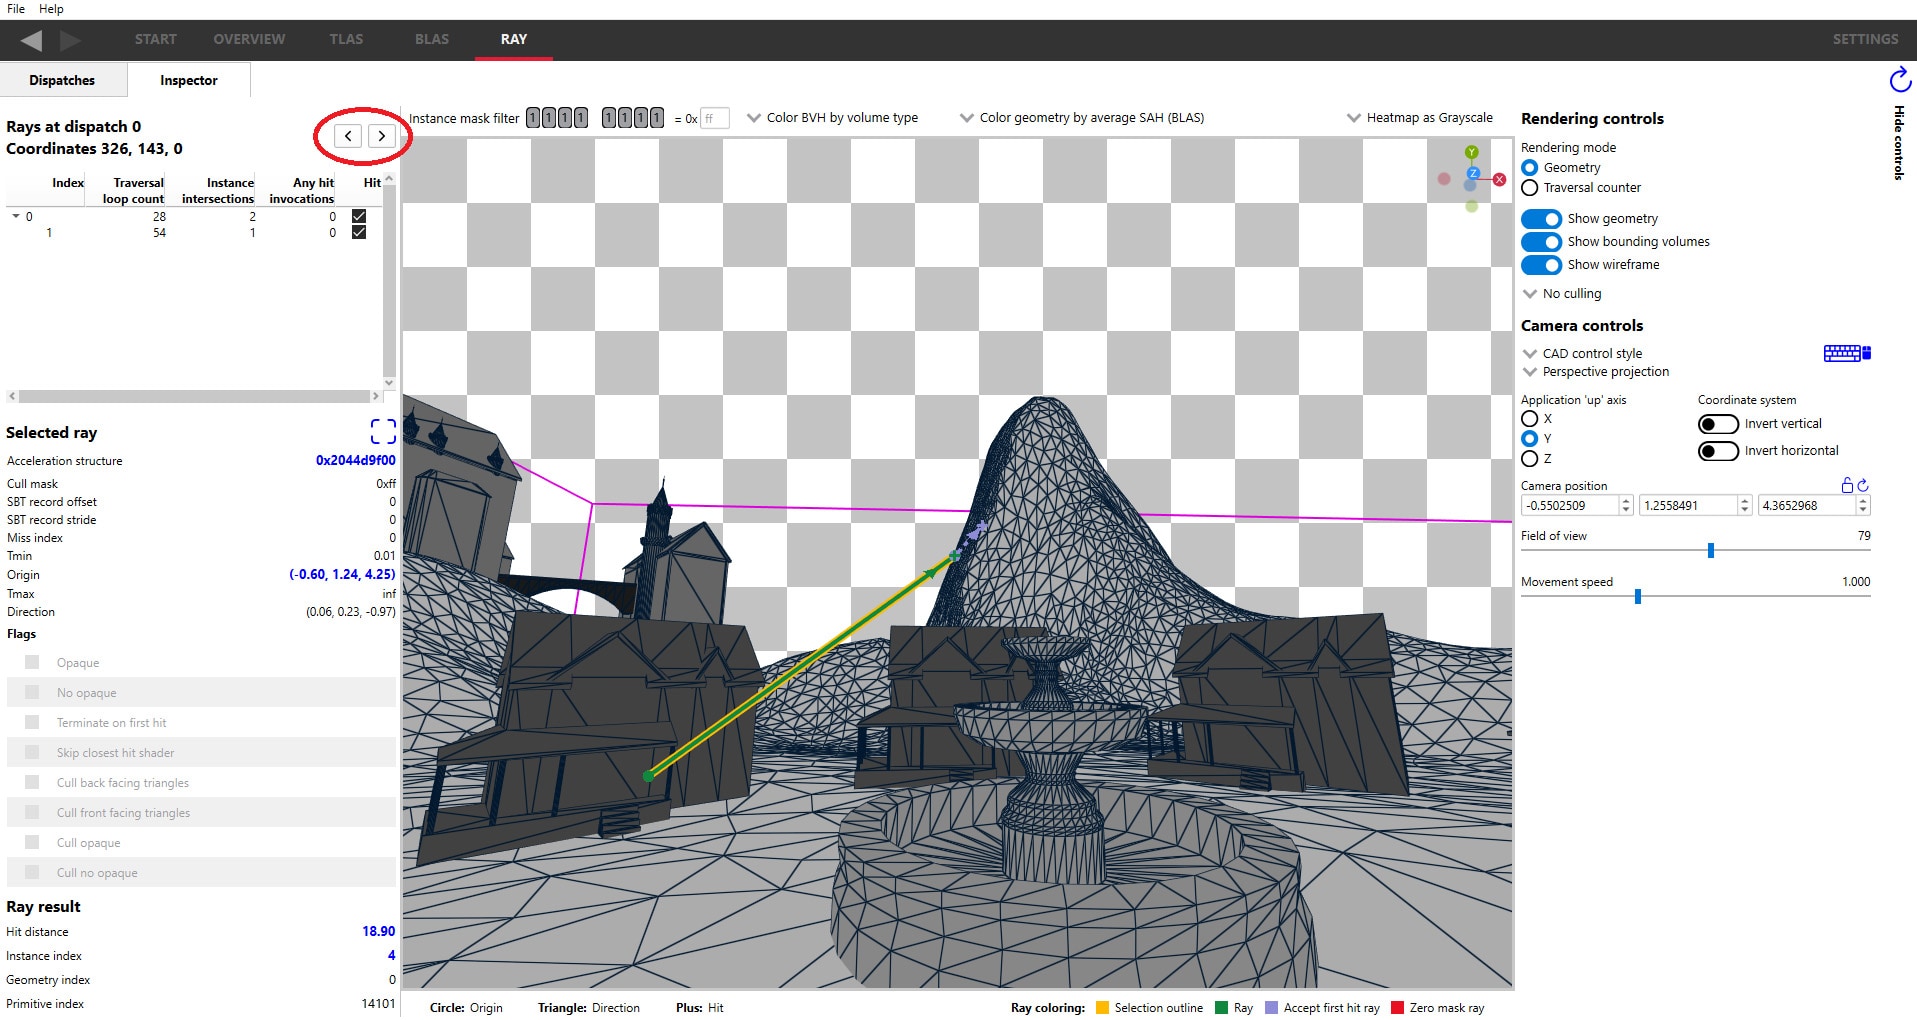
Understand the exact events which led to your crash using the execution marker tree. This tree visualizes the GPU work that was in progress in the moments leading to the crash.
You can insert user markers with custom strings in your code which will be presented in the crash analysis file.
Command Buffer ID: 0x617 (Queue type: Direct)=============================================[>] "Frame 362 CL0"├─[X] "Depth + Normal + Motion Vector PrePass"├─[X] "Shadow Cascade Pass"├─[X] "TLAS Build"├─[X] "Classify tiles"├─[X] "Trace shadows"├─[X] ----------Barrier----------├─[X] "Denoise shadows"├─[X] "GltfPbrPass::DrawBatchList"├─[X] "Skydome Proc"├─[X] "GltfPbrPass::DrawBatchList"├─[>] "DownSamplePS"│ ├─[X] ----------Barrier----------│ ├─[>] Draw(VertexCount=3, InstanceCount=1)│ ├─[>] Draw(VertexCount=3, InstanceCount=1)│ ├─[>] Draw(VertexCount=3, InstanceCount=1)│ ├─[>] Draw(VertexCount=3, InstanceCount=1)│ ├─[>] Draw(VertexCount=3, InstanceCount=1)│ └─[>] ----------Barrier----------├─[>] "Bloom"│ ├─[>] "BlurPS"│ │ ├─[>] ----------Barrier----------│ │ ├─[>] Draw(VertexCount=3, InstanceCount=1)│ │ ├─[>] Draw(VertexCount=3, InstanceCount=1)│ │ └─[ ] ----------Barrier----------│ ├─[ ] ----------Barrier----------│ ├─[ ] Draw(VertexCount=3, InstanceCount=1)│ ├─[ ] Draw(VertexCount=3, InstanceCount=1)│ ├─[ ] "BlurPS"│ ├─[ ] Draw(VertexCount=3, InstanceCount=1)│ └─[ ] ----------Barrier----------└─[ ] "Indirect draw simple"If a page fault is a suspect, check out the page fault summary section to begin your investigation.
This view provides details that can help to shed light on the crash cause, including the offending virtual address, a detailed list of the resources that have ever resided in that virtual address, with information that can help you identify the resources in your code, and a resource timeline that shows the events associated with these resources.
Timestamp Event type Resource type Resource identifier Resource size Resource name--------- ---------- ------------- ------------------- ------------- -------------00:00:00.1145408 Create Buffer 0xd9fb99b500000169 671088640 (640.00 MB) VidMemBuffer00:00:00.1154752 Bind Buffer 0xd9fb99b500000169 671088640 (640.00 MB) VidMemBuffer00:00:00.1154752 Make Resident Buffer 0xd9fb99b500000169 671088640 (640.00 MB) VidMemBuffer00:00:01.1202400 Evict Buffer 0xd9fb99b500000169 671088640 (640.00 MB) VidMemBufferAdded support for Hardware Crash Analysis on AMD Radeon™ RX 9060 GPUs and additional AMD Ryzen™ APUs with AMD RDNA™ 3.5 architecture graphics (AMD Radeon 820M, 840M, and 860M graphics, and AMD Radeon 8000S Series Graphics).
Added support for the ROG Xbox Ally X (requires AMD Radeon Developer Panel v3.4.2 or newer).
SGPR and VGPR collection for all active waves at the time of the crash.
Shader Resource Descriptor (SRD) Analysis for offending memory instructions.
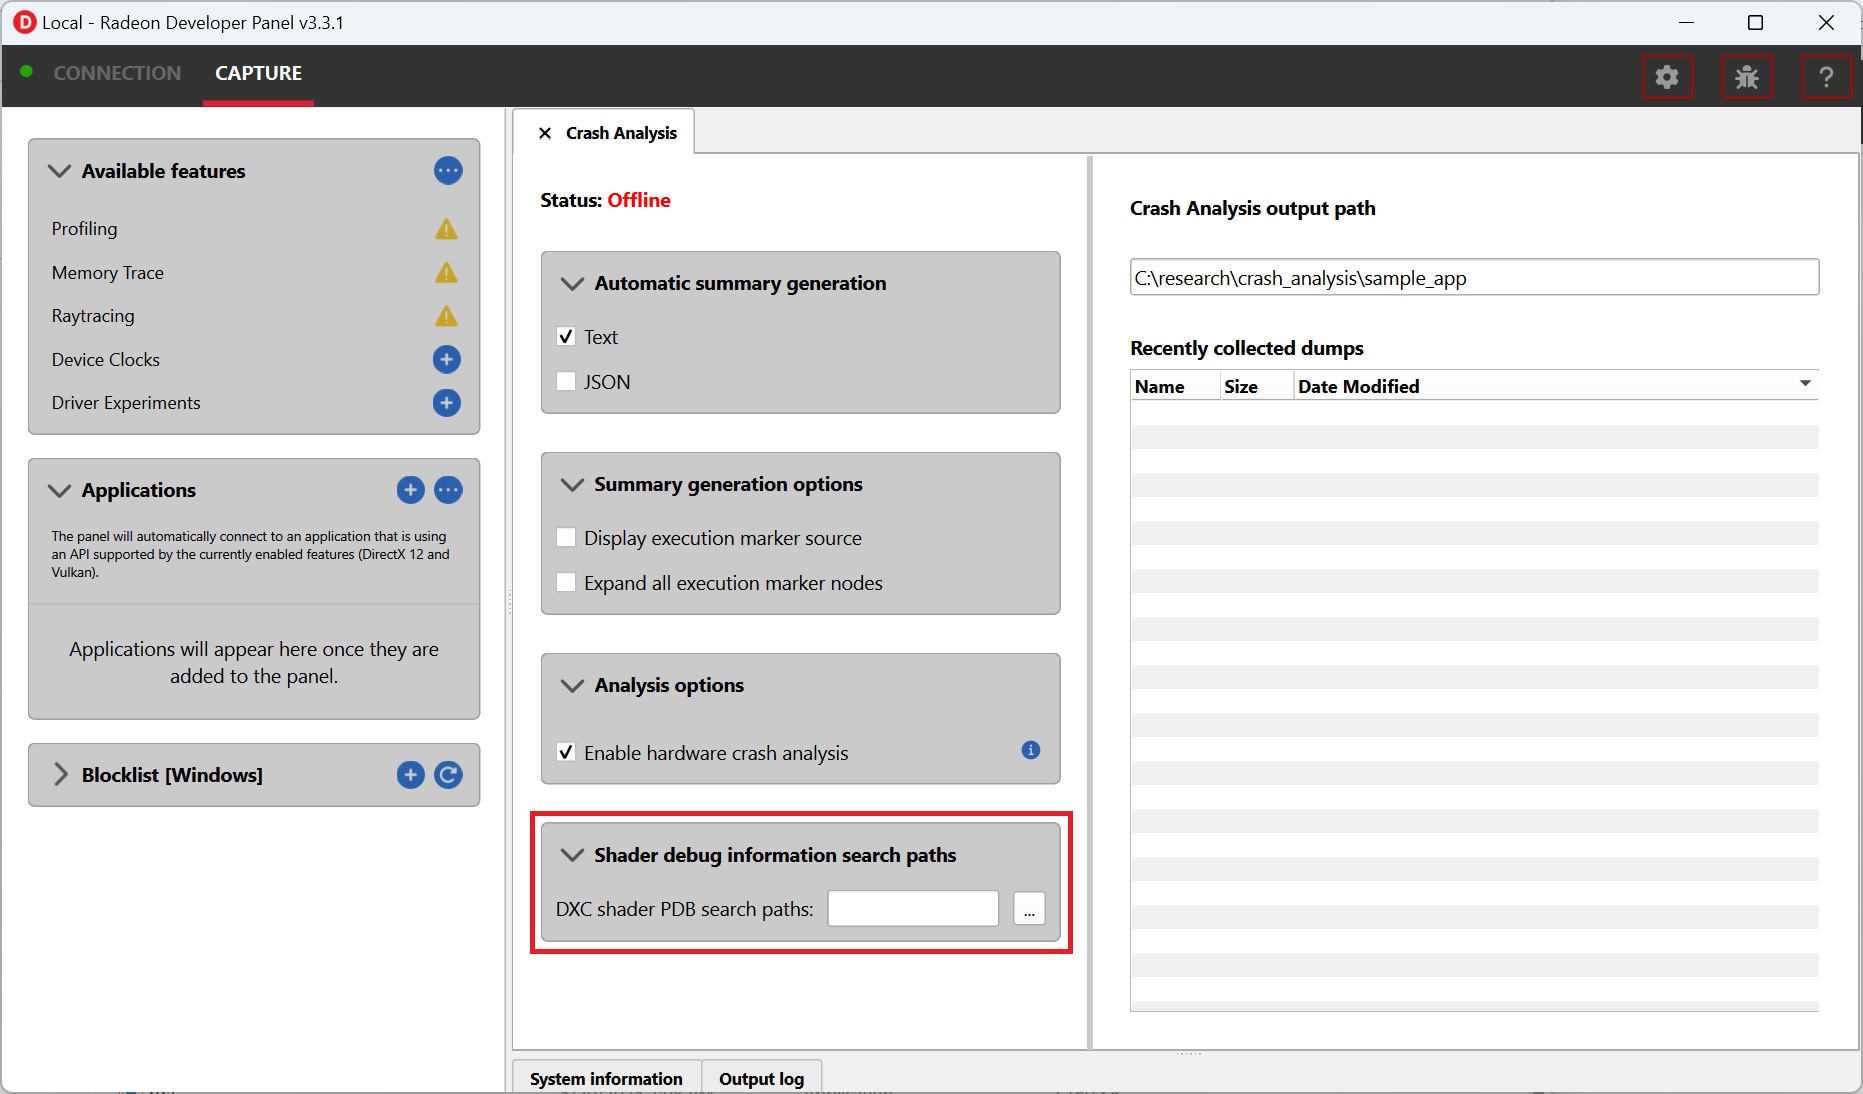
For more information about Shader Resource Descriptor (SRD) Analysis, please refer to the AMD RGD Documentation.
Bug and stability fixes.