
AMD Radeon™ GPU Profiler
AMD RGP gives you unprecedented, in-depth access to a GPU. Easily analyze graphics, async compute usage, event timing, pipeline stalls, barriers, bottlenecks, and other performance inefficiencies.
Performance Guide
On this page
Unreal Engine is a leading development environment for games, design visualizations, cinematics, and more. During development with Unreal Engine, as with any real-time application development, it is important to profile your application to ensure performance requirements are being met.
This guide is intended to provide practical advice for profiling and optimizing with Unreal Engine. This current version of the performance guide focuses on profiling and optimizing GPU performance.
You can find our FidelityFX Super Resolution Unreal Engine plugins at these links:
| Profiling in Unreal Engine | The profiling section begins with great advice on setting yourself up with an optimal profiling configuration, then goes on to cover topics including noise reduction, repeatable profiling, and built-in profiling tools. |
| Profiling with Radeon™ GPU Profiler (RGP) | The Radeon™ GPU Profiler (RGP) is our powerful profiling tool, which you can use with Unreal Engine. This section introduces RGP, explains how to use it with Unreal Engine to identify CPU vs GPU bottlenecks, and describes an example usage scenario based on our Unreal Engine case studies. |
| Optimizing in Unreal Engine | Learn some valuable general advice for optimizing your entire Unreal Engine frame from start to finish including the latest UE5 features: Nanite, Lumen, Virtual Shadow Maps, and Super Resolution Upscalers (TSR & FSR 3). As well as advice for optimizing UE’s legacy features: lighting and shading and geometry. |
| Other useful profiling tools | There are several, now deprecated, profiling tools included in older versions of Unreal Engine. This section describes these tools, and highlights some useful and relevant features. |
| Further reading | Discover more of our Unreal Engine content here on GPUOpen! |
The first question when profiling in UE is what build configuration should be used. When profiling the GPU, you want CPU performance to be fast enough to stay out of the way during profiling. Debug builds should be avoided for profiling, of course, because the engine code is not compiled with optimization enabled. Refer to the UE Build Configuration docs for detailed discussion of this topic.
Be aware that Development builds have higher CPU overhead than Test or
Shipping. Still, it can be convenient to profile Development builds
because it gives you full access to the console command configuration
interface (i.e. cvars), making it possible to iterate quickly when
experimenting to find optimal configuration changes. To reduce CPU
overhead in Development builds, you should turn off any unnecessary
processing on the CPU side and avoid profiling in the editor. The editor
can be made to run as the game using the -game command-line argument.
The following command line shows an example of using and disabling
Unreal Engine’s unnecessary CPU work:
UEEditor.exe ShooterGame -game -nosound -noailogging -noverifygcTest builds have lower overhead than Development, while still providing some developer functionality. Test builds of a stand-alone executable require cooked content. If you need to iterate while profiling, but want the lower CPU overhead of a Test build, consider using “cook on the fly” (COTF). For example, shader iteration is possible with COTF Test builds.
Also note that in some older versions of Unreal Engine, you may have to
manually enable the STATS macro in Build.h to add support for the stat GPU console command. Also, older versions of UE may require you to
enable the
ALLOW_PROFILEGPU_IN_TEST macro in Build.h so that the ProfileGPU command
is available. More details will be given on stat GPU and ProfileGPU in
the Profiling tools section.
When attempting to optimize the execution time of a workload, we need to be able to reliably measure the time a certain workload takes. These measurements should have as little noise as possible. Otherwise, we cannot tell whether it ran faster because of our optimization or because some random number generator decided to spawn fewer particles (for example).
UE has some built-in functionality to help with this. The -benchmark
command-line argument causes UE to automatically change certain settings
to be more friendly to profiling. The -deterministic argument causes the
engine to use a fixed timestep and a fixed random seed. You can then use
-fps to set the fixed timestep and -benchmarkseconds to have the engine
automatically shut down after a fixed number of timesteps.
Below is an example of using these arguments with a Test build of the Infiltrator demo:
UEGame-Win64-Test.exe "..\\..\\..\InfiltratorDemo\InfiltratorDemo.uproject"-nosound -noailogging -noverifygc -novsync -benchmark-benchmarkseconds=211 fps=60 -deterministicIn the above example, -benchmarkseconds is not wall-clock seconds
(unless every frame of the demo runs at exactly 60 fps). Rather, it runs
211x60=12,660 frames using a fixed timestep of 1/60=16.67 milliseconds. This means that, if you have your project set up to run a camera flythrough on startup, it will advance through the flythrough using fixed timesteps and a fixed random seed. It will then shutdown automatically after a fixed number of frames. This can be useful in gathering repeatable average frame time data for your level.
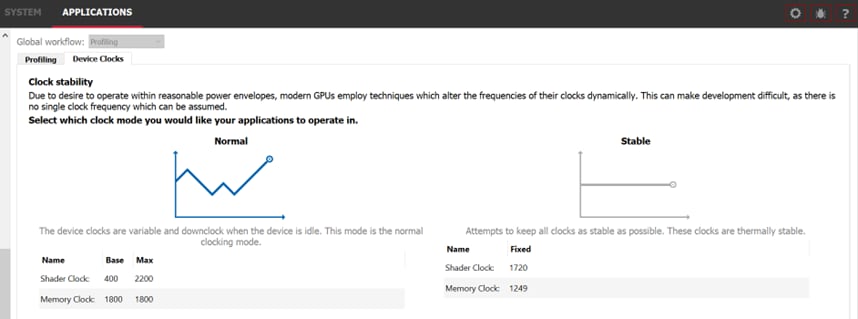
Another technique for helping reduce noise in profile results is to run with fixed clocks. Most GPUs have a default power management system that switches to a lower clock frequency when idle to save power. But this trades lower power consumption for performance and can introduce noise in our benchmarks, as the clocks may not scale the same way between runs of our application. You may fix the clocks on your GPU to reduce this variance. Many third-party tools exist, but the Radeon Developer Panel that comes with the Radeon GPU Profiler has a Device Clocks tab under Applications which, after the panel has hooked into an application, can be used to set a stable clock on AMD RDNA™ GPUs, as shown below:
Getting back to reducing variability in UE, you may find that some
things do not obey the fixed random seed from the -deterministic
command-line argument. This was the case for some particles in the
Infiltrator demo. These particles were causing a noticeable amount of
noise in our benchmarks.
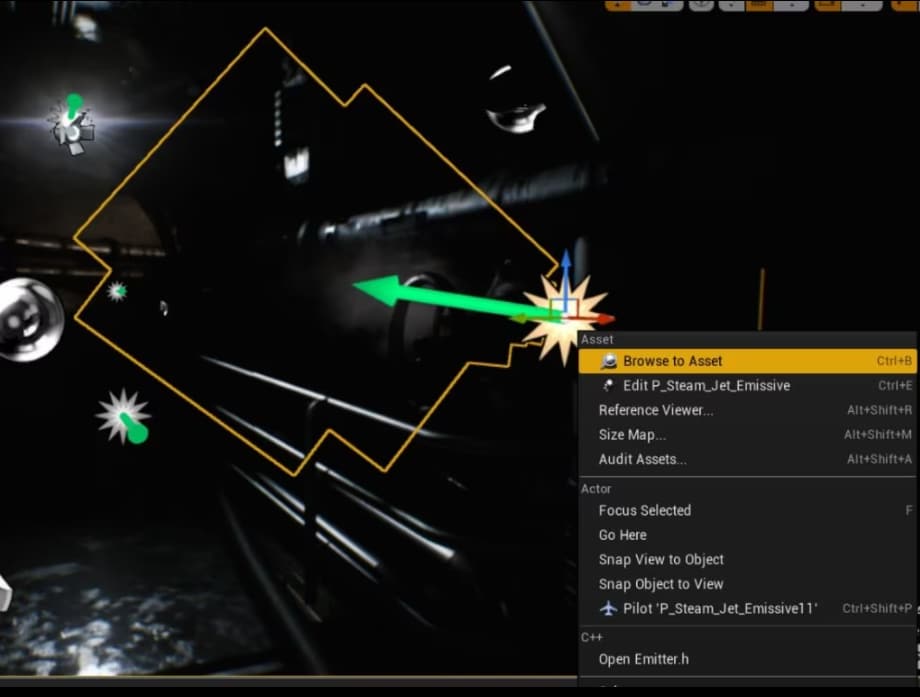
The solution to reducing particle noise is to make the Random Number Generators use a fixed seed. This is how you make the particles deterministic in just two clicks:
Right click on the emitter of particles and then click on “Browse to Asset”
Once the emitter asset gets selected in the Content Browser, right click on it and select “Convert To Seeded”
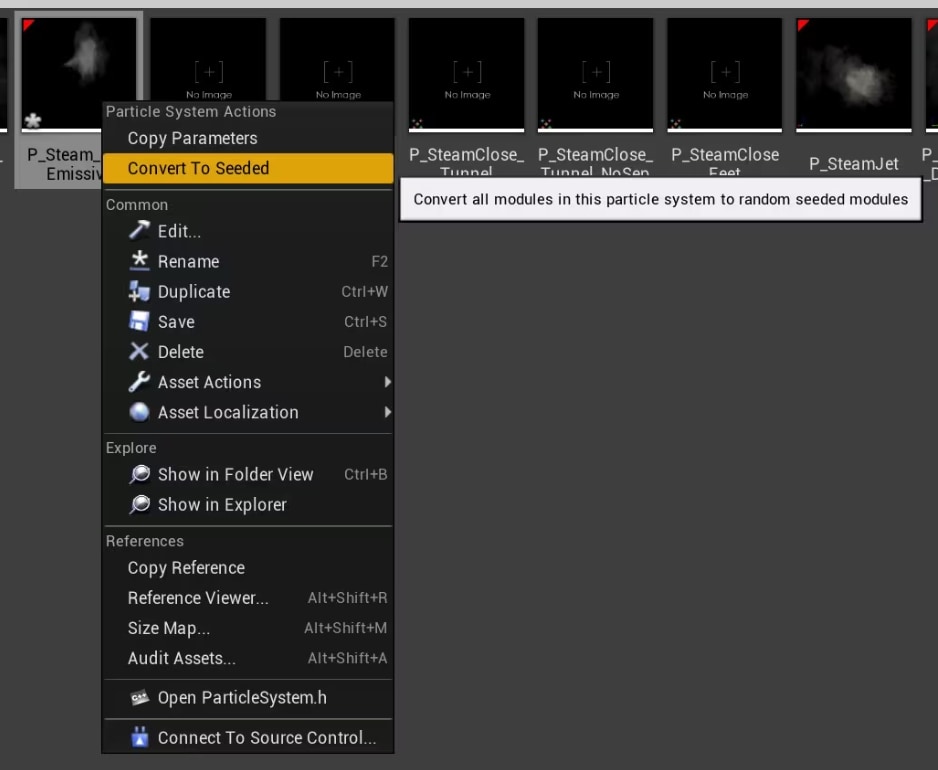
That’s it! You can also select all your emitters in the Content Browser and convert them all at once. When that has been done the noise will be much reduced and it should be very easy to evaluate your optimizations.
Note: If you are using Niagara particles, look for “Deterministic Random Number Generation in Emitter settings” in the official UE docs:
https://docs.unrealengine.com/en-US/emitter-settings-reference-for-niagara-effects-in-unreal-engine/
One way to profile is by going to the same location in your level.
A Player Start actor can be used to spawn directly to a specific location upon launch. This can be dragged into the scene through the editor.
If you have no way to change the scene in editor mode, or would like to teleport while in-game, then you can use the UCheatManager BugIt tools.
Note: BugIt tools are only available in non-shipping builds.
To teleport using BugIt:
showlog .BugIt into the console. The first line in the output string should look like this: BugItGo x y z a b c .
This BugItGo command can be pasted into the console to teleport to the current location from anywhere.A fixed camera flythrough path is a great way to create a deterministic,
but dynamic scene that better represents your game’s performance, but in
a way that is consistently repeatable and thus more conducive to testing
performance enhancements. To start creating a flythrough path, with your
game project open in the UE editor, at the top of the main editor
window, select  Cinematics->Add Level
Sequence. You’ll be prompted to give the sequence a name and save it to
location within your project’s folder structure. This will open the
Sequencer controls. The first step will be to move your current
viewpoint to the location where you want the flythough path to start,
then click the
Cinematics->Add Level
Sequence. You’ll be prompted to give the sequence a name and save it to
location within your project’s folder structure. This will open the
Sequencer controls. The first step will be to move your current
viewpoint to the location where you want the flythough path to start,
then click the ![]() Camera icon button in the
Sequencer controls, which will create a new camera and set it as the
current camera cut. Then begin by creating the first the keyframe of
your flythrough by clicking the ’+’ (plus) buttons next to various
camera settings in the Sequencer control UI.
Camera icon button in the
Sequencer controls, which will create a new camera and set it as the
current camera cut. Then begin by creating the first the keyframe of
your flythrough by clicking the ’+’ (plus) buttons next to various
camera settings in the Sequencer control UI.
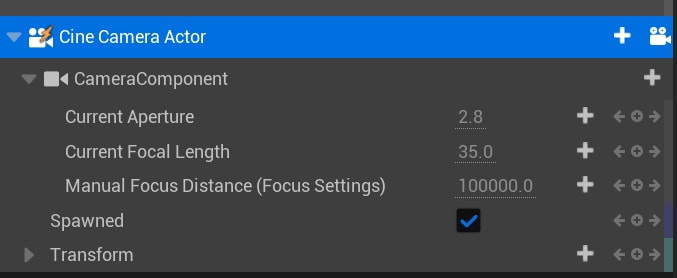
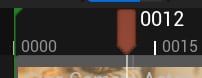
Then proceed to create as many other keyframe locations as desired by moving your viewpoint to a new location, then moving the track time to your desired location in the timeline for the keyframe to exist, and clicking the Transform ’+’ button to save the orientation of the viewpoint to a keyframe.
Continue doing this until you have completed your flythrough sequence. At any time during the sequencing, you can press the space bar to play the keyframe sequence as an animation. Finally, you need to create a trigger actor to cause the sequencer animation to start when running the game. This can be done with UE’s blueprint scripting tool, which is outside the scope of this guide, but a quick internet search will most likely reveal tons of tutorial videos if you aren’t familiar with the triggers and/or blueprints in UE.
Optimizing an effect requires trying many experiments, and every iteration takes time. We need to rebuild the game, cook the content, etc. UE features like cook on the fly (COTF) can help with this. But it can also be useful to isolate the effect or technique you are optimizing into a small application.
If only we could generate such an app easily! Fortunately, Unreal comes with a feature called Migrate for that. It extracts a certain asset with all its dependencies and will import it in any other project. In this case, for the sake of creating a small app, we would migrate the effect into an empty project.
Official documentation on migrating assets: https://docs.unrealengine.com/en-US/migrating-assets-in-unreal-engine
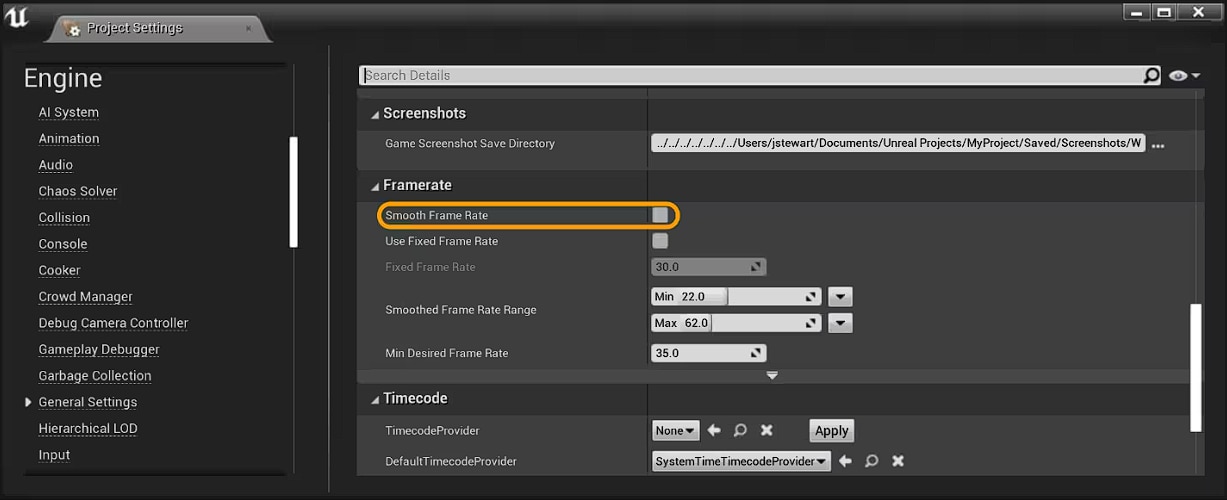
Now that your build is ready for profiling, you should sanity check a
few things before getting started. First, ensure Frame Rate Smoothing is disabled. It is disabled by default starting in UE4.24, but it is good to double check. In the editor, you can check in Edit->Project Settings…->Engine ->General Settings->Framerate as shown below:
Alternatively, you can ensure bSmoothFrameRate is set to false
everywhere it appears in Engine\Config\BaseEngine.ini and your project’s
DefaultEngine.ini. You can also add bForceDisableFrameRateSmoothing=true
to the \[/Script/Engine.Engine\] section of your project’s DefaultEngine.ini.
Next, turn off VSync. One way to do this is with the -novsync
command-line parameter. Adding this to our previous example gives the
following:
UEEditor.exe ShooterGame -game -nosound -noailogging -noverifygc -novsyncLastly, run your build and verify your resolution in the log file.
Resolution is, of course, one very important factor in GPU performance, and it is worth verifying that it is what you expect. Open the log file for your build and look for a line like the following:
LogRenderer: Reallocating scene render targets to support 2560x1440Other command line parameters to consider using for consistent profiling:
| Parameter | Description |
|---|---|
| -noailogging | Disable AI logging |
| -nogpucrashdebugging | Disable logging of GPU crash dumps |
| -nomcp | Disable multi-player. |
| -noscreenmessages | Disables all debug text messages on screen. |
| -noverifygc | Skips garbage collector safety check. |
| -nothreadtimeout | Disable the check for a locked rendering thread. |
| -unattended | Prevents pop up dialogs. |
Unreal Engine has several tools, both external and in-game, for
measuring performance. Epic provides an external tool called Unreal
Insights, which can be found in the engine’s Engine\Binaries\Win64
folder. To use it, start UnrealInsights.exe, and then start your game.
Your game most likely will connect and start sending performance data to
the Unreal Insights application automatically (if so, you will see a
“Live” entry in the list of traces in the Unreal Insight app’s window),
but you may have to kickstart your game’s tracing by running this
command from its console command line:
Trace.Send 127.0.0.1
Once performance data has begun to flow, you can use these two commands to start and stop it:
Trace.Pause
Trace.Resume
Refer to the Unreal Insights documentation for complete details on using this tool to measure performance.
Unreal Insights is great because it tracks thousands of performance metrics across multiple frames and displays it in a very useful interactive graph format, but sometimes you want to see performance information displayed in real-time in the game itself. Fortunately, UE provides several stat console commands to do just that. Some of the most useful include:
| Command | Description |
|---|---|
stat fps | Unobtrusive view of frames per second (FPS) and ms per frame. |
stat unit | Display timings for all major engine threads. This is possibly the most important command and it can allow you to know if you are CPU or GPU bound. |
stat gpu | Provides a general overview of GPU performance, including frame time, draw call count, and triangle count. By monitoring these metrics, potential bottlenecks can be identified and overall GPU load can be assessed. You should set r.GPUStatsEnabled 1 for this to work. |
stat scenerendering | This is similar to stat gpu but it provides a more high-level break-down of the frame, including things like present time, mesh draw calls and so on. |
stat nanite | Displays statistics related to Nanite’s rendering, triangle count, and instance count. Interpreting these metrics can help understand the performance impact of Nanite Virtualized Geometry and identify potential optimization opportunities. For more detailed Nanite stats use: nanitestats |
stat rhi | Shows memory counters, useful for debugging memory pressure scenarios. |
Please refer to UE’s documentation for a full description of all stat commands.
The tools described above are great for quantifying your performance and identifying problem areas, but to really analyze and understand what those problem areas are doing and why they are taking as long as they are, you should use AMD’s Radeon™ GPU Profiler (RGP).
RGP is a ground-breaking low-level optimization tool that provides detailed information on Radeon™ GPUs.
To analyze performance with RGP you must first configure your UE game to
use either the D3D12 RHI or the Vulkan RHI. This guide will use D3D12
for its examples. You can invoke the D3D12 RHI either by running the UE
executable with the -d3d12 command-line argument or by changing the
default RHI in the editor: Edit->Project
Settings…->Platforms->Windows->Default RHI to DirectX 12.
Also, it is a good idea to enable UE’s RGP debug markers, by
uncommenting the following line in ConsoleVariables.ini:
D3D12.EmitRgpFrameMarkers=1This ensures that any UE code wrapped in a SCOPED_DRAW_EVENT macro
appears as a useful marker in the RGP capture.
Note: if you are using a Test build, either ALLOW_CHEAT_CVARS_IN_TEST in Build.h
so that ConsoleVariables.ini will be used in Test builds or add
[ConsoleVariables] section to your project’s DefaultEngine.ini:
[ConsoleVariables]D3D12.EmitRgpFrameMarkers=1Also, in order to get the most accurate performance timing, set r.ShowMaterialDrawEvents to 0. You need to make this change after your game or project is up and running. This is due to a startup hook in the Unreal Engine source code that is intended to configure the engine for GPU capture debugging. Setting the r.ShowMaterialDrawEvents cvar to 0 prevents debug markers from being emitted for individual material draw events, which can add a signficant amount of CPU and GPU overhead to those events, potentially resulting in less accurate timing results in the RGP capture. Similarly, it’s a good idea to set r.RHICmdBypass to 0 and r.RHIThread.Enable to 1, again at runtime, because these cvars are also overriden by the GPU capture debugging startup hook and can have a detrimental effect on RGP performance timing.
An easy modification can be applied to the UE source code to eliminate the need to set these variables at runtime. In the function FD3D12Device::SetupAfterDeviceCreation(), delete the code that looks like this:
// AMD RGP profilerif (GEmitRgpFrameMarkers && FD3D12DynamicRHI::GetD3DRHI()->GetAmdAgsContext()){ // Running on AMD with RGP profiling enabled, so enable capturing mode bUnderGPUCapture = true;}This will prevent the engine from overriding those settings at startup.
When getting started with performance profiling in UE, it is important to know where the primary performance bottlenecks are when running on the target platform. Depending on whether the bottleneck lies on the CPU or GPU, we may go in orthogonal directions with our performance analysis.
After taking a performance capture with the Radeon™ Developer Panel (RDP), these details are available in the Radeon GPU Profiler (RGP) from the Overview->Frame Summary view.
The following shows an extreme CPU-bound example, created by adding CPU busy work to UE, followed by a GPU-bound scene.
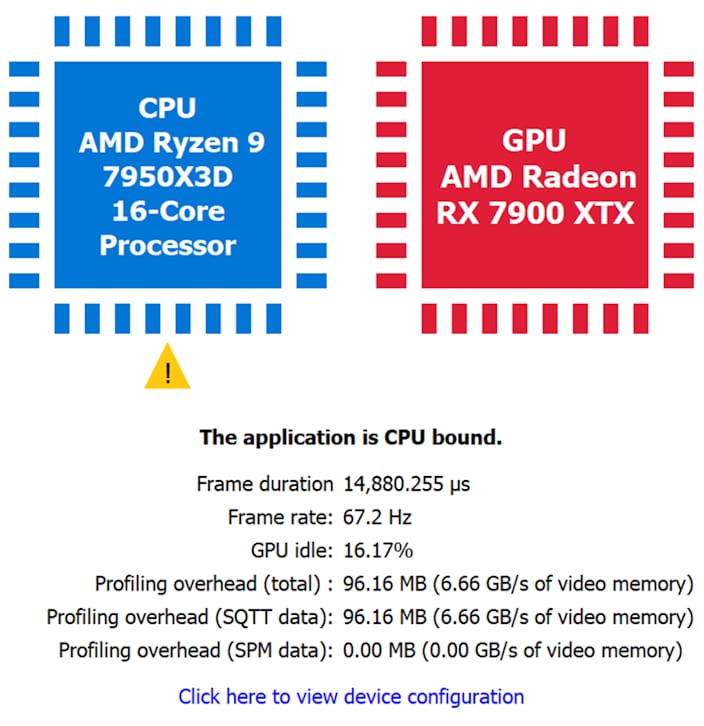
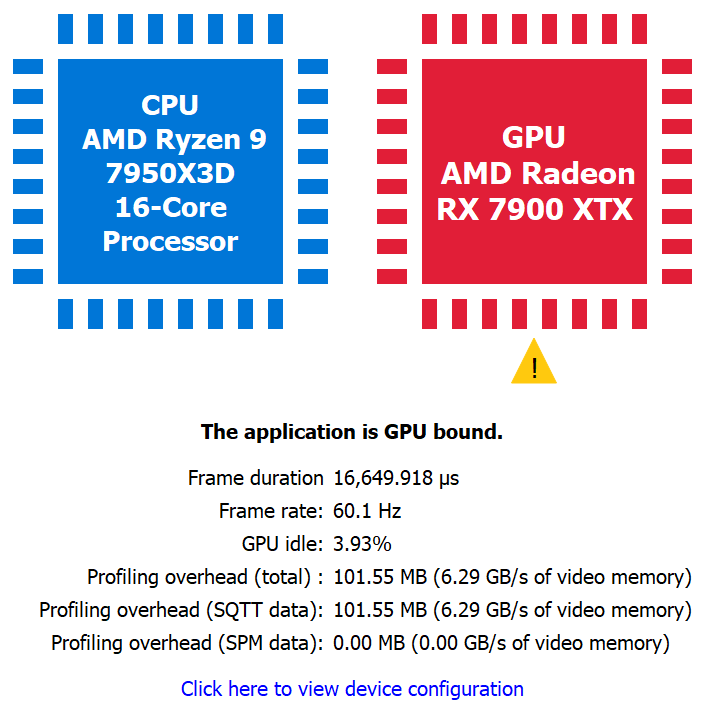
A good sanity test to check if the application is indeed CPU bound is to
scale up the render resolution. For example, if the GPU workload is
increased by setting r.ScreenPercentage from 100 to 150 and RGP shows
the same CPU bound result as before, that is a strong indication the app
is thoroughly CPU bound.
Once we determine if we are GPU-bound or CPU-bound, we may decide to diagnose further with RGP (if we are GPU-bound) or switch to other tools like AMD uProf (if we are CPU-bound). As mentioned earlier, this version of the guide is focused on the GPU, so we will now discuss how to determine where the GPU’s time is being spent.
This section uses one of our case studies in optimizing Lumen performance to demonstrate using RGP to profile. This example reduces frame time by 0.3ms (measured on Radeon 7900XTX at 4K). This may not seem like much at first, but if you are targeting 60fps for your game, 0.3ms is roughly 2% of your 60-Hz frame budget.
After taking a performance capture with RDP, these details are available
in RGP from the Events->Event Timing view. If you are emitting RGP
perf markers, you can quickly navigate to the marker that we are
investigating by searching for SupportImportanceSampleBRDF.

We can see that the ExecuteIndirect() call takes 0.8ms to complete. We
can do better!
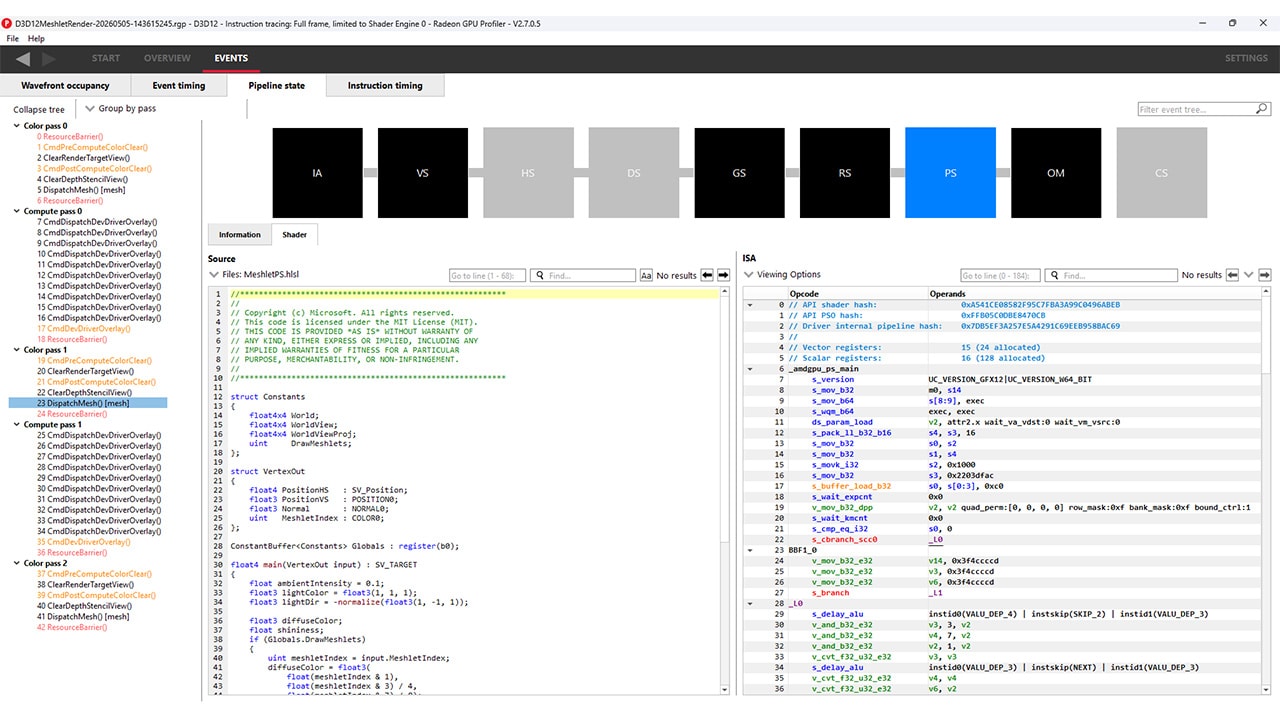
To inspect the details of the ExecuteIndirect command running on the GPU, right-click on the command and select View in Pipeline State. This view reveals that the ExecuteIndirect command translates to a compute Dispatch command.
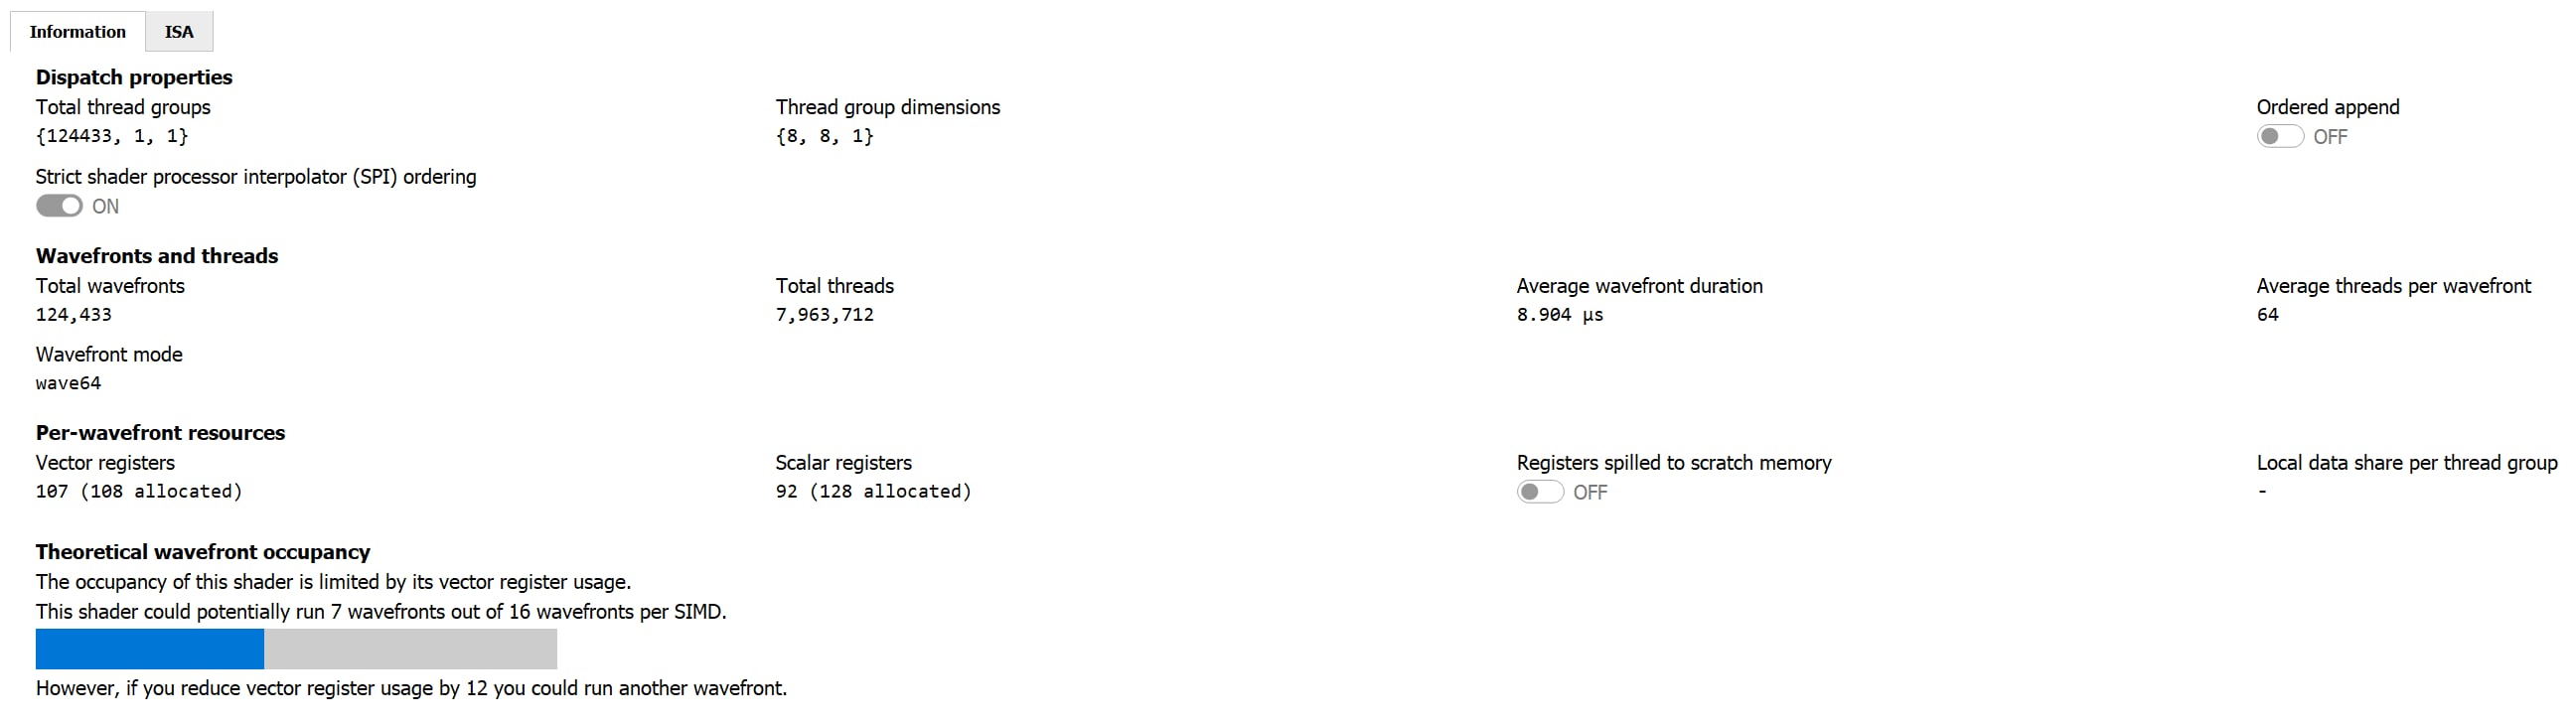
We can see the VGPR and SGPR usage information, as well as many useful wave and thread execution stats. The Pipeline state’s Information tab shows that our compute shader is only running at most 7 wavefronts due to its VGPR usage. On RDNA GPUs and above, this kind of GPU workload will execute in ‘partial waves’ which means the GPU is being underutilized.
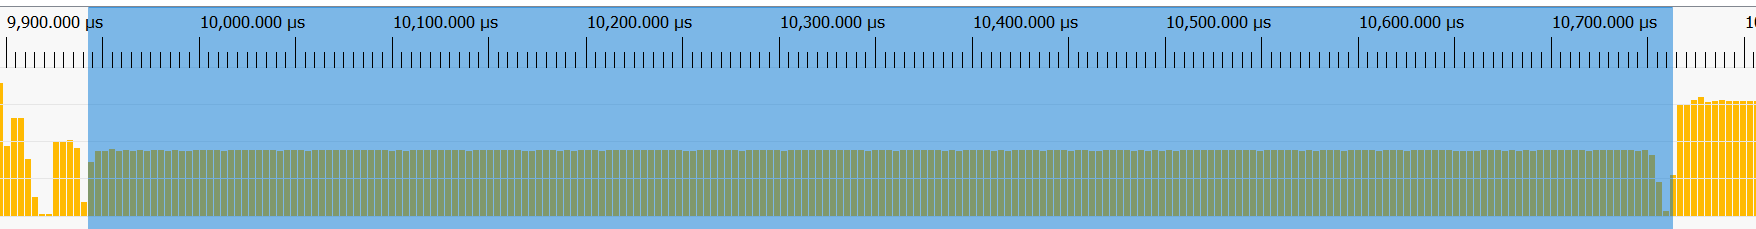
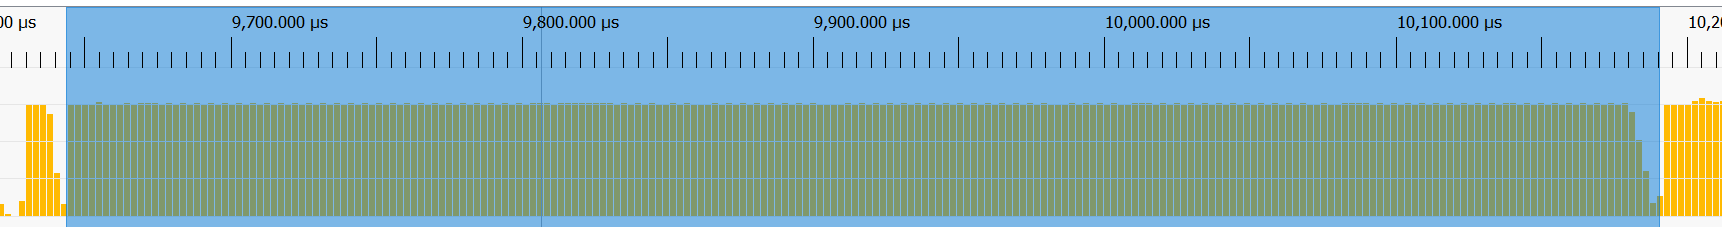
The Wavefront occupancy tab displays the SupportImportanceSampleBRDF
compute shader as a series of yellow bars. We can highlight these bars
by double clicking the event in the event timeline display below the
wavefront graph.
We can further dig into the performance of this compute shader by selecting the Instruction Timing tab. This display provides the exact shader instructions that are executed on the GPU hardware and the percentage of clocks each instruction takes relative to the other instructions, which can be useful for identifying bottlenecks.
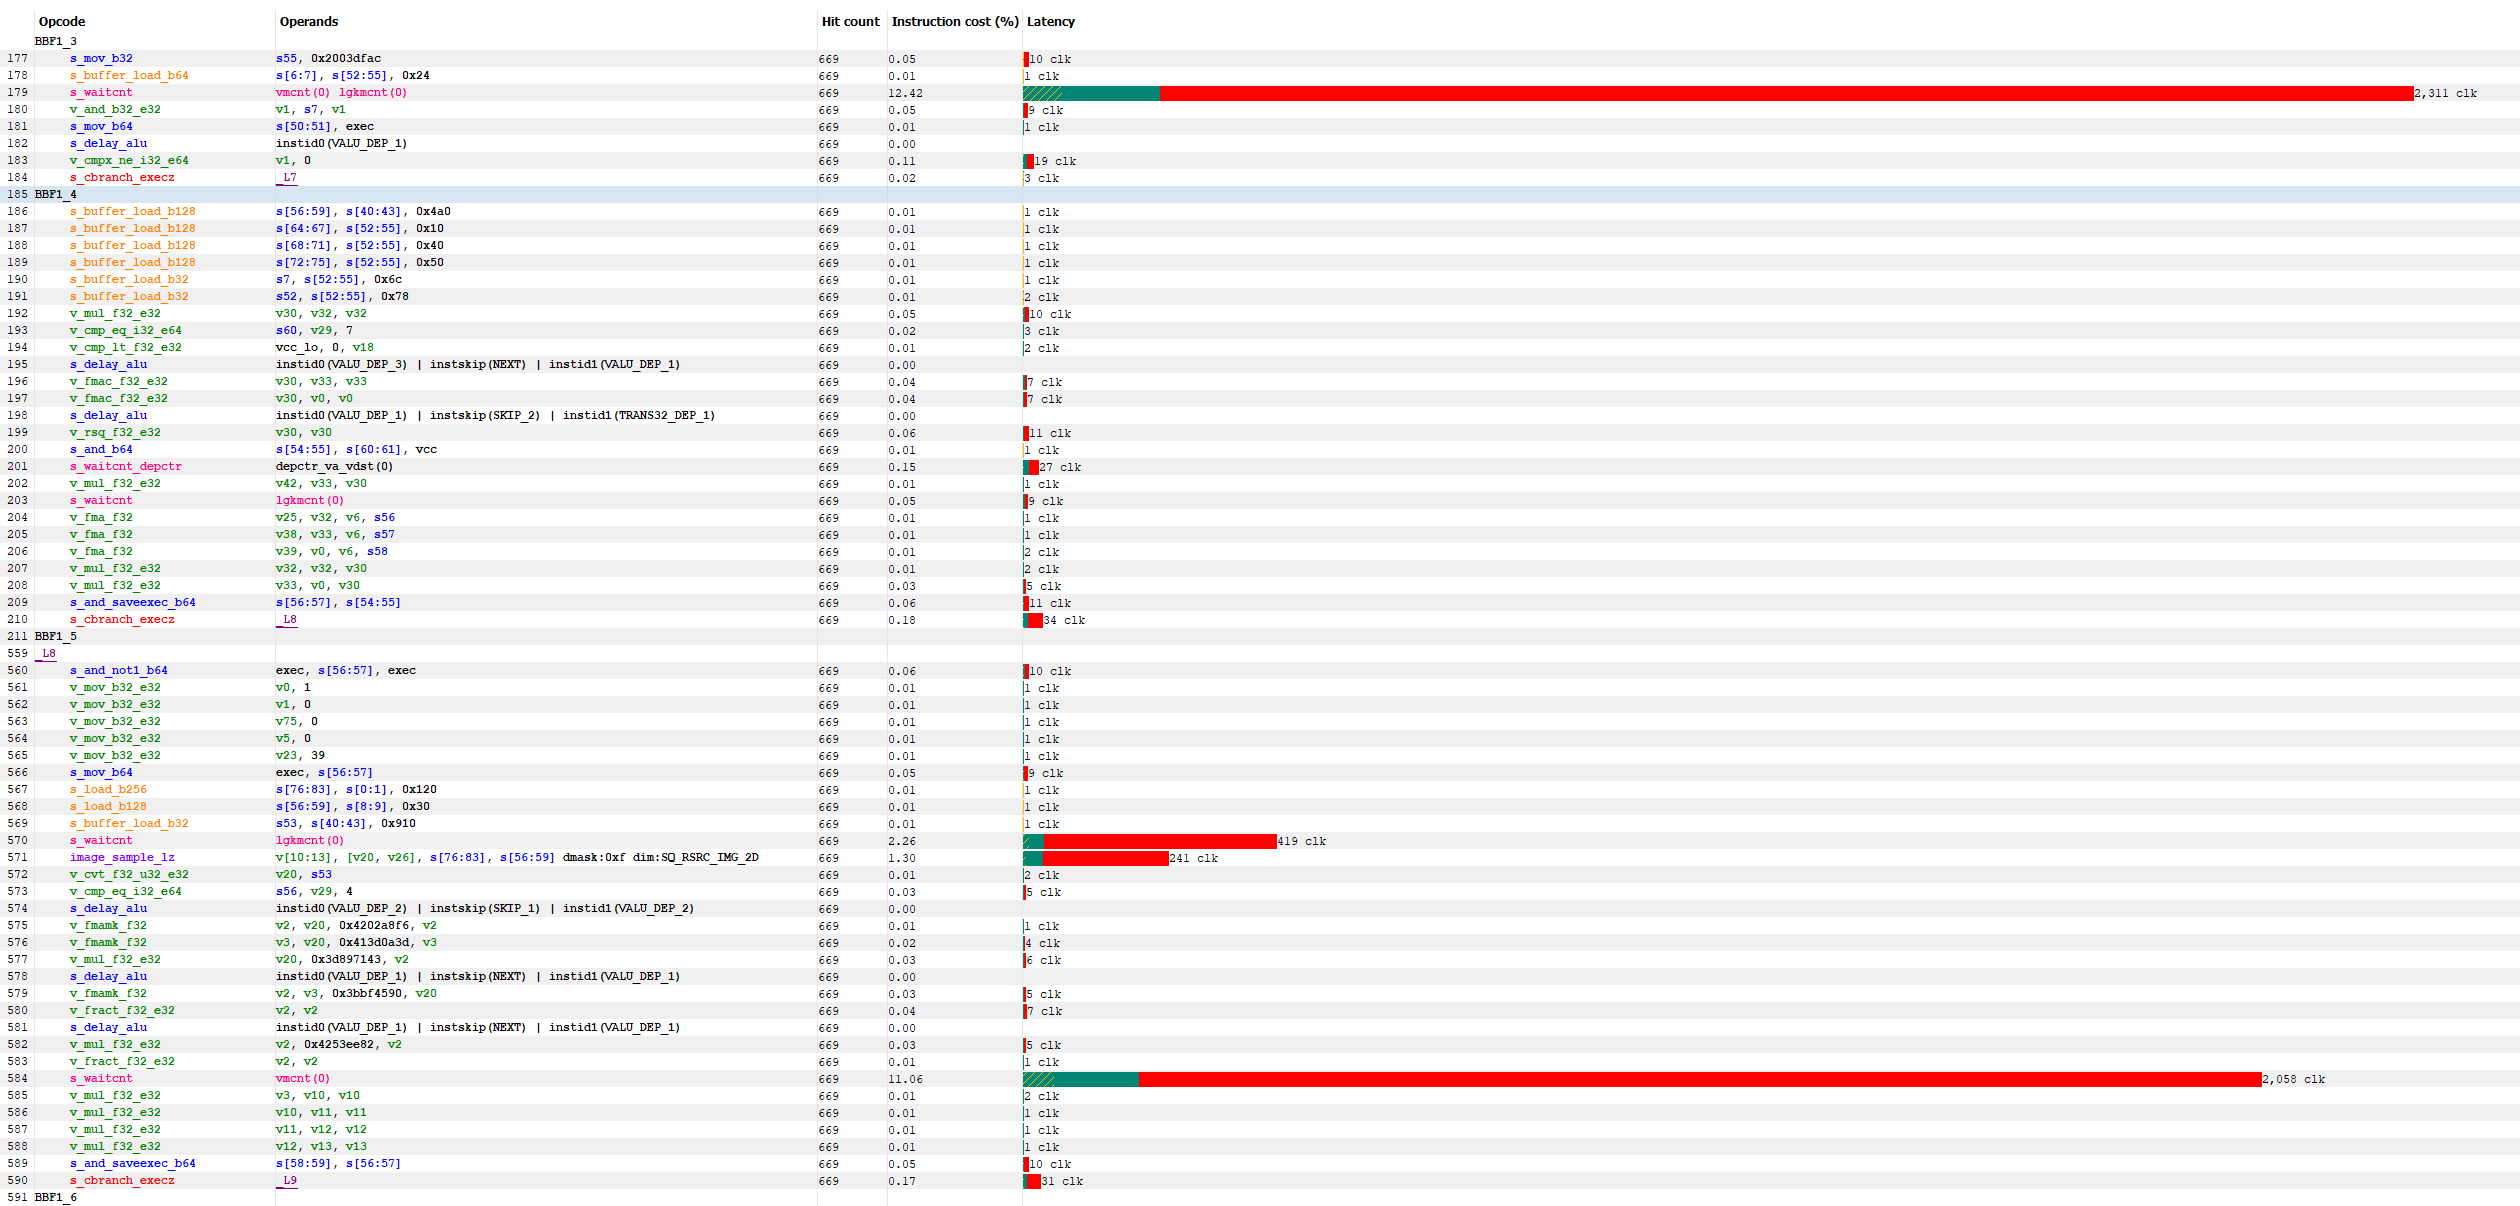
The ISA view is also useful for other optimizations like scalarization, which are not covered here (see Intro to GPU Scalarization for more info on that subject).
Next, we can enable our configuration change via the command console to see the performance impact:
r.Lumen.ScreenProbeGather.StochasticInterpolation 1The StochasticInterpolation cvar parameter causes the
LumenScreenProbeGather/SupportImportanceSampleBRDF shader to
stochastically select a screen probe from the nearest four to the
current pixel, whereas setting it to 0 computes the bilinearly
interpolated value from the four nearest probes. You might think this
would dramatically impact the quality of the Lumen lighting, but in
practice that is often not the case.
After taking another performance capture with RDP and going back to the Event Timings view in RGP:

The time taken for the dispatch is now 0.55ms - for a 30% performance uplift! The reason for this performance gain is due to increased occupancy from reduced VGPR requirements and reduced texture bandwidth requirements due to fewer reads of the screen probe texture, which leads to better hardware utilization, which we can see on the right most tab of the Instruction timing tab:
| Before | After |
|---|---|
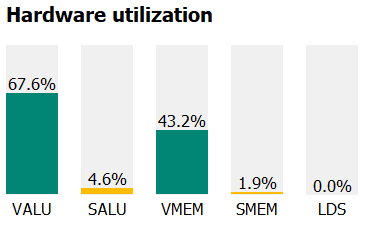 | 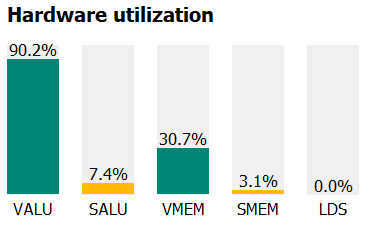 |
In addition, we can see on the Wavefront Occupancy and the Pipeline State tabs that our compute shader maintains its max possible occupancy of 12 wavefronts for most of its execution.
This section presents general advice for the optimization of your content and shaders in UE. Of particular interest are the exciting and groundbreaking new features of Unreal Engine 5, including Nanite and Lumen, as well as Virtual Shadow Maps and several upscaling technologies available for UE5, including Temporal Super Resolution and FSR 3. AMD’s Dev Tech team has done extensive testing of these new features to understand how to get the best possible performance from them on AMD RDNA 3 GPUs.
Nanite is Unreal Engine’s powerful new geometry engine which provides pixel scale detail and fine grained, fully automatic level of detail control. This is accomplished by implementing culling and rasterization of small primitives using compute shaders rather than the hardware’s fixed function capabilities.
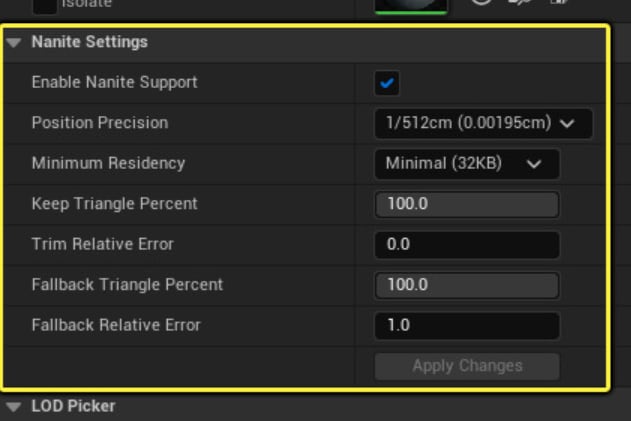
Testing of Nanite on AMD hardware shows that the two play quite nicely with each other. We recommend pushing your Nanite triangle density higher on RDNA 3 GPUs. When authoring Nanite assets you can control their density via the Position Precision and Keep Triangle Percent parameters.
However, you must balance higher triangle density with the material
density. Lots of small Nanite triangles with very few materials is more
performant than lots of small Nanite triangles with many different
materials. The Nanite Visualization->Material ID and Nanite
Visualization->Material Complexity view modes provide a convenient way
to identify this type of performance problem in your project. To enable
the Nanite Material Complexity view mode you must set
r.Nanite.Visualize.Advanced to 1.
Another factor to consider is the proportion of hardware rasterized
primitives versus software rasterized primitives. Nanite’s heuristic for
controlling this proportion is r.Nanite.MinPixelsPerEdgeHW cvar. On
7900XTX we have found that a value of 32 works well, but ideally you can
tune this parameter by platform or as a performance quality setting. You
can use the Nanite Visualization->Raster Mode view mode to inspect
how the MinPixelsPerEdgeHW cvar changes the ratio of HW to SW rasterized
primitives. To enable Nanite Raster Mode view mode you must set
r.Nanite.Visualize.Advanced to 1.
For more details on optimizing your Nanite content refer to the official documentation.
Unreal Engine 5 also introduced a new global illumination and reflections system called Lumen. Lumen is extremely powerful and highly configurable. We’ve done a lot of work to identify optimal settings that balance visual fidelity with performance.
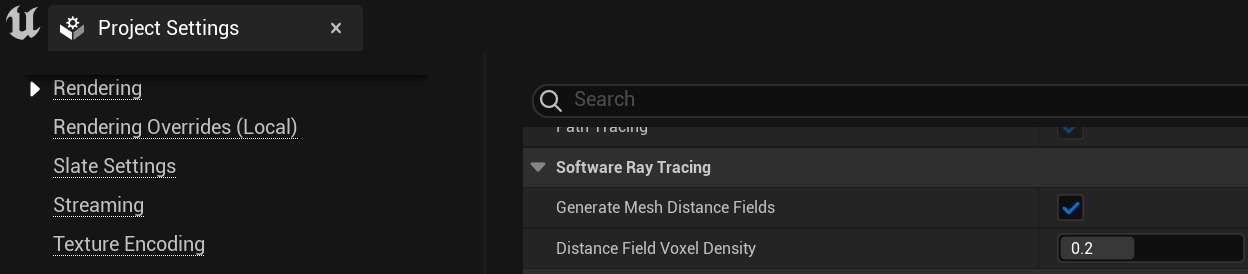
First off, we would highly recommend using the software raytracing
option by setting r.Lumen.HardwareRayTracing to 0 or by unchecking
Edit->Project Settings…->Engine ->Rendering->Lumen->“Use
Hardware Ray Tracing when available”. The performance difference
between hardware versus software raytracing is quite large (we’ve
measure as much as a 1.2ms difference on 7900XTX), but the visual
quality difference is minor in most cases. Lumen software raytracing
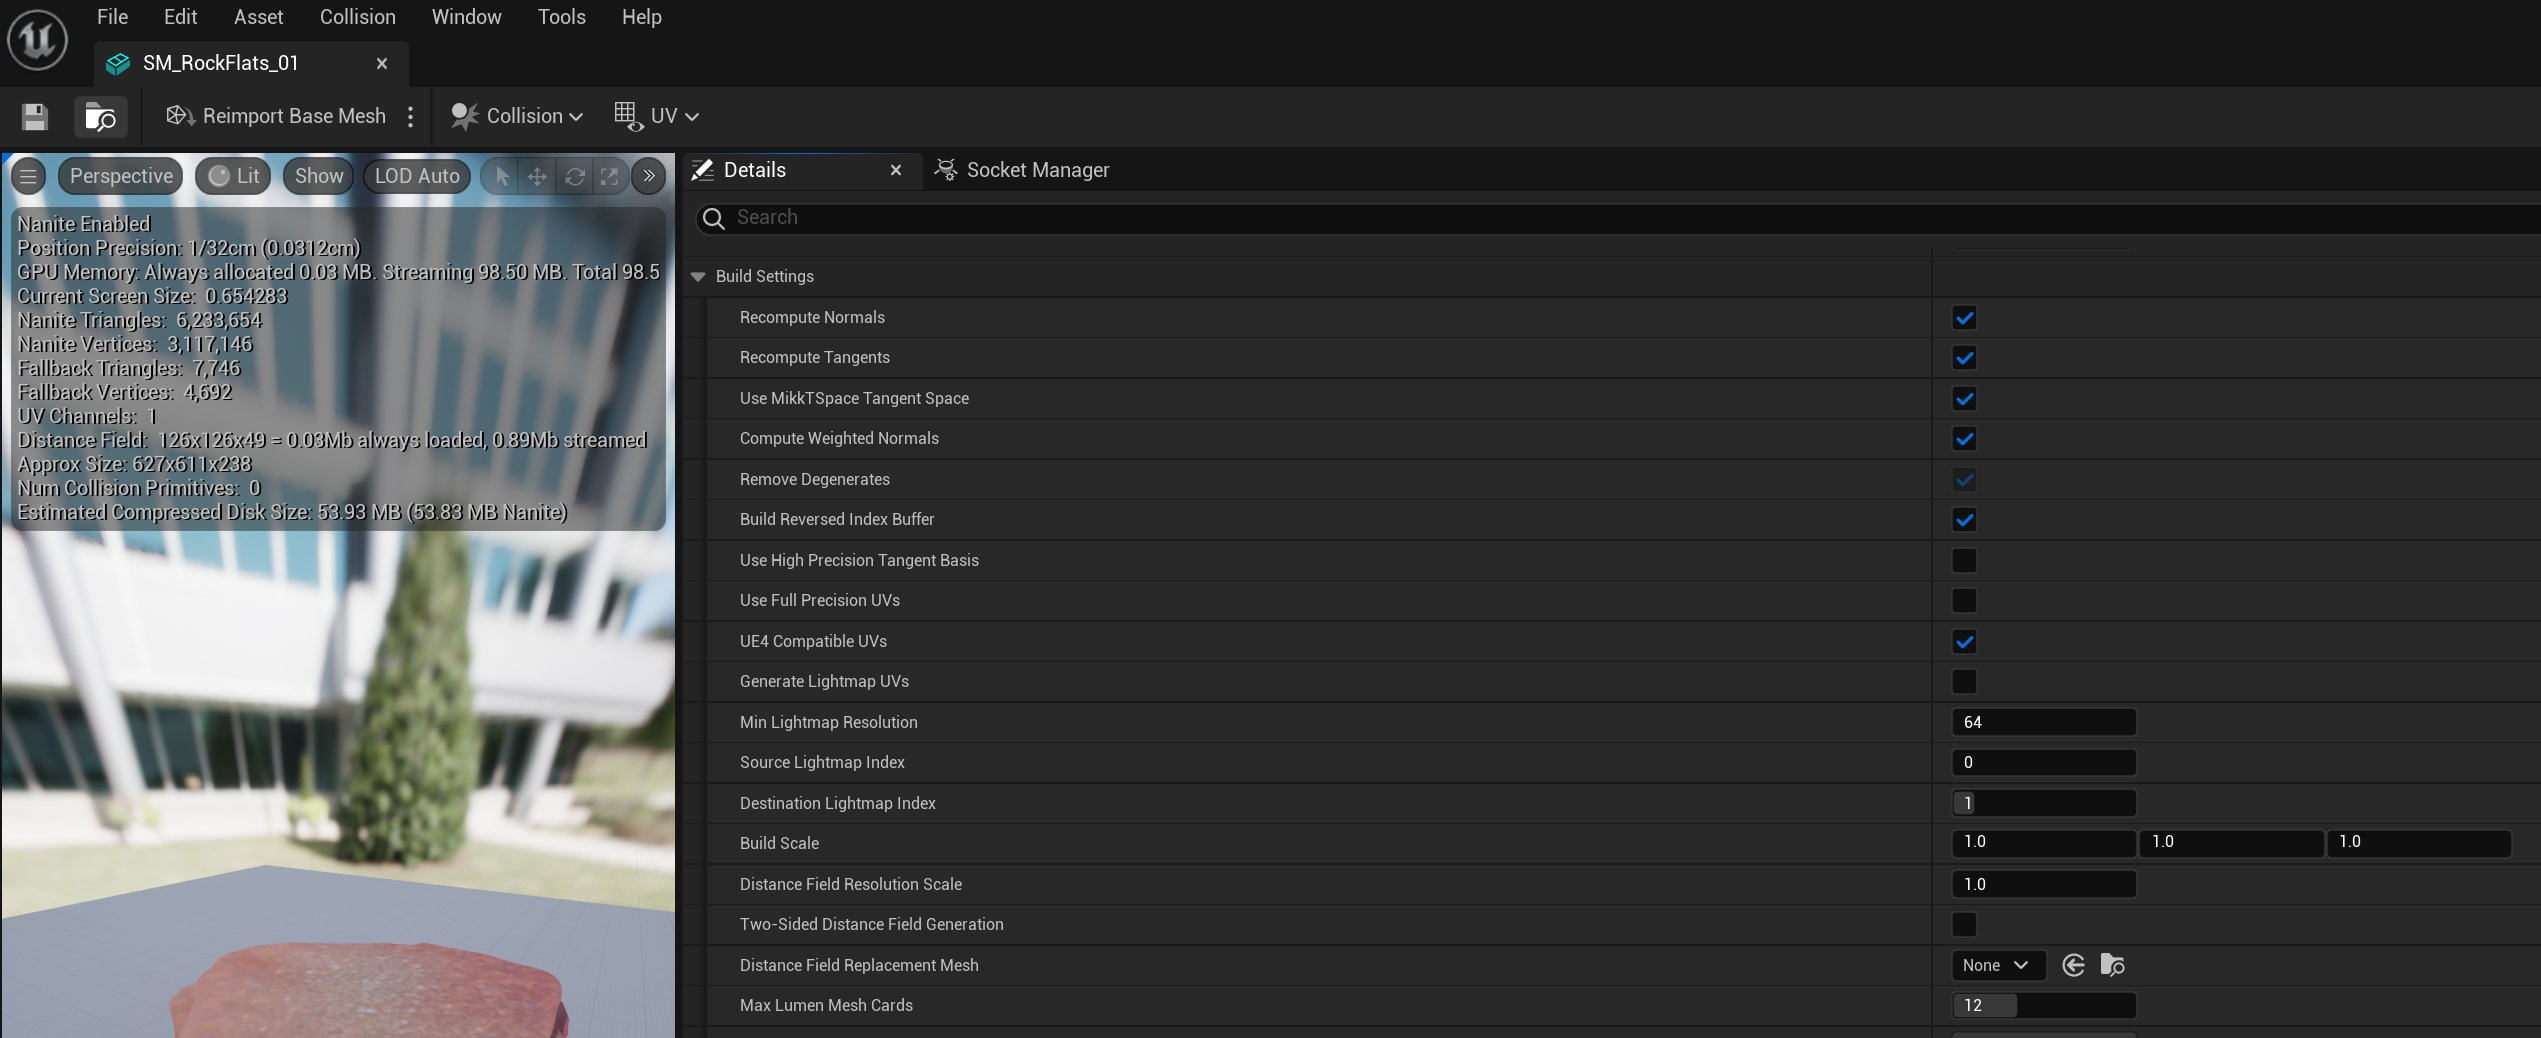
traces rays against signed distance fields. You can further control the
performance of globally traced rays by modifying the Distance Field
Voxel Density setting and locally traced rays by modifying a mesh’s
Distance Field Resolution (lower values perform better) and/or Two-Sided
Distance Field Generation setting (off performs better).
Another useful configuration parameter to improve performance with
little to no perceptible quality loss is setting
r.Lumen.ScreenProbeGather.StochasticInterpolation to 1, which our
testing indicates can gain as much as 30% performance improvement in the
Lumen ScreenProbeGather passes (i.e. global illumination). Setting this
cvar to 1 causes the shader to stochastically select a screen probe from
the nearest four to the current pixel, instead of bilinearly
interpolating between the four nearest probes. In theory this would
reduce lighting quality, but in practice we have found that in most
games the visual difference is imperceptible.
Here are a few other Lumen cvar configuration parameters that you should test to see if you can gain some performance while minimizing visual quality loss.
| Cvar Name | Description |
|---|---|
r.Lumen.ScreenProbeGather.SpatialFilterNumPasses | Reducing this value from the default of 3 down to 2 or 1 can save time without reducing quality appreciably. It can also be combined with StochasticInterpolation=1 (see above) to get even more performance improvement. |
r.Lumen.ScreenProbeGather.IntegrationTileClassification | Setting this to 0 has in some cases shown an increase in performance in the LumenScreenProbeGather passes, without any visual quality loss. However, the performance impact was not consistent across all games tested, so be sure to test. |
r.Lumen.Reflections.RadianceCache | Setting to 1 improves performance by reusing rays traced for diffuse global illumination, but has somewhat visible impact on reflection quality. |
Also, check out Epic’s Lumen Performance Guide for more optimization ideas.
Also introduced with Unreal Engine 5 is a new shadow mapping technique
called Virtual Shadow Maps (VSM). Realistic shadowing is one of the most
effective ways to achieve realism in your game, but it can also come
with a high performance cost. One hidden configuration gem for optimal
performance is r.Shadow.Virtual.SMRT.SamplesPerRayLocal. This cvar
controls the look of the soft edges on shadows cast from local lights
(i.e. non-directional). Experiment with reducing this value from the
default of 8. The visual difference between any two adjacent values,
e.g., 7 and 8, is nearly imperceptible. However, the performance benefit
will not go unnoticed, especially in scenes with lots of shadow casting
lights. The corresponding r.Shadow.Virtual.SMRT.SamplesPerRayDirectional
has similarly low impact on visual fidelity, but only improves
performance on your directional lights (e.g. sun, moon, etc.), which are
generally less prevalent in most game levels. Thus modification of this
parameter has less of an impact on performance. There are many other
configuration parameters for VSMs, be sure to check out the UE VSM
docs
for full details.
Employing an upscaling solution for performance and anti-aliasing is essential if your game pushes UE’s capabilities to the limit. UE has multiple options for performing anti-aliasing and upscaling of the rendered frame. UE version 5 introduced the Temporal Super Resolution (TSR) algorithm. Version 4 of UE provided the TemporalAA Upscaling (TAAU) solution. And of course, AMD’s FSR plugins are also great options (if we do say so ourselves😊).
The Temporal Super Resolution (TSR) feature of UE5 adds high quality super resolution upscaling, which can benefit your performance across the entire frame’s workload, but the TSR shader itself can be a huge time hog if not deployed carefully. Not only is the algorithm itself more complex, but motion vectors must be present and tracked across multiple frames to achieve high quality results. Also, be careful with setting the Anti-Aliasing quality to High or Epic because this might push your game out of the target frame rate.
Combining TSR’s upscaling with setting r.TSR.AsyncCompute to 1 to
execute the shader asynchronously can help deal with TSR’s high
performance impact.
The r.TSR.History.ScreenPercentage is an important consideration for
4K performance. It controls the resolution of TSR’s history, and is
controlled by UE5’s anti-aliasing scalability settings. At Anti-Aliasing
quality 0-2 (Low, Medium, and High), this cvar is set to 100, which means
that TSR’s history is stored at output resolution. At Anti-Aliasing quality
3-4 (Epic, and Cinematic), this cvar is set to 200, which means that
TSR’s history will be stored at 2x output resolution. This can result in
decreased 4K performance, as history will be stored at 8K, even when
upscaling from a lower resolution. We have observed this change reducing
total frame time by up to 1.2ms (measured on Radeon 7900XTX at 4K).
AA scalability settings can be updated in the file Engine\Config\BaseScalability.ini.
We recommend updating the “Epic” setting, (“AntiAliasingQuality@3”), to reduce
r.TSR.History.ScreenPercentage to 100.
r.TSR.History.ScreenPercentage=200r.TSR.History.ScreenPercentage=100Lastly, it’s best to use TSR for upscaling and anti-aliasing, as opposed to just anti-aliasing. UE4 TAAU and FSR 3 are better options for anti-aliasing only solutions.
If TSR proves to be too expensive for your game, you can try the UE4
Temporal Anti-Aliasing Upscaler (TAAU) by setting the cvar
r.AntiAliasingMethod to 2 and r.TemporalAA.Upsampling to 1. This shader
doesn’t produce the same level of quality output as TSR. For better
quality results and lower performance impact your best bet is FSR 3.
AMD FidelityFX Super Resolution (FSR) 3 produces temporally anti-aliased and super resolution upscaled output that is comparable to that of TSR, but with better performance. FSR 3 goes above and beyond TSR and provides frame generation to boost the FPS and improve the perceived animation smoothness of your game. FSR 3 does this by adding two new technologies - Frame Interpolation and Optical Flow enhanced from AMD Fluid Motion Frames. Read more about the technical details of FSR 3 here: /fsr3-in-games-technical-details/.
The temporal anti-aliasing and upscaling tech for FSR 3 comes directly from FSR 2. If you are using UE4 or aren’t interested in the frame generation capacity of FSR 3 then FSR 2 temporal upscaling can fill your needs. Also, be sure to check out the details of FSR 2’s latest updates and our blog series on maximising your FSR 2 performance and quality. FSR 2 is available as a plugin for UE4 and U5.
FSR 1 is our spatial AA and upscaling solution. It is the lightest weight memory-wise and fastest of all the options presented, but still produces an extremely impressive upscaled result. FSR 1’s spatially based algorithm has the performance advantage over temporal because, unlike temporal anti-aliasing solutions, nearly the entirety of the post-processing operations can be rendered at the reduced resolution prior to upscaling by FSR 1. Furthermore, FSR 1 requires less input data, such as motion vectors, making it easier on your game’s memory footprint and easier to integrate. It’s definitely a great choice as an upscaling plugin if one of the temporal upscalers described above are too much for your game. For full details, check out the FSR 1 docs.
The UE editor has many visualization tools to aid with debugging. The most notable of these for debugging performance would be the Optimization Viewmodes.
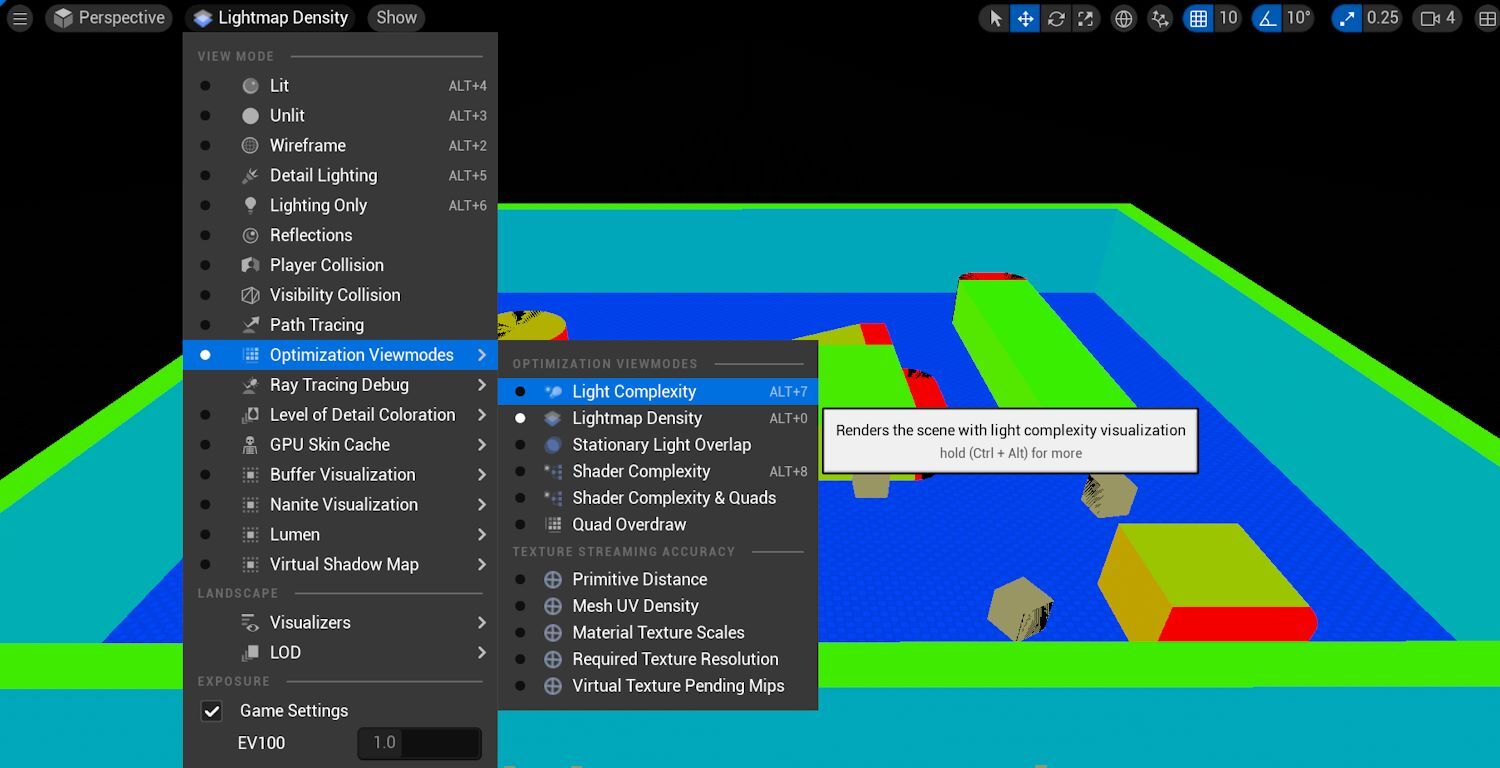
Some of the more useful ones are described below, refer to the official documentation for full details.
If your scene contains multiple light sources with large source radii, then check the Light Complexity view mode to optimize overlapping lights. The more lights affecting a surface, the more expensive it is to render.
For scenes with static lighting, the Lightmap Density view mode shows the texel resolution used during baked lighting for an Actor. If you have a small object in the scene, which takes up a small pixel area on the screen that shows as red (high density), then it could be optimized. To increase performance, try selecting an Actor, and changing its Lighting->Override Light Map Res to a lower value. The actual performance cost here is in the memory usage of the Lightmap and/or Shadowmap (depending on the light type used).
Static Shadowmaps can only be allowed 4 contributing lights per texel. Any excess stationary lights that overcontribute to a region can be visualized in Stationary Light Overlap. UE enforces this by changing excess stationary lights to movable, marking them with a red cross and visualizing the overlap as a red region in the Stationary Light Overlap view mode. Since movable lights are very expensive, we can optimize excess lights by reducing radius or turning off static shadowing by selecting the light and modifying its Light/Cast Shadows parameter.
The Shader Complexity view mode uses a static analysis of the number of shader instructions executed per pixel to determine pixel cost. As a supplement to this, we recommend Events->Wavefront occupancy and Overview->Most expensive events views in RGP to get a summary of where your frame time is going.
Scenes with heavy translucency, foliage, or particle effects will render pixels with high values in the Quad Overdraw view mode. If the average overdraw (marked by OD in the color ramp) stays at high values for most of your application then further optimization may be required.
Nanite does not support all types of geometric meshes that you might want to use in your game, as such, good old fashion triangle meshes are still required. These mesh optimization techniques are important to keep in mind when working with non-Nanite meshes. First, avoid over-tessellating geometry. Use LODs to prevent pixel and sub-pixel size triangles because these small triangles perform very badly on AMD GPUs. Refer to the official documentation for details on LODs: https://docs.unrealengine.com/en-US/Engine/Content/Types/StaticMeshes/HowTo/LODs/index.html
The Wireframe view mode, accessible through the editor, is a great first look at the geometric complexity of objects in your scene. Note that heavy translucency can slow down the Wireframe view mode and makes it look more crowded and less helpful. RenderDoc and PIX also show wireframe views.
UE calculates scene visibility to cull objects that will not appear in the final image of the frame. However, if the post-culled scene still contains thousands of objects, then draw calls can become a performance issue. Even if we render meshes with low polygon count, if there are too many draw calls, it can become the primary performance bottleneck because of the CPU side cost associated with setting up each draw call for the GPU. Both UE and the GPU driver do work per draw call.
The stat scenerendering command can be used to check the draw call count for your scene.
However, reducing draw calls is a balancing act. If you decide to reduce draw calls by using few larger meshes instead of many small ones, you lose the culling granularity that you get from smaller models.
We recommend using at least version 4.22 of Unreal Engine, to get the mesh drawing refactor with auto-instancing. See the GDC 2019 presentation from Epic for more details: Refactoring the Mesh Drawing Pipeline for Unreal Engine 4.22 | GDC 2019 | Unreal Engine
Furthermore, UE’s Hierarchical Level of Detail (HLOD) system can replace several static meshes with a single mesh at a distance, to help reduce draw calls. See the official documentation for details: https://docs.unrealengine.com/en-US/Engine/HLOD/index.html.
We can’t forget about the CPU. UE’s simulation and rendering tasks can
be a bit too greedy when it comes to CPU core usage. Unlimited usage of
CPU cores causes context switching or task stealing. Therefore, limiting
the cores by using -corelimit=# depending on the game’s computational
needs will improve overall performance.
This section covers other built-in UE profiling tools for older versions of Unreal Engine.
The console commands: stat startfile and stat stopfile causes all the
real-time stat data within the start/stop duration to be dumped to a
.ue4stats file, which can be opened in Unreal
Frontend.
The ProfileGPU command allows you expand one frame’s GPU work in the GPU Visualizer, useful for cases that require detailed info from the engine.
Some examples:
In stat gpu we see Translucency being slower than BasePass by 1ms. In
GPU Visualizer, we then find a translucent mesh that takes nearly 1ms.
We can choose to remove or optimize this mesh to balance time taken
for opaque and translucent draws.
In stat gpu we see both Shadow Depths and Lights/ShadowedLights
costing us frame time. In GPU Visualizer, we then identify an
expensive dynamic light source by name. We can choose to make this a
static light.
For the GUI version, set r.ProfileGPU.ShowUI to 1 before running
ProfileGPU.
For more details, check out the official ProfileGPU documentation.
We highly recommend using RGP in lieu of GPU Visualizer as your profiling workhorse for RDNA GPUs. RGP can have the same workflow as in the above examples. With RGP, you get in-depth GPU performance captures with more accurate timings and low-level ISA analysis.
Prior to Unreal Insights the best tool for benchmarking over a long period of time was the CSV Profiler, getting stat unit times over the duration. Results get placed in a .csv file then the CsvToSvg Tool can convert this output to an interactive scalable vector graphic (SVG).
Console commands to start/stop the CSV Profiler and/or FPS Chart:
csvprofile \[start/stop\]
StartFPSChart/StopFPSChart
Official documentation on these now deprecated tools:
You can find our FidelityFX Super Resolution Unreal Engine plugins at these links:
Don’t miss our FSR 2-related patches to improve performance even further.
Looking for even more ways to improve Unreal Engine performance? Or maybe you want to add new features such as our FidelityFX effects, or our Advanced Media Framework functionality?
We also have a wide range of Unreal Engine patches for you to try.