Software development is in the middle of a fundamental shift. More and more developers rely on LLM-powered coding agents — GitHub Copilot, Claude, Codex, and others — as first-class members of their workflow, not just as autocomplete engines. These tools can read, reason about, and generate source code at a level that makes them genuine force multipliers for complex engineering tasks.
GPU crash debugging has always been one of those tasks where that force multiplication is most needed. A GPU crash typically manifests as a device reset, a black screen, or a TDR (Timeout Detection and Recovery), leaving the developer with a crash dump and little else. Correlating low-level GPU state with high-level application code is painstaking work, requiring expertise in both graphics API semantics and AMD hardware internals.
LLMs, on their own, do an OK job here. They understand the vocabulary — page faults, virtual address timelines, shader disassembly, resource lifecycles — but without structured access to the crash data, they can only speculate. With the right tooling, however, the picture changes dramatically. Give an LLM direct, structured access to the AMD GPU crash dump through a purpose-built interface, and point it at the application’s source code, and it can identify the root cause in minutes and propose a fix in high-level source code, all without debug information.
This article introduces the AMD Radeon™ GPU Detective (RGD) MCP Server: an open-source tool that connects LLMs to AMD’s crash analysis pipeline, enabling automatic post-mortem GPU crash debugging.
Overview: From a single prompt to a fix in source code
The workflow is intentionally simple from the developer’s perspective. You open your application’s source code workspace in VS Code or Claude Code CLI, attach the AMD RGD MCP Server, and send one message:
“Analyze the crash dump at crash_dumps/RenderBench_DX12-20260324-131311177.rgd”
That’s it. From that single prompt, the LLM takes over, autonomously orchestrating a structured investigation.
Step 1 — Simplest prompt from the user
The developer provides the path to the .rgd crash dump file. No flags, no command-line options, no manual tool invocations. The LLM receives the request and begins its investigation by calling into the RGD MCP Server.
The developer sends a single natural-language prompt. The LLM immediately begins calling RGD MCP tools to gather crash evidence.
Step 2 — LLM reasoning steps guided by MCP tools
Behind the scenes, the LLM follows a guided investigation strategy embedded in the MCP Server’s tool descriptions. It calls a structured sequence of tools — getting a crash summary, querying page fault information, walking the resource timeline, retrieving execution markers, and analyzing shader disassembly — building up a complete picture of what the GPU was doing at the moment of the crash. The developer can watch this reasoning unfold in real time in the VS Code Copilot Chat or Claude Code CLI session.
Step 3 — LLM generates analysis of the GPU crash cause
The LLM synthesizes the evidence into a plain-language explanation of the crash root cause: which resource was accessed illegally, why the virtual address was invalid, which draw call or dispatch was executing, and what the application logic error most likely was.
The LLM identifies the root cause — a use-after-free of a GPU resource — and pinpoints the suspect code path. It then proposes a concrete fix in the application’s source.
Step 4 — LLM proposes a fix in source code
Because the LLM has access to the application source files in its context window (see Best Practices below), it can do more than describe the problem — it can propose a specific, targeted fix in the actual source code. The developer reviews the suggestion, and either accepts it directly or uses it as the starting point for their own fix.
Getting started
Prerequisites
Before installing the AMD RGD MCP Server, ensure the following are in place:
AMD Radeon GPU Detective (RGD) version 1.6.3 or later — the full RGD release package, not just the standalone executable. The server requires rgd.exe together with its runtime libraries (e.g., amdgpu_dis.dll, amd_comgr_3.dll on Windows). Download the latest RGD release from GPUOpen.com.
The folder where rgd.exe is located is in your PATH environment variable, or the RGD_EXE_PATH environment variable set — the server first checks RGD_EXE_PATH, then falls back to the system PATH. To verify PATH availability: where rgd.
Python 3.10 or later — verify with python --version.
An MCP-compatible LLM client — such as GitHub Copilot in VS Code or Claude Code CLI. The workflow has been validated with GitHub Copilot (Opus, Sonnet, and Codex models) and Claude Code CLI (Opus and Sonnet); a capable reasoning model is recommended for best results.
Install the server from the downloaded release package, replacing <version> with the actual version number:
Terminal window
pipinstallrgd_mcp_server-<version>.zip
If upgrading from a previous version, uninstall first:
Terminal window
pipuninstallrgd-mcp-server
pipinstallrgd_mcp_server-<version>.zip
2. Configure the MCP server in VS Code
Create a .vscode/mcp.json file in your workspace root (or add to an existing one):
{
"servers": {
"rgd": {
"type": "stdio",
"command": "python",
"args": ["-m", "rgd_mcp"],
"env": {
"RGD_EXE_PATH": "C:/path/to/rgd.exe"
}
}
}
}
Note: If rgd.exe is already on your system PATH, the env block can be omitted entirely.
3. Enable the MCP server in Copilot Chat
Open Copilot Chat (Ctrl+Alt+I), click the Tools button, and confirm that rgd appears in the list of available MCP tools. VS Code will prompt you to start the server the first time.
Setup: Claude Code CLI
1. Install the MCP server
Terminal window
pipinstallrgd_mcp_server-<version>.zip
If upgrading from a previous version, uninstall first:
Tip: The --scope user part of the command is used to register the server globally across all workspaces rather than only for the current workspace. If you wish to only register the server for the current workspace remove --scope user from your command:
Before starting an analysis session, two practices will significantly improve the quality of the LLM’s output:
1. Use your application’s source code as the working directory.
When the LLM has the application source files in its context, it can correlate the crash evidence — execution markers, faulting resource names, shader file paths extracted from the crash dump — directly against the actual code. It can, in many cases, identify the exact function, the exact line, and propose a concrete fix. Without source access, the LLM can describe the crash at the GPU level, but cannot close the loop to a code-level recommendation.
In VS Code, simply open the folder containing your application’s source as your workspace before running the analysis. In Claude Code CLI, navigate to that directory before starting your session.
2. Instrument your application with user execution markers.
AMD GPU crash dumps capture GPU execution state at the time of the crash, including user-defined execution markers if your application inserts them via the AGS library or the PIX marker replacement headers. These markers act as named breadcrumbs — strings like "DownSamplePass::Render" or "ShadowMap::Update" — that appear in the crash dump and give the LLM an explicit, searchable link between the GPU crash site and the high-level code structure. With markers present, the LLM can jump directly to the suspect area of your codebase. Without them, it must infer the call site from resource names and shader file paths alone, which is still useful but less precise.
Analyzing a crash in VS Code Copilot
Open your application workspace in VS Code (see best practices above).
Open Copilot Chat with Ctrl+Alt+I (or from the Activity Bar).
Use the /mcp.rgd.analyze_crash prompt command — type /analyze_crash in the chat input. VS Code will prompt you to provide the full path to your .rgd crash dump file.
Alternatively, type a natural-language request directly:
“Analyze the crash dump at C:/crash_dumps/my_app_crash.rgd”
Wait for the analysis to complete. The LLM will call a sequence of RGD MCP tools automatically, and you will see its reasoning steps appear in the chat. A full analysis typically takes one to two minutes.
Review the root cause explanation and, if source code is available, the proposed fix. You can ask follow-up questions — for example:
“Show me the exact line in the source code that causes this.”“What other places in the code could trigger the same issue?”“Apply the fix.”
Analyzing a crash in Claude Code CLI
Navigate to your application’s source directory before launching Claude Code CLI:
Terminal window
cdC:/my_project/source
claude
Ask Claude to analyze the crash directly in a prompt. Unlike VS Code, Claude Code CLI does not have an interactive file picker, so include the full path to the .rgd file in your message:
“Analyze the crash dump at C:/crash_dumps/my_app_crash.rgd and identify the root cause.”
Alternatively, use one of the RGD MCP predefined prompts, which may show as /rgd:analyze_crash or /mcp__rgd__analyze_crash (type “/analyze_crash” and you should see them listed). Even if you choose to use the predefined prompt instead of free text, remember to provide the full path to the .rgd file to be analyzed as part of the prompt text. Claude will call the RGD MCP tools in sequence and present the analysis and fix suggestion in the conversation.
To request a source-level fix after the analysis:
“Fix it.”
From crash dump to root cause in minutes
The AMD RGD MCP Server bridges two previously separate worlds: AMD’s post-mortem GPU crash analysis pipeline and LLM-powered coding agents. The result is a workflow that automatically produces root cause analysis for a given AMD GPU crash dump (.rgd file) and can even propose source-code fixes without debug information.
The tool is open source and available on GitHub. Download the MCP server package from GPUOpen.com to get started:
Amit Ben-Moshe is an AMD Fellow. His postings are his own opinions and may not represent AMD’s positions, strategies or opinions. Links to third party sites are provided for convenience and unless explicitly stated, AMD is not responsible for the contents of such linked sites and no endorsement is implied.
Amit Mulay
Amit Mulay is a Member of Technical Staff on AMD’s Developer Solutions team, where he works on Radeon GPU Detective (RGD), helping developers investigate and resolve GPU crashes. He holds a Master of Science in Artificial Intelligence from Northeastern University in Boston.


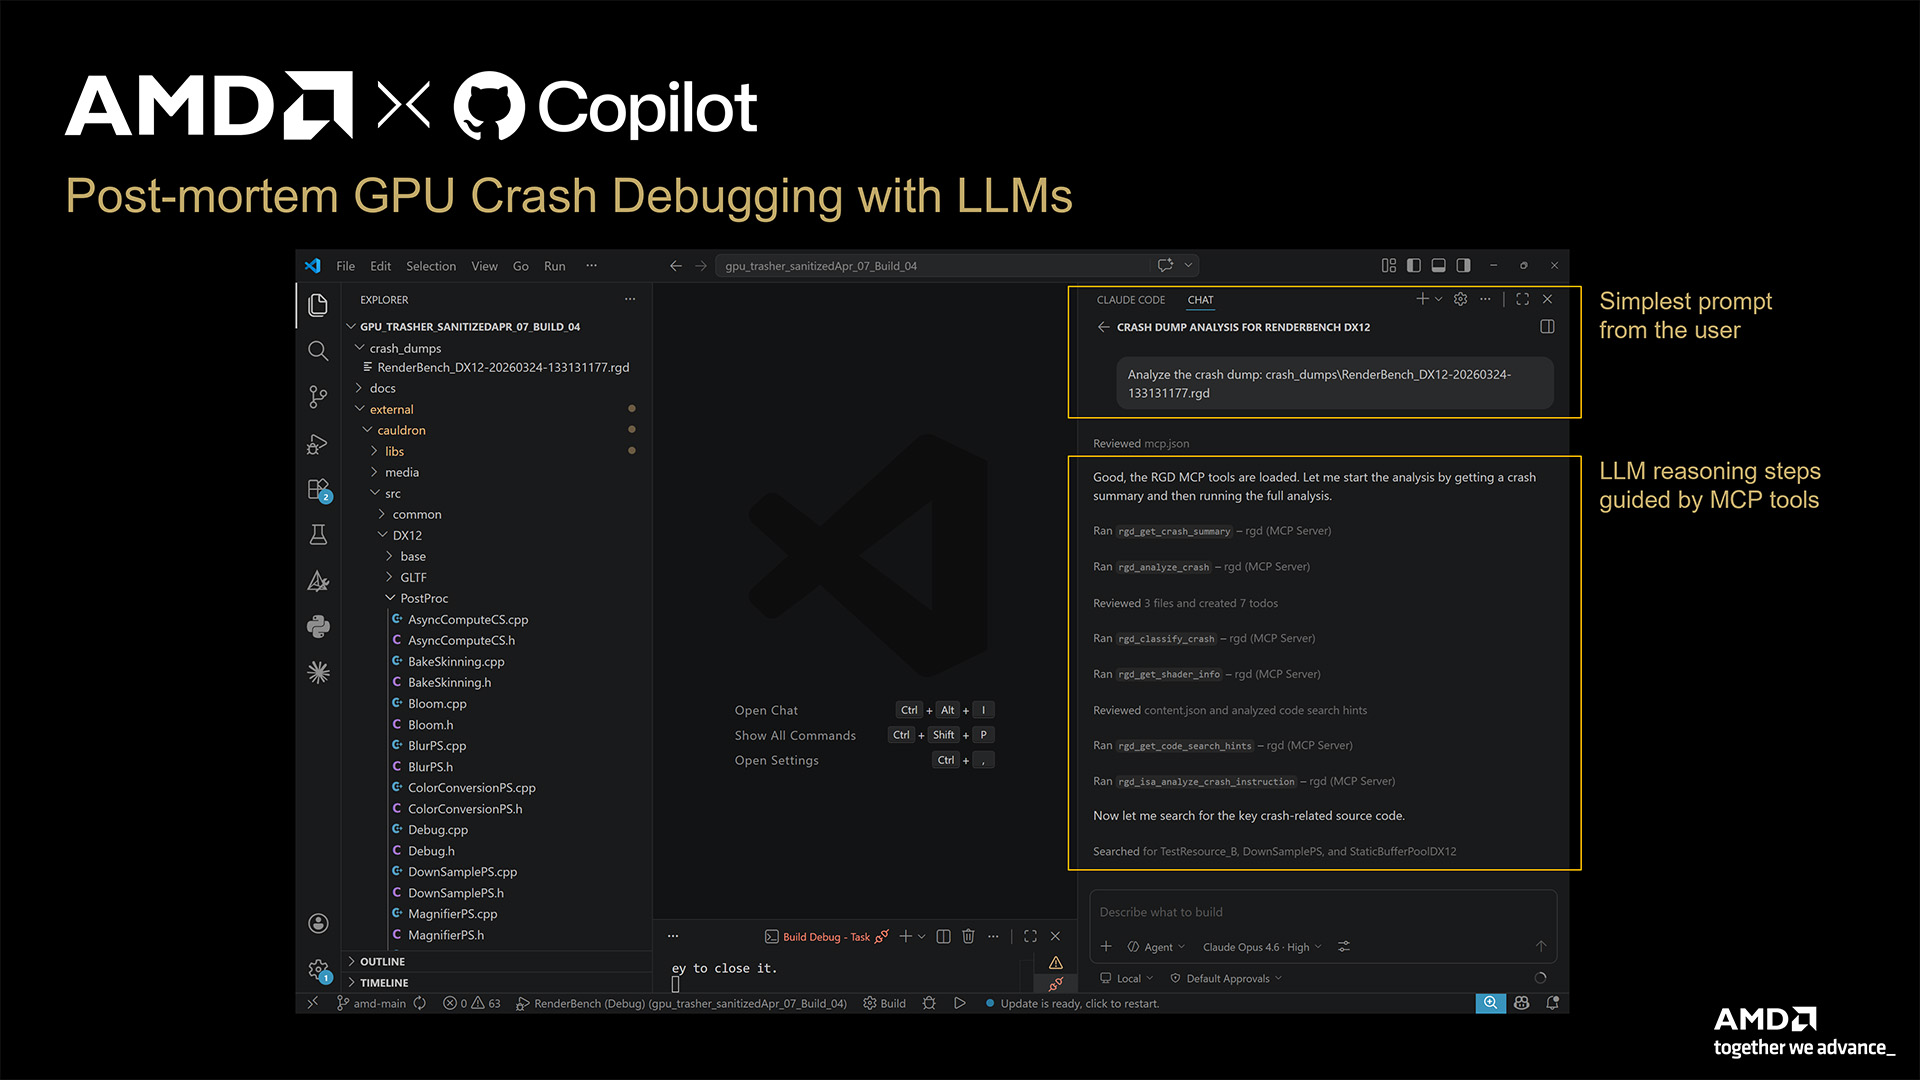 The developer sends a single natural-language prompt. The LLM immediately begins calling RGD MCP tools to gather crash evidence.
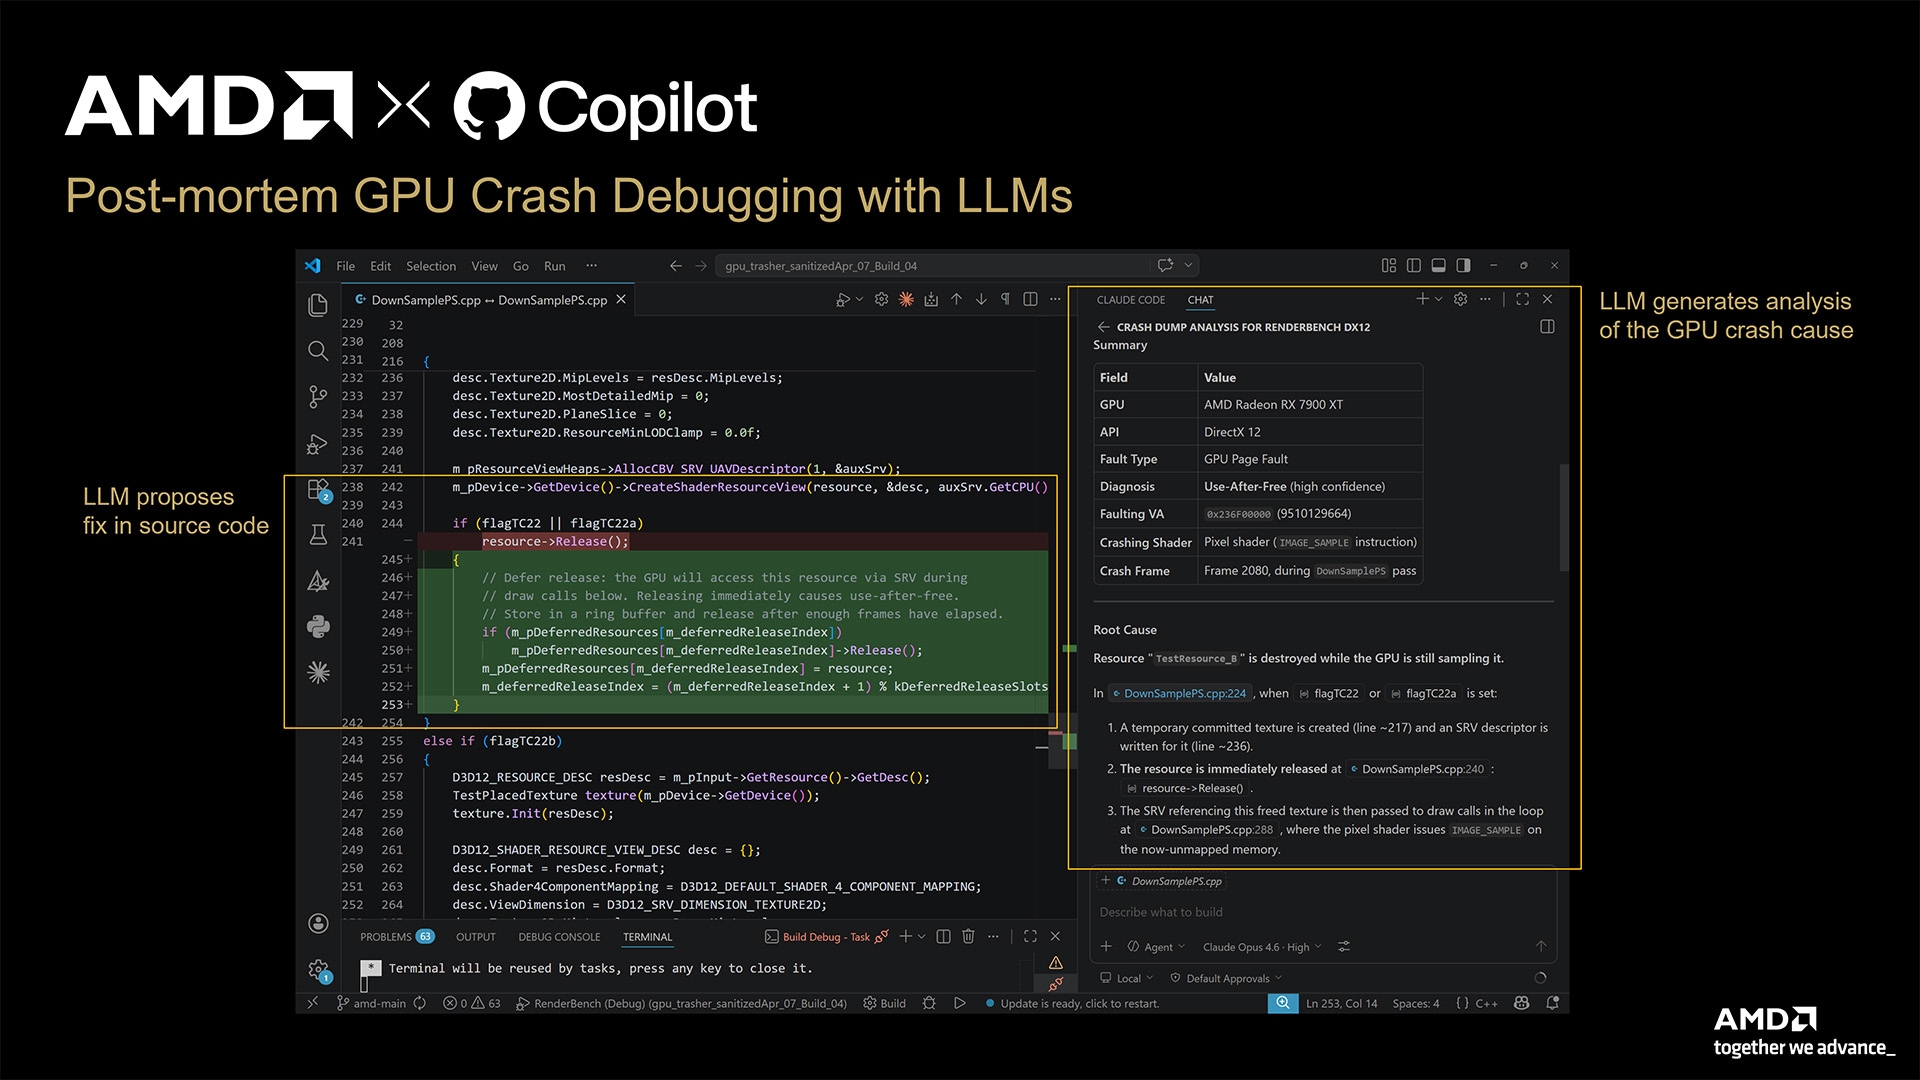 The LLM identifies the root cause — a use-after-free of a GPU resource — and pinpoints the suspect code path. It then proposes a concrete fix in the application’s source.