AMD Radeon™ Developer Panel
The RDP provides a communication channel with the Radeon™ Adrenalin driver. It generates event timing data used by the Radeon™ GPU Profiler (RGP), and the memory usage data used by the Radeon™ Memory Visualizer (RMV).
We are excited to announce the latest release of the AMD Radeon™ Developer Tool Suite (RDTS). This release brings a significant set of new features to AMD Radeon™ GPU Profiler (RGP), along with updates to several other tools in the suite.
This release extends support to the latest AMD hardware, including AMD Radeon AI PRO R9600 Series graphics cards and AMD Ryzen™ AI 400 Series Processors. These additions ensure that you can leverage the full capabilities of the newest AMD architectures.
Some features in this new update to RDTS require AMD Software: Adrenalin Edition™ 26.5.2 or higher. We always recommend using the latest Adrenalin release with RDTS.
Below, you can find details about the new features introduced by each tool for this release.
RGP 2.7 is a significant release, packed with new features that make it easier to understand and optimize your DirectX® 12 and ray tracing workloads. From viewing HLSL shader source code directly in the profiler to tracking thread divergence at the instruction level, RGP 2.7 introduces several powerful new capabilities.
One of the most exciting additions in RGP 2.7 is the ability to view your DirectX 12 shader source code directly within the profiler. Previously, the ISA tab in the Pipeline state pane showed only disassembled GPU instructions. That tab has been renamed to Shader, and it now displays your original HLSL source code side-by-side with the ISA — making it much easier to correlate high-level logic with what is actually executing on the GPU.
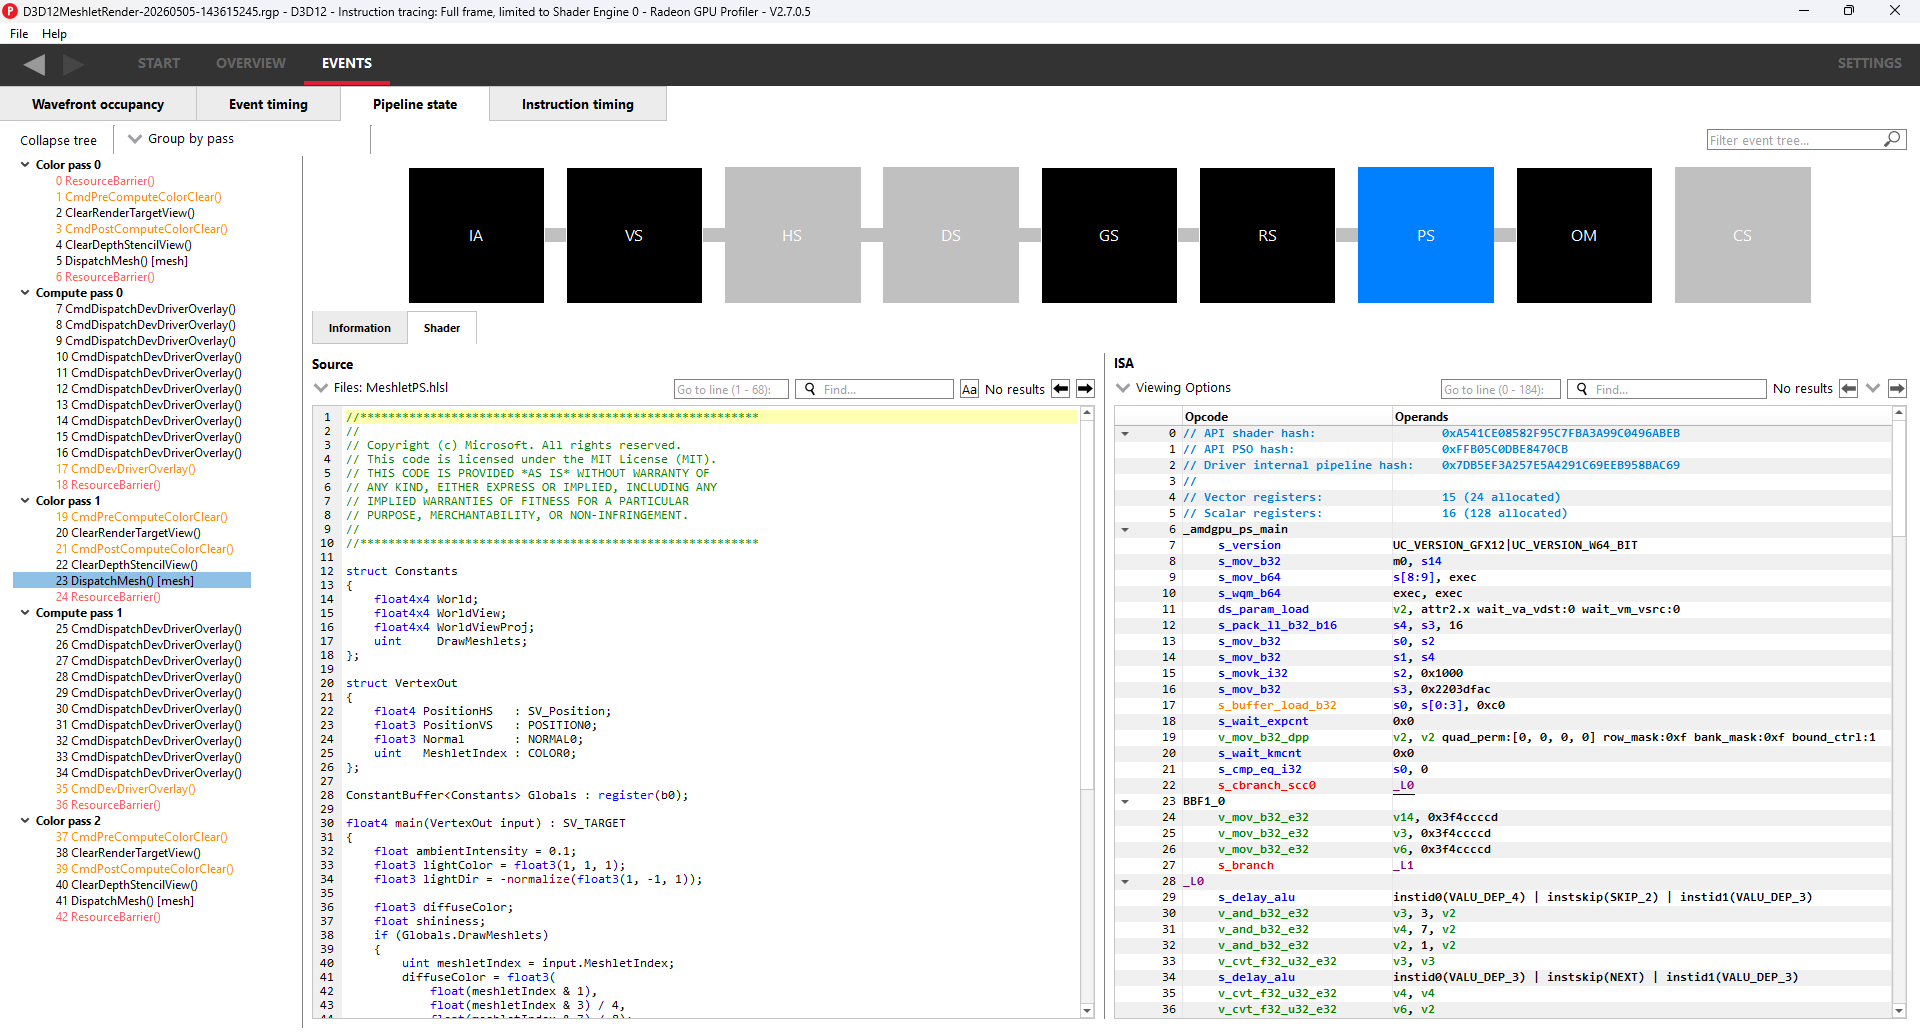
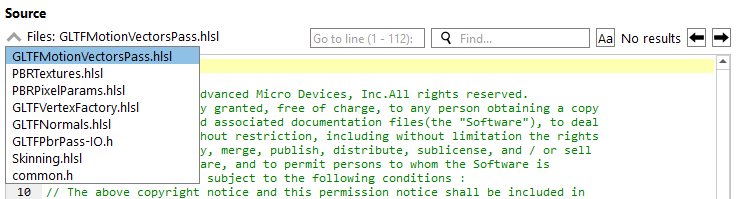
The Shader tab also includes a Files dropdown, allowing you to switch between source files when multiple shader files contribute to a pipeline stage.
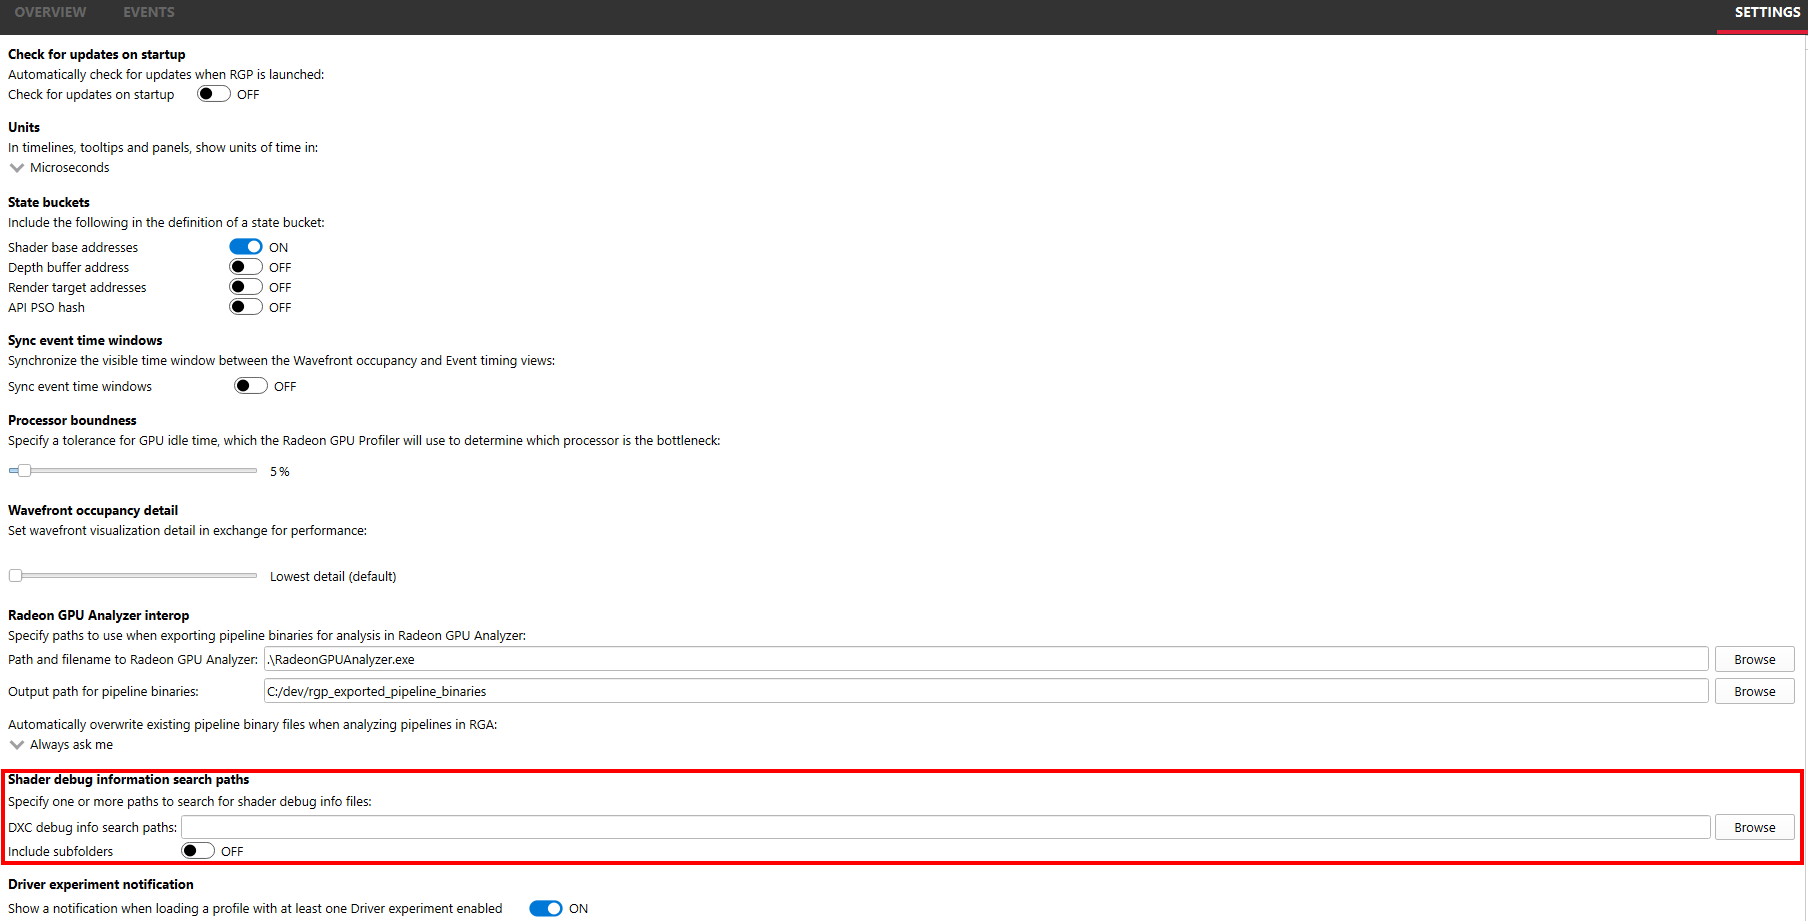
To take advantage of this feature, your shaders need to be compiled with debug information embedded. When compiling with DXC, use the -Zi or -Zs flag combined with -Qsource_in_debug_module to embed the source in the PDB. You will also need to configure the new Shader debug information search paths setting in RGP so that the profiler knows where to look for your compiled shader binaries.
This feature builds on the same approach as the DirectX debug information support introduced in AMD Radeon GPU Detective.
RGP 2.7 adds a new Average active lanes column to the Instruction timing pane. This column shows the average number of active lanes per wavefront for each instruction, giving you a direct view of thread divergence in your shader code. When all 64 lanes in a wavefront are active, execution is fully converged. When that number drops, it’s a sign that divergent control flow — such as branching based on thread ID — is reducing the effective parallelism of your shader.
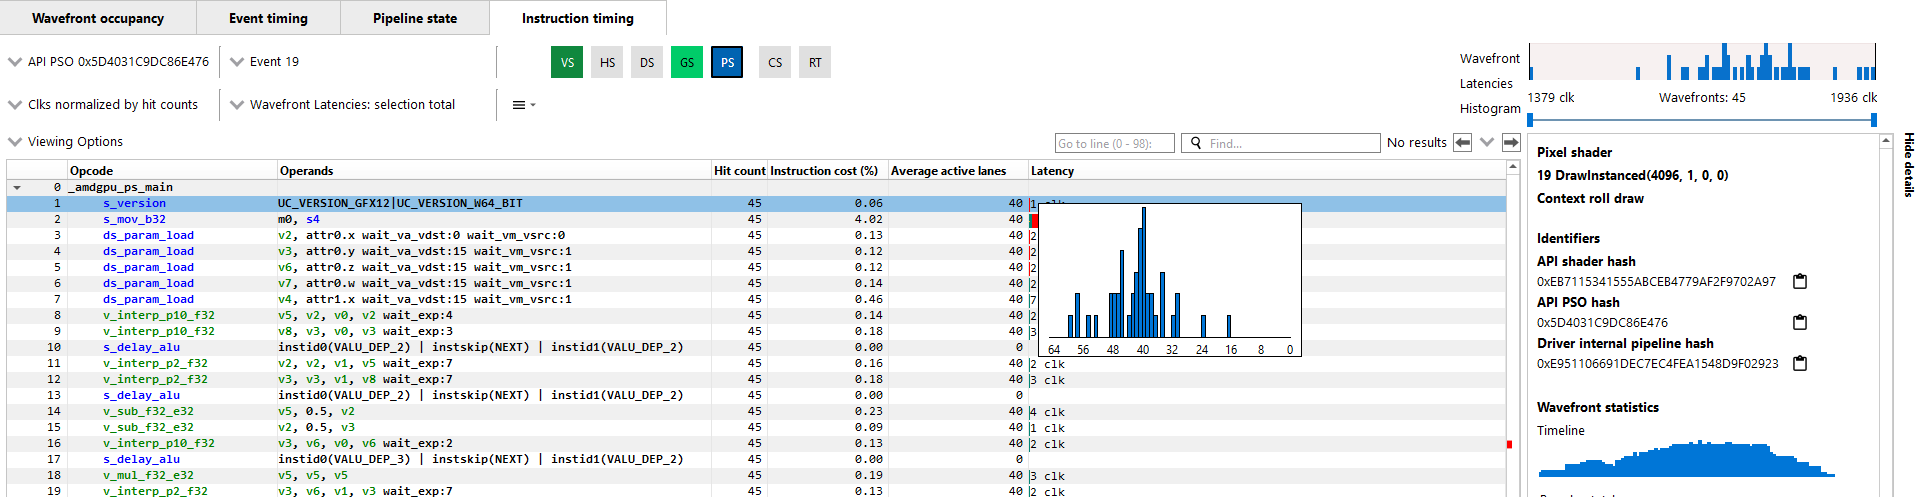
Hovering over a value in the column shows a tooltip with a full lane distribution breakdown, giving you even more detail about how lanes are distributed across the wavefront.
This feature requires shader instrumentation to be enabled in the AMD Radeon Developer Panel (RDP) at capture time, and is currently supported on AMD Radeon RX 9000 Series GPUs and newer.
RGP has long supported user markers as a way to annotate GPU work with meaningful labels, making it easier to navigate and understand profiles of complex workloads. In RGP 2.7, we’re excited to bring Extended PIX Marker support to RGP through a collaboration with Microsoft®. With the May DirectX 12 AgilitySDK 1.721-preview, calls made to the WinPixEventRuntime’s marker functions are now passed through the driver DDI, allowing the AMD driver to pick them up and include them in RGP captures automatically. The result is that PIX markers appear in RGP without any modifications to PIX header files and without requiring any AMD-specific DirectX 12 extensions. Details on this functionality can be found in the D3D12: PIX Markers specification.
This feature is supported on Windows® only. To use it, your application must use a DirectX 12 Agility SDK with a D3D12SDKVersion of 721 or newer. You
will also need to call ID3D12DeviceTools2::SetUserDefinedAnnotationMode with D3D12_USER_DEFINED_ANNOTATION_MODE_DRIVER_RETAIL during device setup. No AMD-specific headers or code changes are required beyond that — the standard PIXBeginEvent, PIXEndEvent, and PIXSetMarker functions work as-is, and any RGB colors you supply via PIX_COLOR(r, g, b) will be honored in the RGP UI.
Additionally, this feature requires a specific AMD developer driver update (AMD Software: AgilitySDK Developer Preview Edition 26.10.07.02).
If your application is not yet using a compatible Agility SDK, the existing modified-header approach continues to work as before.
For more information on user marker support in RGP, see the updated RGP documentation.
As a natural companion to Extended PIX Marker support, the Color by user marker mode in the Wavefront occupancy pane’s Event timeline and the
Event timing pane has been improved so that GPU events are now assigned the same color as their correlated user marker. Previously, the colors assigned to events and their corresponding user markers could differ. Now they match, including any explicit colors provided via the PIX_COLOR macro, making it much easier to visually correlate events with the user marker hierarchy that generated them.
The event filter bar in the Event timeline and Pipeline state panes now accepts shader hash values. You can filter by API PSO hash, internal pipeline hash, or an API shader stage hash using a stage prefix such as PS:0x1234.... The prefix matching is case-insensitive and tolerates extra spaces after the colon, so PS: 0x1234... and ps:0x1234... both work as expected. This makes it straightforward to isolate all events associated with a particular shader or pipeline when debugging performance issues.
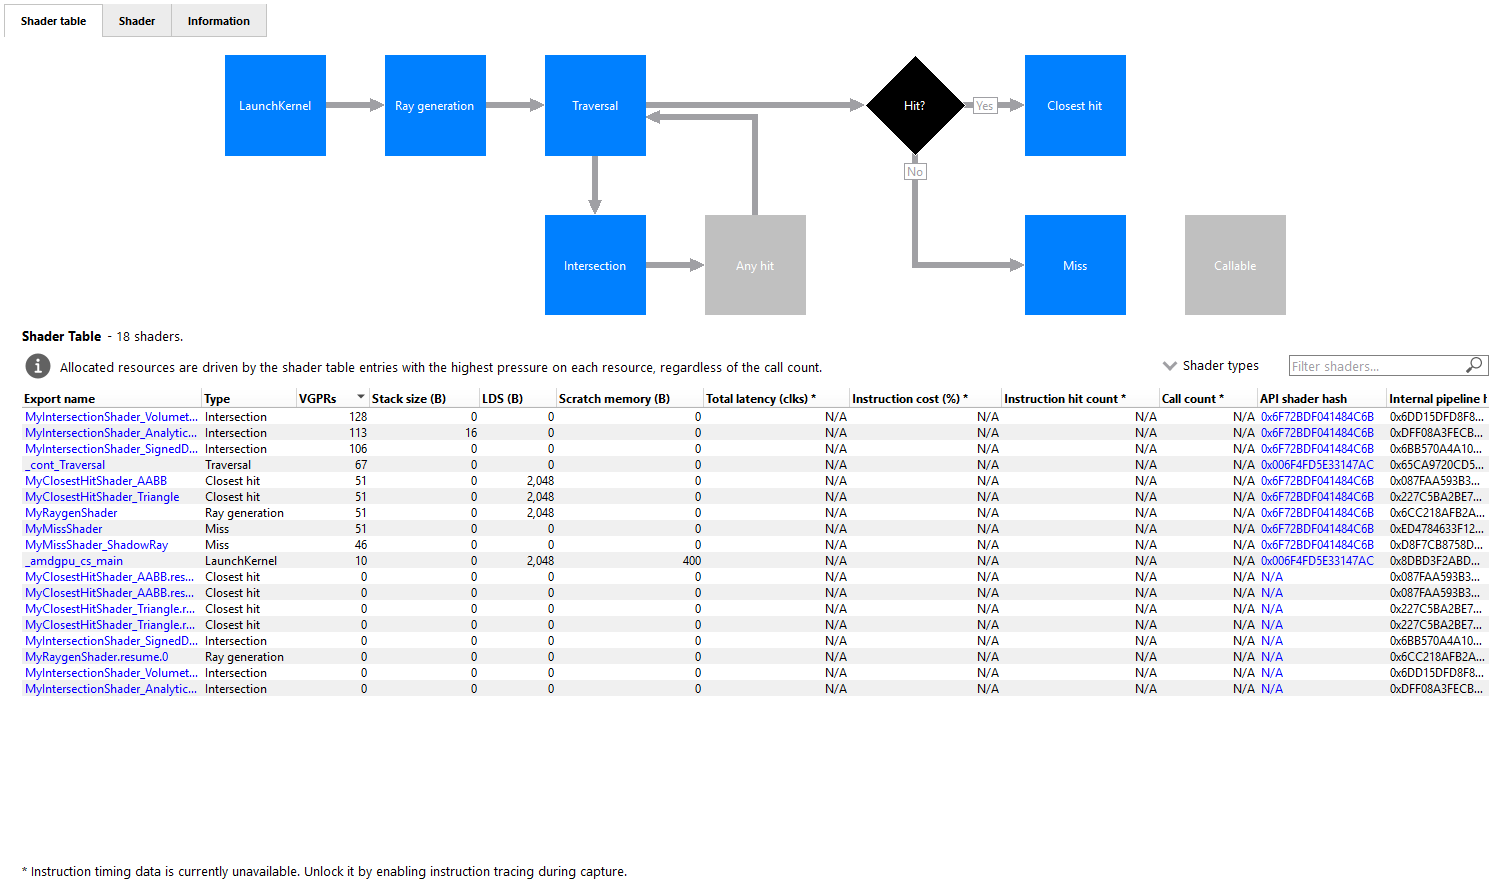
In previous releases, Launch kernel events appeared in the shader table with an N/A value in the Type column, and neither Launch nor Callable shaders were represented in the Indirect ray tracing pipeline flow chart. RGP 2.7 addresses both of these gaps. Launch and Callable shader types now appear as distinct boxes in the flow chart, have valid type values in the shader table, and are available as options in the Filter dropdown, allowing the shader table to be filtered by these types.
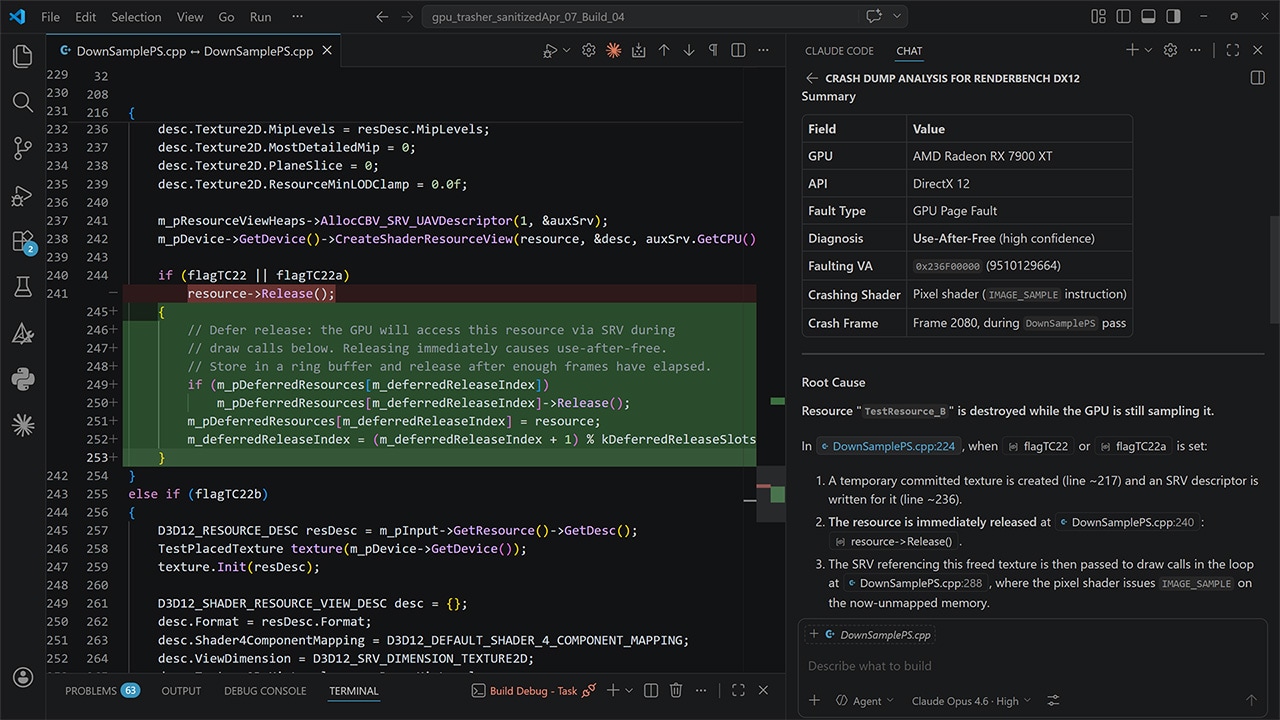
RGD 1.6.3 brings two notable additions: Extended PIX Marker support in crash analysis output, and more flexible PDB search path configuration.
RGD 1.6.3 brings the same Extended PIX Marker support described above for RGP. When analyzing a crash dump from a DirectX 12 application instrumented with PIX markers, those markers now appear in the crash analysis output — both in the EXECUTION MARKER TREE section and, for any markers that were in progress at the time of the crash, in the MARKERS IN PROGRESS section of the RGD summary. Previously this required a driver extension; with the May DirectX 12 AgilitySDK 1.721-preview, markers are captured natively. The same setup requirements and caveats apply as described in the RGP section above.
Additionally, this feature requires a specific AMD developer driver update (AMD Software: AgilitySDK Developer Preview Edition 26.10.07.02).
RGD can now optionally search subdirectories of each configured debug information search path when looking for PDB files. This is enabled via the --pdb-subdir command-line option to rgd, making it easier to point RGD at a root build output folder without needing to enumerate every subdirectory individually. Since RGD is typically launched automatically by the Radeon Developer Panel after a crash occurs, RDP 3.5 also adds a corresponding checkbox in its crash analysis settings to control this behavior.
RRA 1.11 brings several usability improvements to the TLAS/BLAS viewer, making it faster and more intuitive to navigate and analyze complex ray tracing acceleration structures.
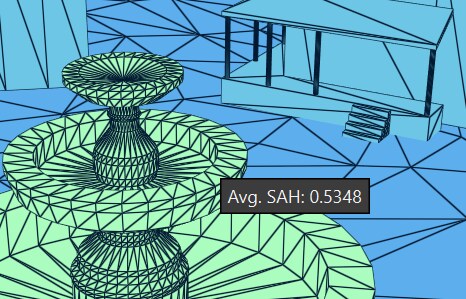
RRA 1.11 adds a tooltip to the TLAS and BLAS viewers that displays useful statistics for whichever instance (in the TLAS viewer) or triangle (in the BLAS viewer) the mouse is hovering over. The value shown in the tooltip reflects the currently selected coloring mode — for example, if one of the SAH coloring modes is active, the tooltip shows the SAH value for the triangle under the cursor. Tooltips are also available in the traversal rendering mode. This removes the need to click on every element of interest and provides immediate feedback as you explore the scene.
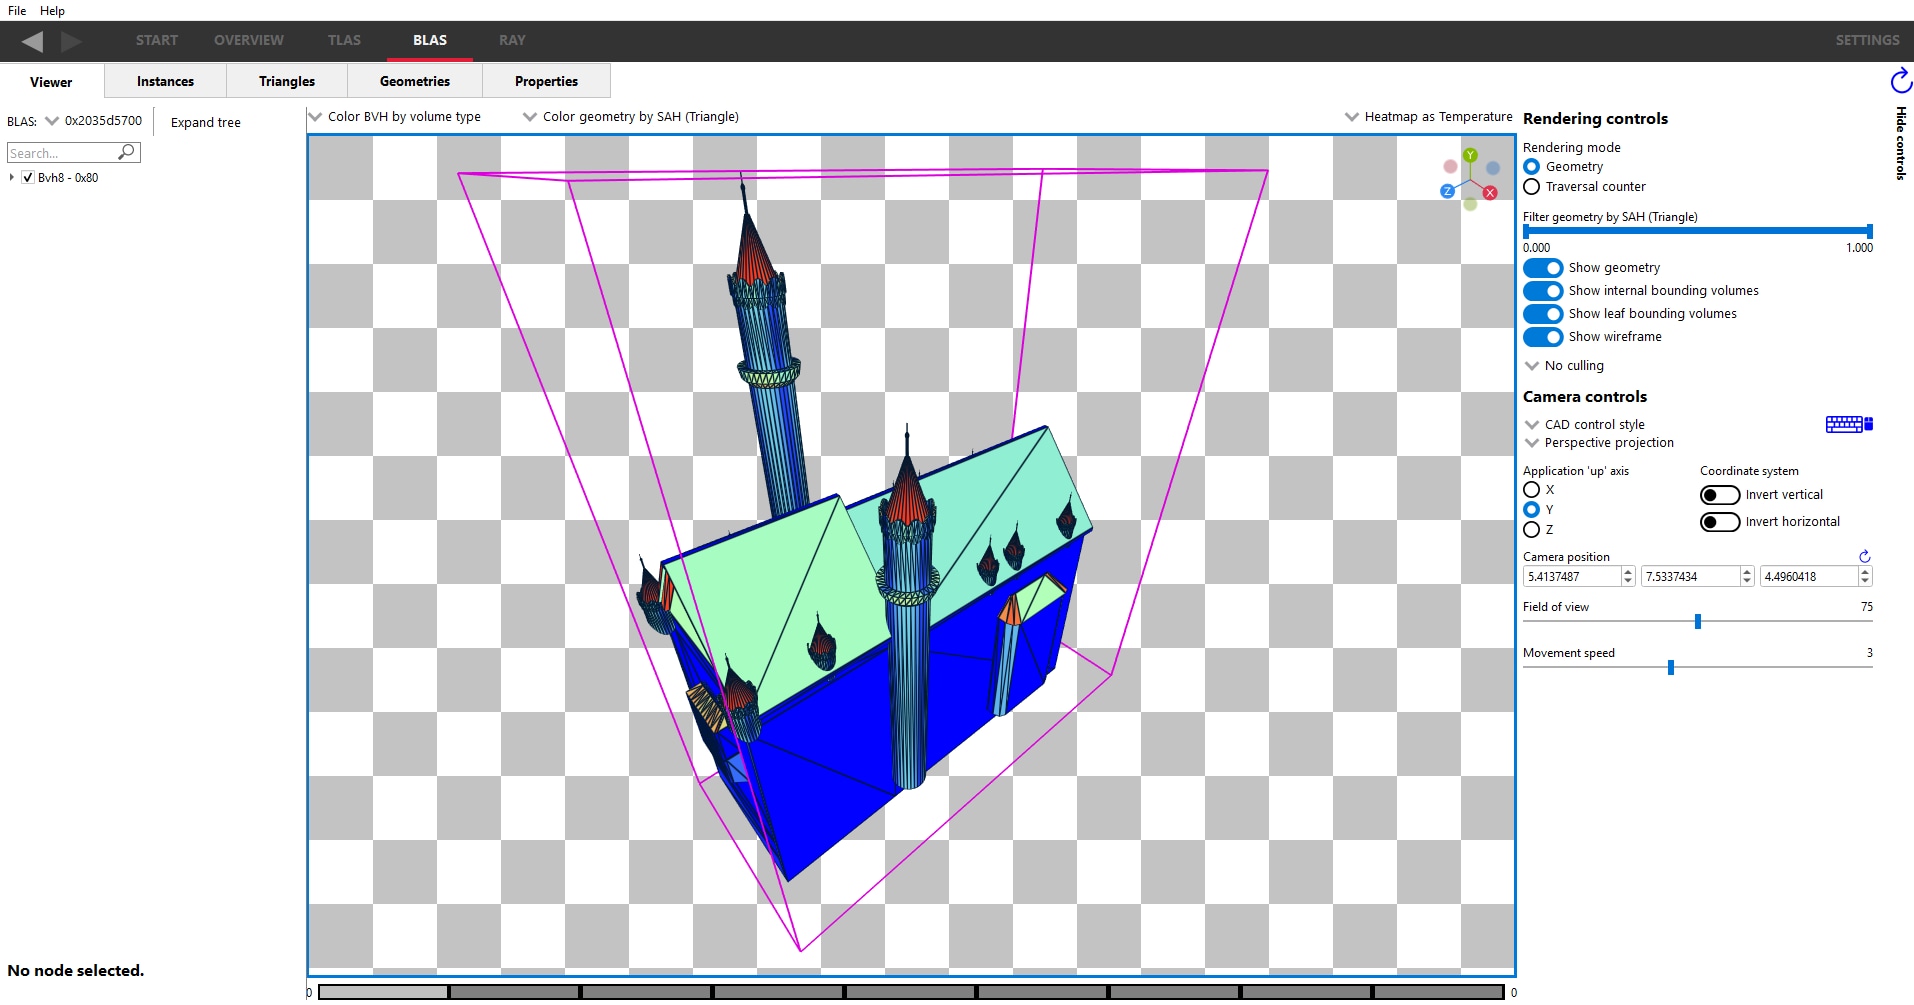
A new slider allows you to filter the geometry shown in the viewer and display only triangles that match specific criteria, such as those with the lowest SAH values. This makes it easy to quickly identify and focus on geometry that may warrant optimization. The slider operates based on the currently selected coloring mode and is available in geometry rendering mode.
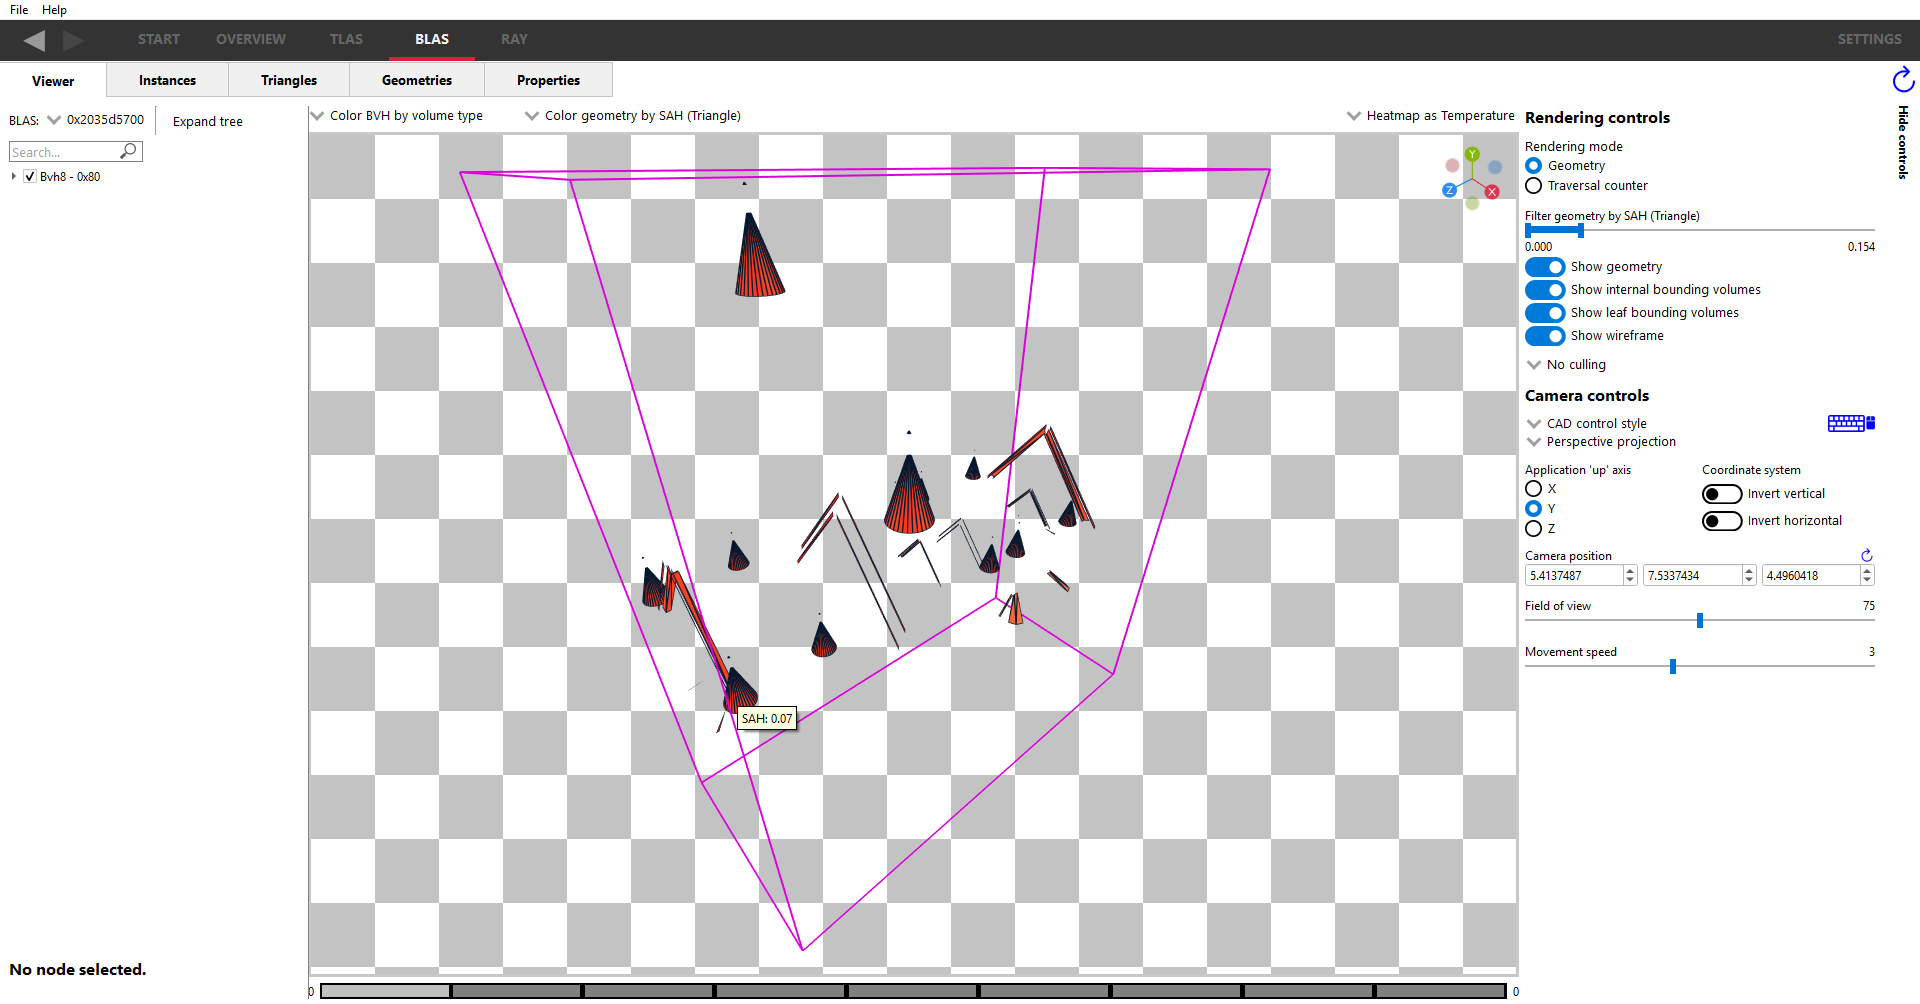
The following image shows the same scene after using the slider to filter down to only the triangles with the lowest SAH values.
RRA 1.11 replaces the Show bounding volumes checkbox with two separate controls: Show internal bounding volumes and Show leaf bounding volumes. This gives you finer control over the wireframe display, allowing you to view only the leaf nodes, only the internal nodes, or both, at any given tree depth.
RMV 1.15 adds several quality-of-life improvements to how memory data is presented and exported, making it easier to interpret allocation sizes and work with resource data outside of the tool.
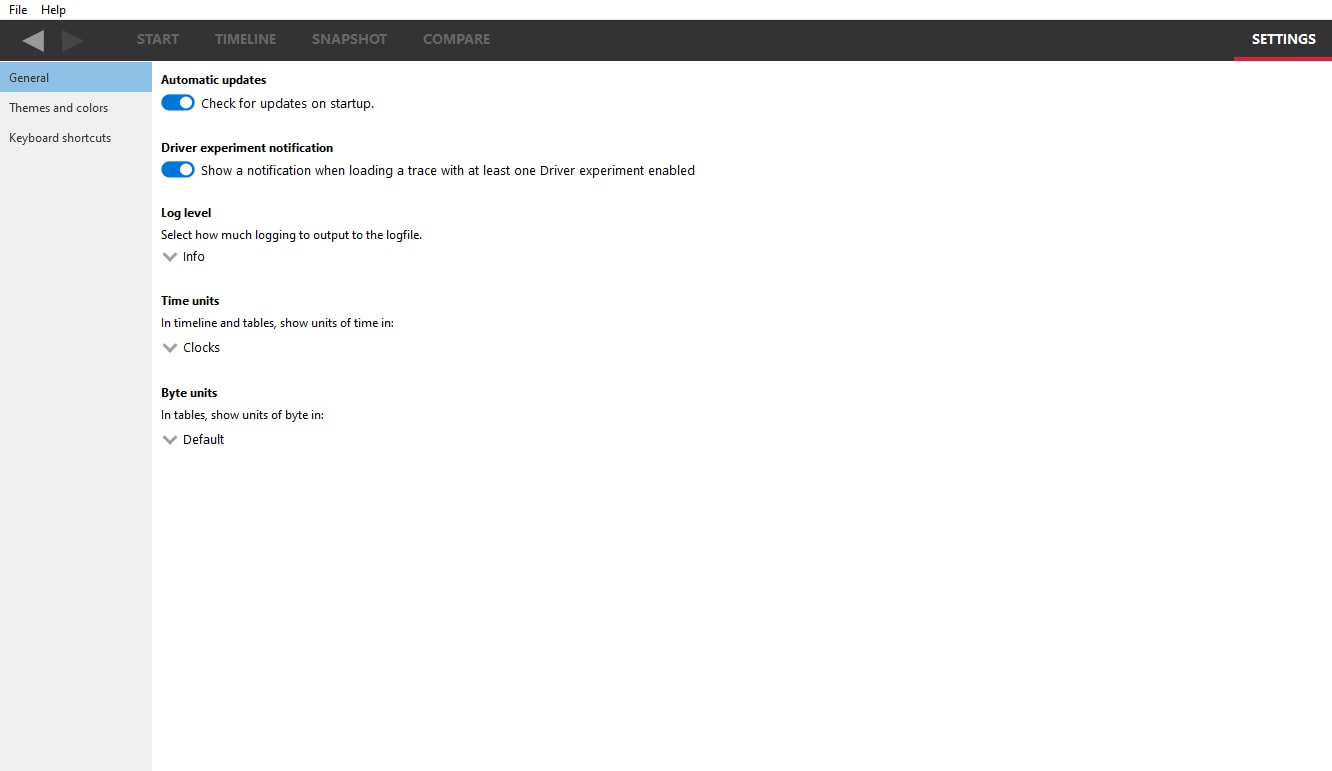
Memory values in RMV tables have historically been displayed in base 2 — where 1024 bytes equals 1 KiB. RMV 1.15 adds a Byte units dropdown in the settings pane that lets you switch between binary (base 2) and decimal (base 10) display, so values are shown as KiB/MiB or KB/MB respectively. A tooltip on any memory value always shows the exact byte count regardless of the selected unit, so there is no ambiguity when comparing values.
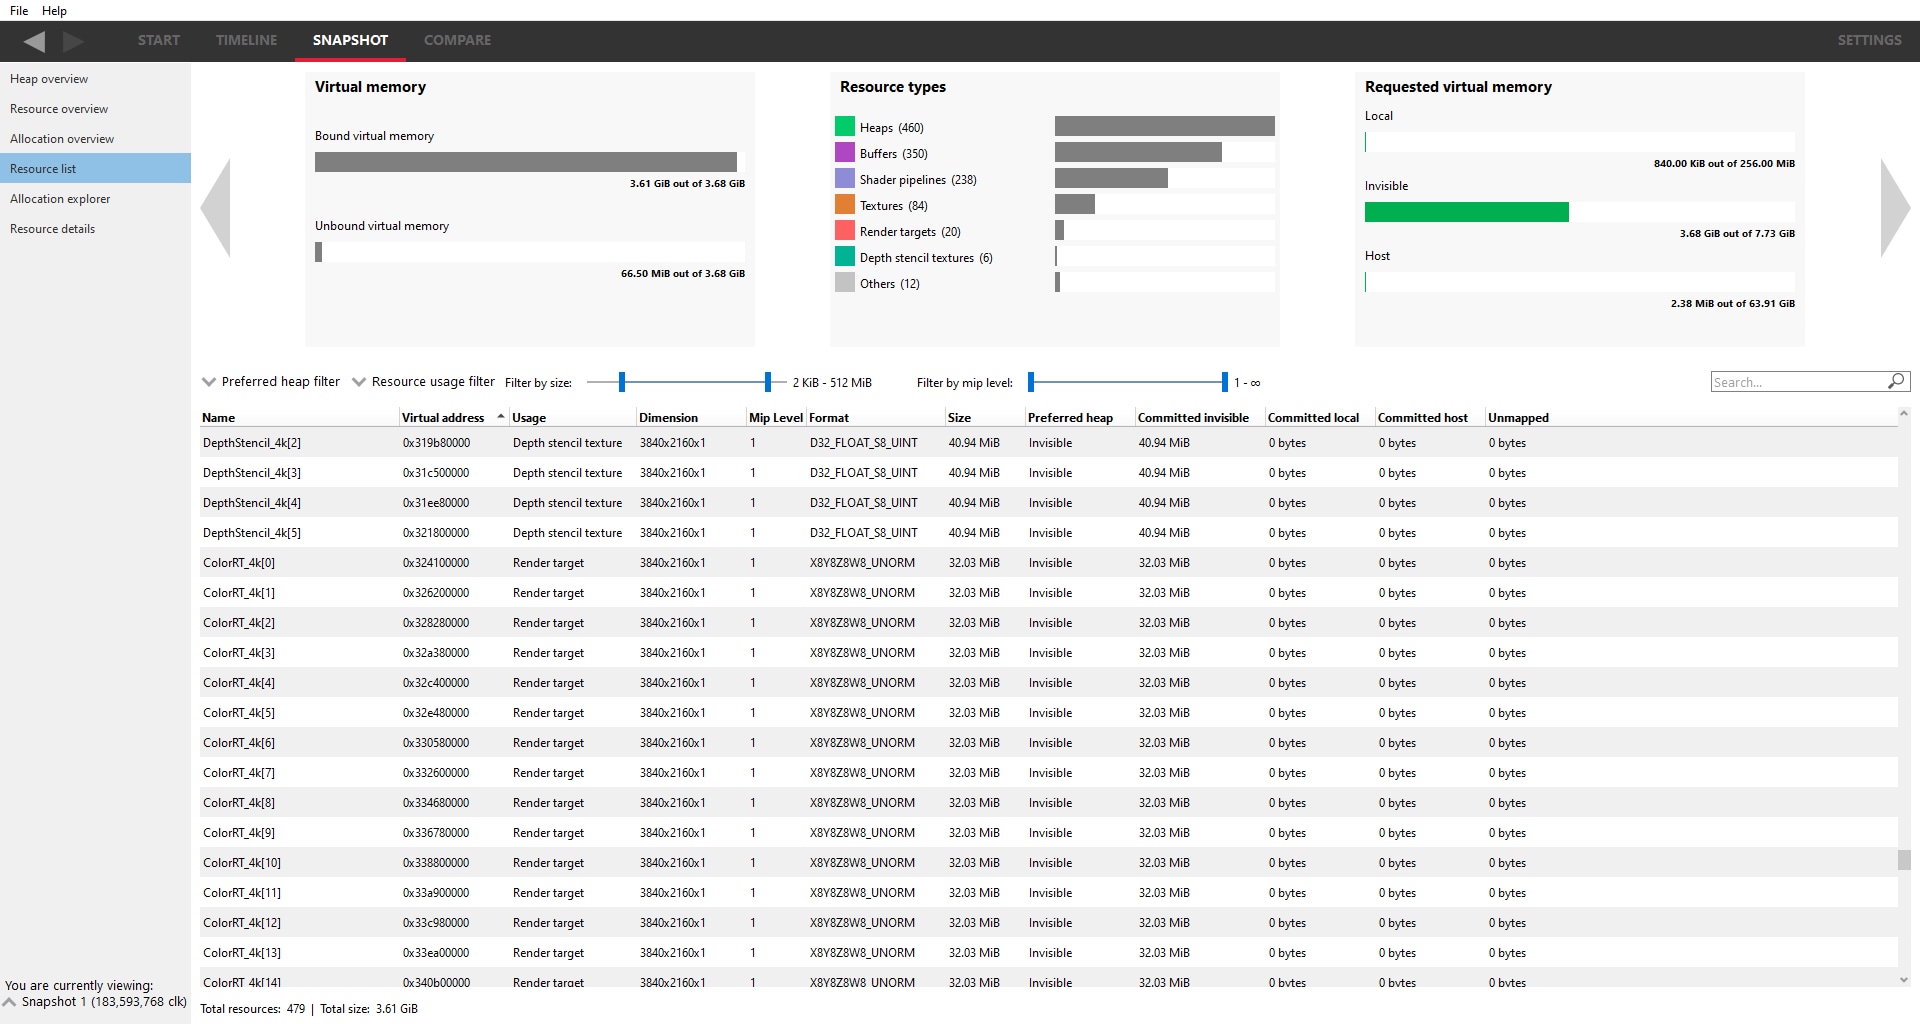
The resource list table now includes Dimensions, Mip levels, and Format columns for texture resources, giving you more detail about each allocation without needing to navigate into individual resources. A mip level slider has also been added alongside the existing Filter by size slider, allowing you to filter the table to show only textures with a specific number of mip levels.
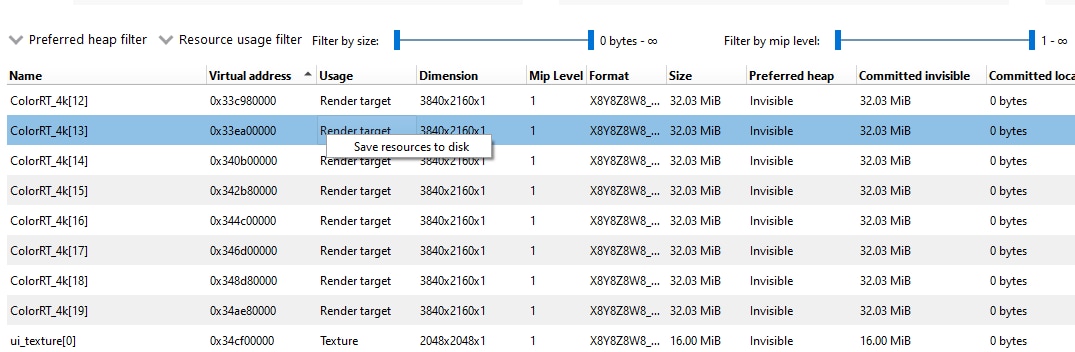
You can now export resource tables in the Resource list pane and the Allocation explorer pane directly to disk. Right-clicking on the table contents brings up a context menu with an option to save the table as a CSV file, making it straightforward to do further analysis in a spreadsheet or share the data with a colleague.
RGA 2.14.2 is a patch release with bug fixes and stability improvements.
RDP 3.5 introduces a new command-line interface, a reorganized UI, improved system information, improved profiling capture control, and a quality-of-life improvement for crash analysis workflows.
RDP 3.5 ships a new executable, RadeonDeveloperPanelCLI, that exposes RDP’s full capture functionality without requiring a GUI, with feature parity with the desktop application. This makes it possible to script profile captures as part of automated test pipelines or batch workflows, opening the door to integration with CI systems, agentic engineering workflows, and other tooling where launching a desktop application is not practical.
The Driver experiments and Device clocks panels have moved from the Capture tab to a new dedicated System tab. This reorganization separates system-level configuration from the per-capture workflow, making it easier to find and adjust settings that apply across sessions.
The System Info panel now displays all drivers installed on the system, with per-GPU driver version details. This gives you a complete picture of your driver environment at a glance, which is especially useful when working with multi-GPU configurations or troubleshooting driver-related issues.
When Capture mode is set to Draw or Dispatch, you can now specify the number of draws or dispatches to capture directly in the profiling view. This replaces a more cumbersome workflow in previous versions, making it easier to capture exactly the slice of work you’re interested in.
As mentioned in the RGD section above, RGD 1.6.3 adds the ability to recursively search subdirectories when looking for PDB files. RDP 3.5 surfaces this as a new Include subdirectories checkbox in the crash analysis Shader debug information search paths settings, so you can enable recursive searching directly from the RDP UI without needing to pass a command-line flag to RGD manually.
We are thrilled to bring you these updates in the AMD Radeon Developer Tool Suite, designed to empower developers with enhanced capabilities for profiling, analyzing, and optimizing their GPU applications. To learn more about these tools and download the latest release, visit AMD GPUOpen Tools. Explore the full suite of developer tools and resources available to support your development journey.
Links to third-party sites are provided for convenience and unless explicitly stated, AMD is not responsible for the contents of such linked sites, and no endorsement is implied. GD-98
DirectX, Microsoft, and Windows are registered trademarks of Microsoft Corporation in the US and/or other countries.