Features
Profiling
This feature supports capturing a GPU profile for viewing in Radeon GPU Profiler.
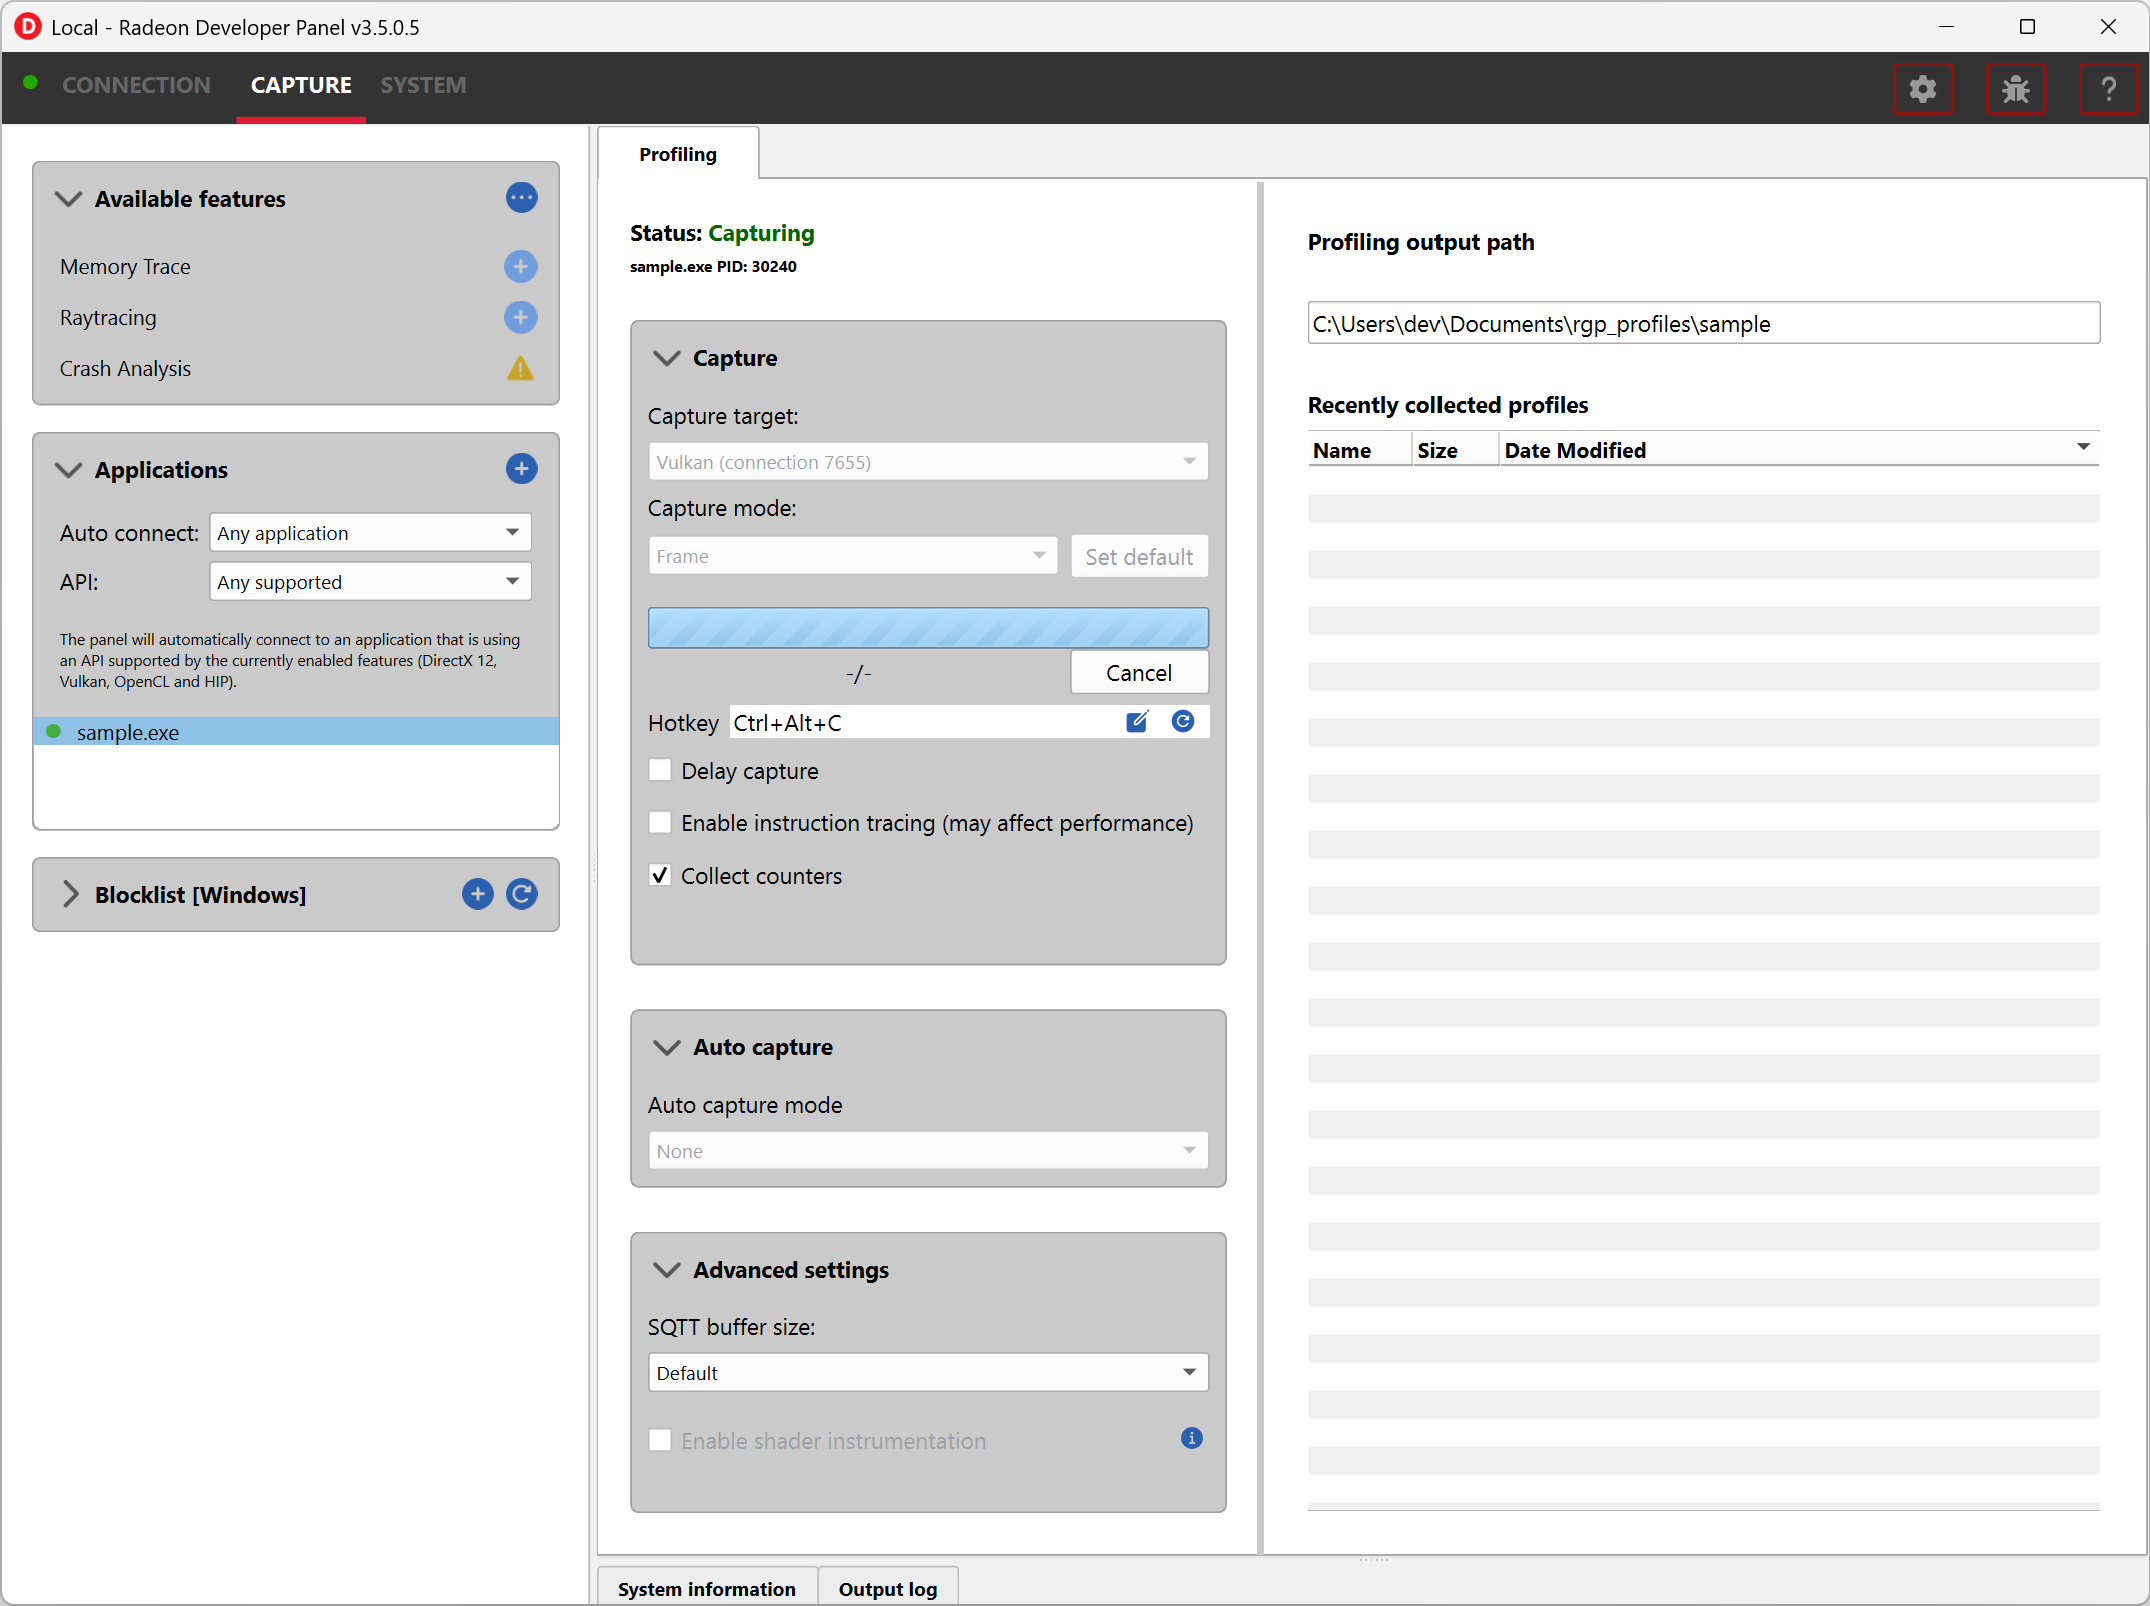
The Capture section has the following items for profiling:
-
Capture target - Selects the driver connection that should be profiled when a capture is triggered.
-
Capture mode - Selects what should be captured when a capture is triggered.
Frame - Capture all draws and dispatches that occur within a single frame.
Draw - Capture a specified number of consecutive draw calls.
Dispatch - Capture a specified number of consecutive compute dispatches.
-
Set default - Saves the current capture mode as the default for the connected application. Defaults are stored as presets and are remembered per graphics API.
-
Render op count - The number of draws (in Draw mode) or dispatches (in Dispatch mode) to capture. This field is only shown when Capture mode is set to Draw or Dispatch.
-
Capture profile - Captures a profile using the selected capture mode and writes it to disk. The hotkey described further below performs the same action.
-
Delay capture - When enabled, pressing the Capture profile button or triggering the hotkey waits the entered number of milliseconds before starting the capture.
-
Enable instruction tracing - Enables capturing detailed instruction data.
-
Collect counters - Enables capturing GPU cache counter data. Systems with an AMD Radeon RX 6000, AMD Radeon RX 7000, or AMD Radeon RX 9000 series GPU will also collect raytracing counter data.
The Auto capture section has the following options for profiling:
-
Auto capture mode:: - Displays configuration options for auto capturing of profiles.
-
None uses the selected capture mode when clicking the Capture profile button.
-
Frame allows for specifying a specific frame index to trigger capture on.
-
Dispatch range allows for setting the start and stop dispatch indices to use during automatic profile capture.
-
Dispatch timer allows for specifying the number of dispatches to capture after a specified elapsed time.
-
The Advanced settings section has the following options for profiling:
-
SQTT Buffer Size:: - Defines the size of the buffer where SQTT data will be stored.
-
If a profile has missing data, the SQTT buffer size can be increased to potentially remedy the issue.
-
If an application experiences graphical corruption, decreasing the SQTT buffer size can potentially remedy the issue.
-
-
Enable shader instrumentation: - Enables support for capturing more detailed shader instrumentation data.
Capturing a profile can be achieved by the following:
- Click the Capture profile button
Clicking the Capture profile button from the Profiling UI will capture a frame and write the results to disk.
- Use the Ctrl-Alt-C hotkey
Using Ctrl-Alt-C default hotkey on Windows or Linux® will capture a frame and write the results to disk.
This can be configured before launching an application by clicking the edit button to the right of the hotkey label and then entering a series of key presses.
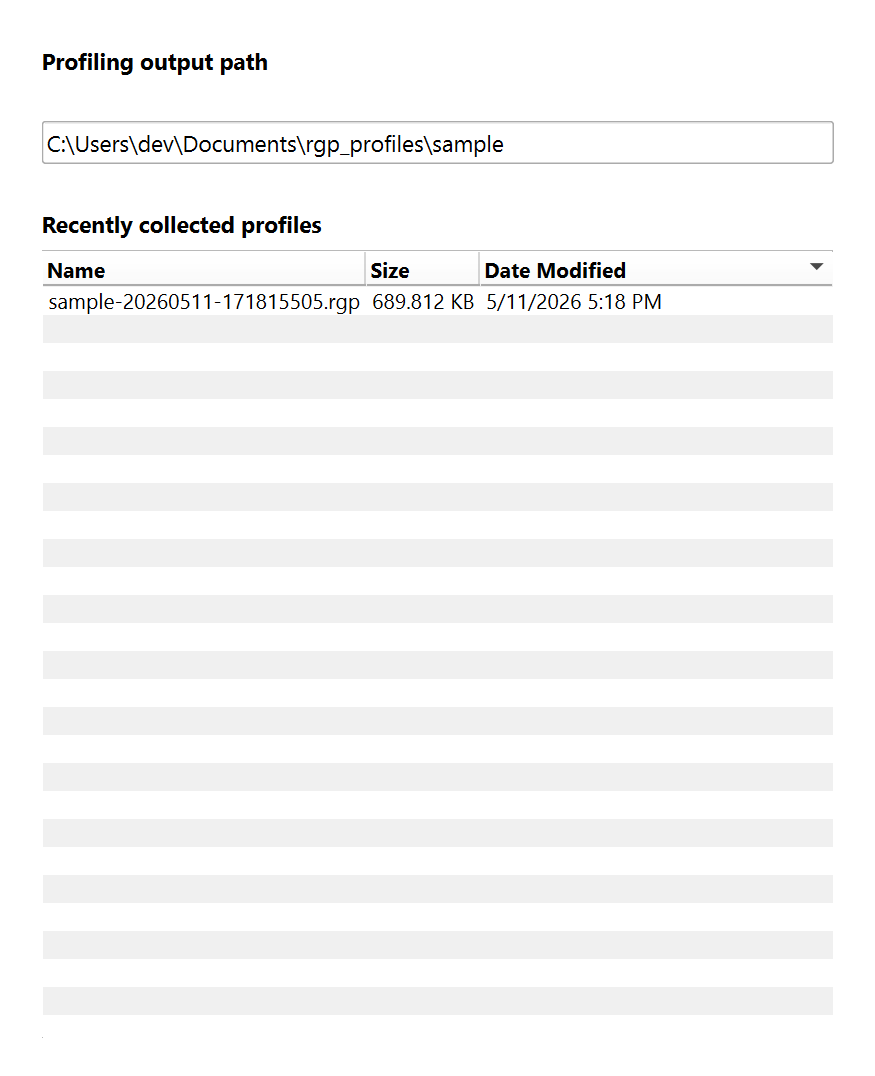
Example output:
sample-20260511-171815505.rgp
Memory Trace
This feature enables capturing a memory trace for viewing in Radeon Memory Visualizer.
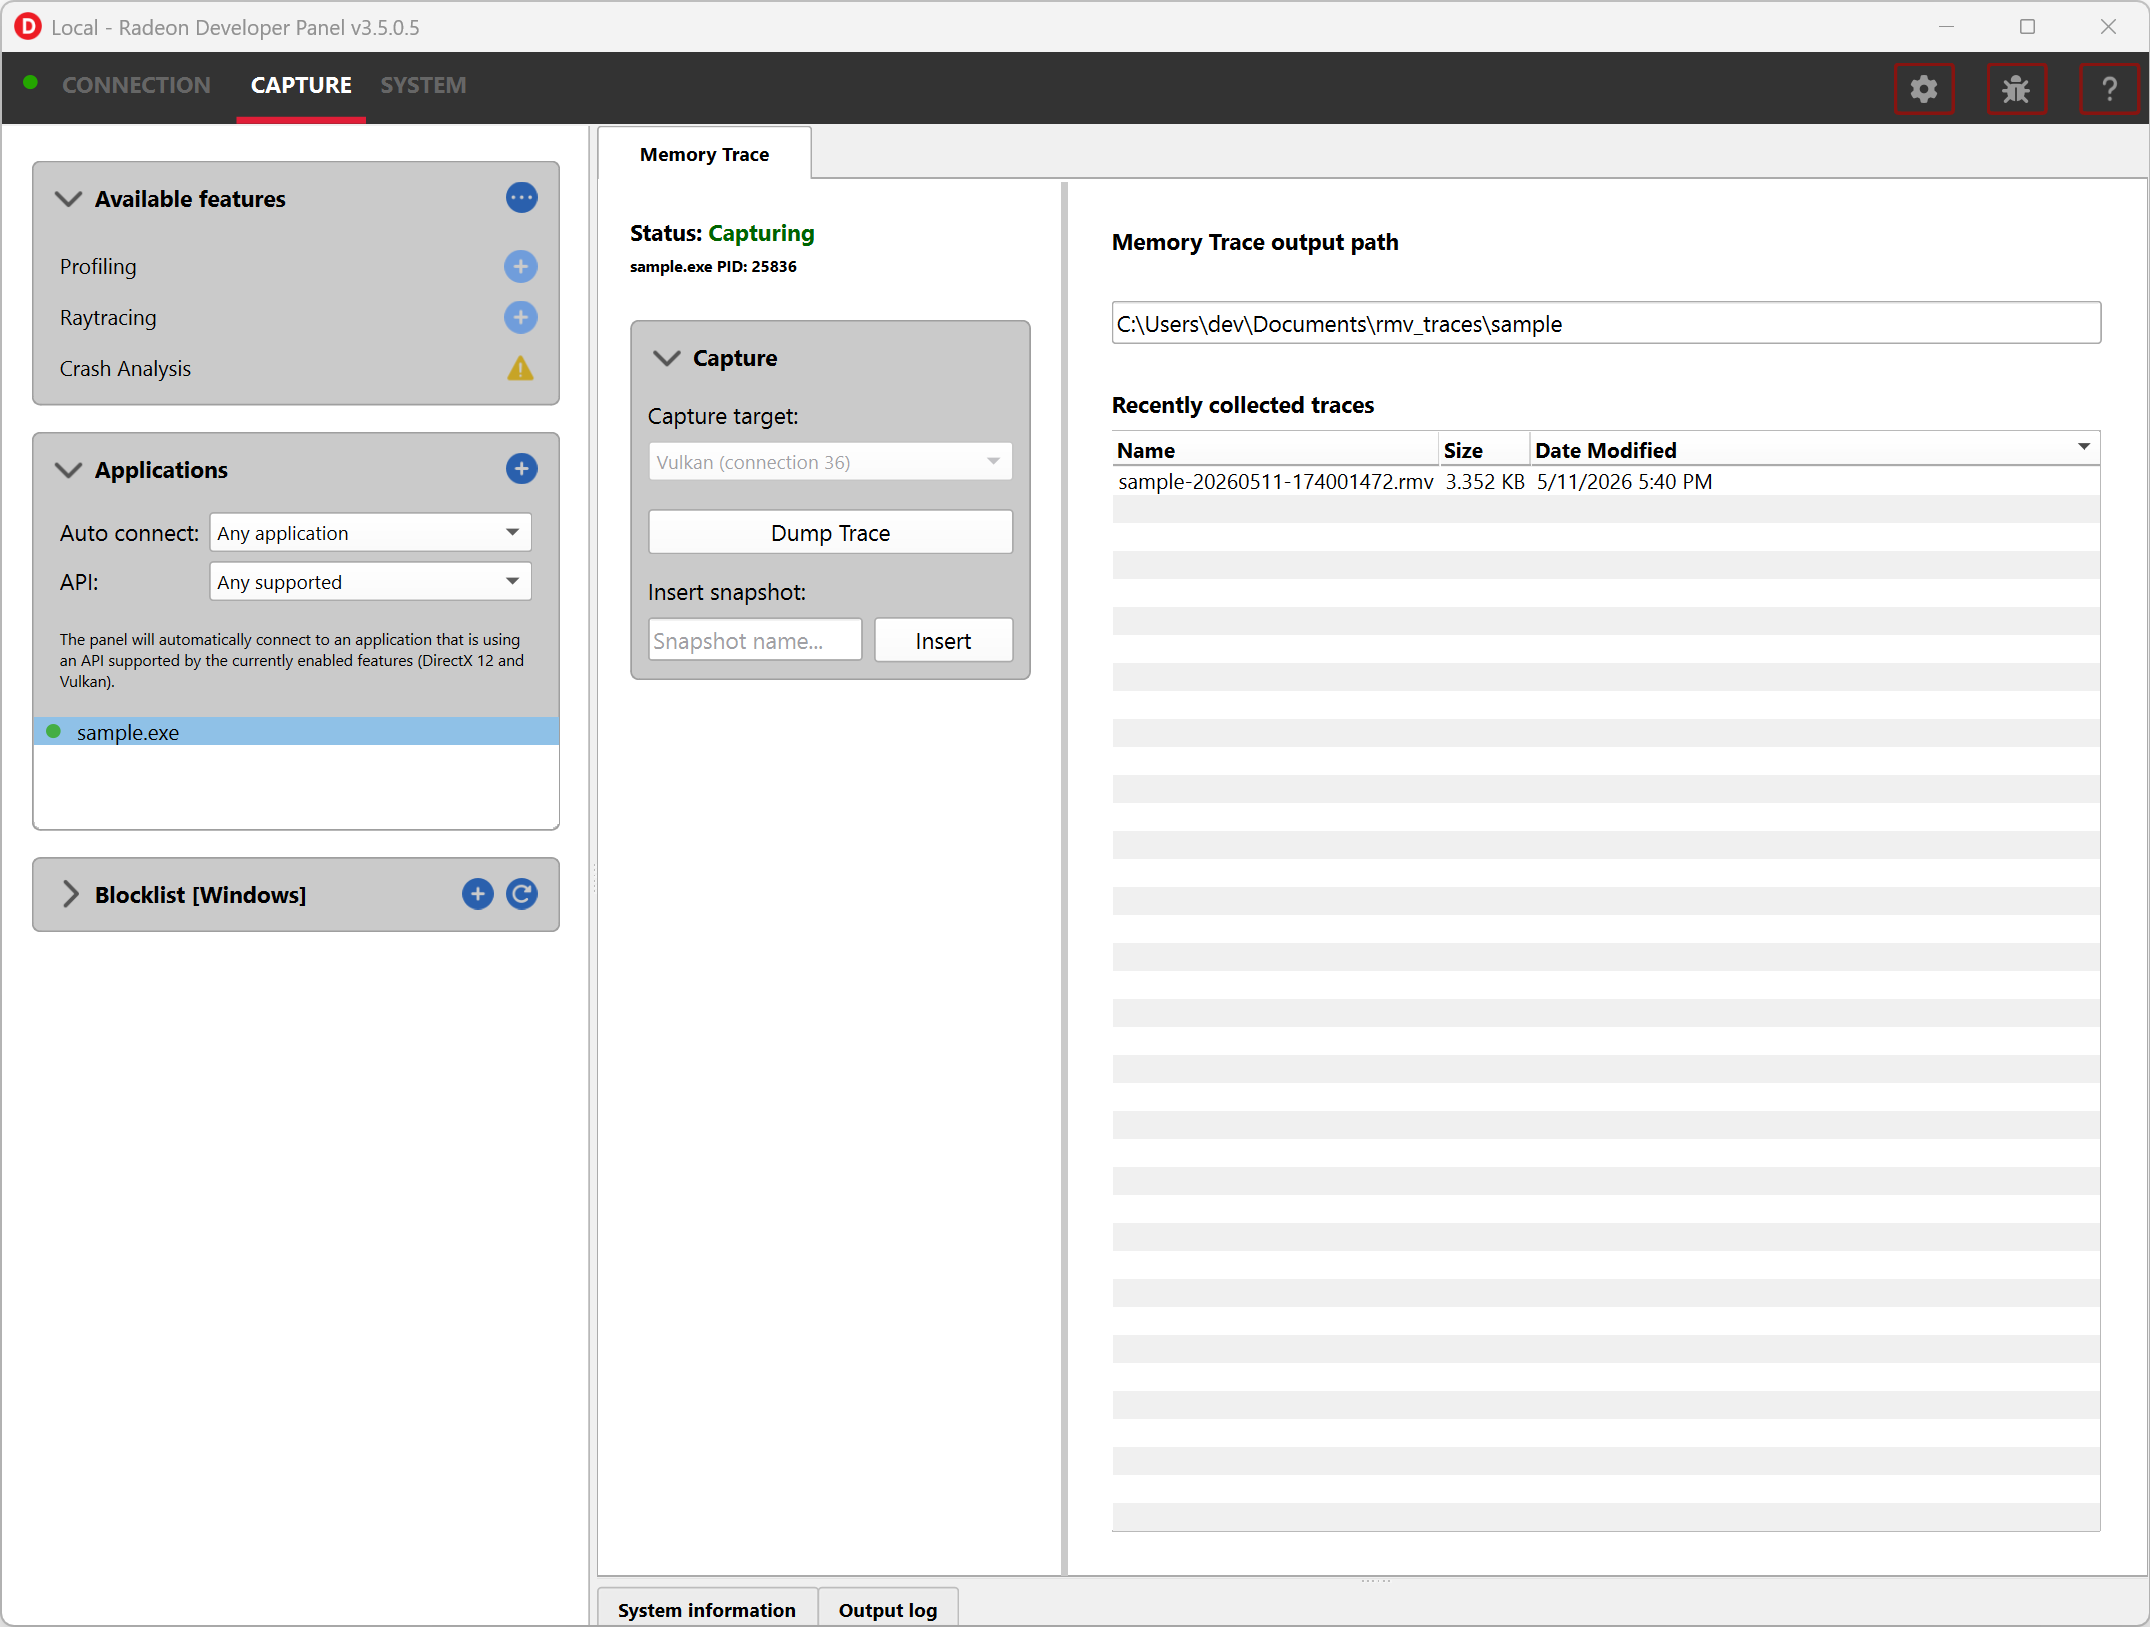
The Capture section has the following items for memory tracing:
-
Capture target - Selects the driver connection that should be dumped when the dump button is pressed.
-
Dump trace - Stops memory tracing for the selected capture target and writes results to disk.
-
Insert snapshot - insert user specified identifier to define snapshot in trace. A snapshot captures a moment in time in much the same way as a photograph. For example, to spot memory leaks, 2 snapshots can be added; one just before a game level is started after the menu screens and another snapshot when the game level finishes once the user is back in the game menus. Theoretically, the game should be in the same state in both cases (in the menus before and after a game level).
-
Recently collected traces - displays any recently collected traces in output directory
Writing out the memory trace to file can be achieved by one of the following:
- Close the running application
When the client application terminates, the memory tracing will stop and the results will be written to disk.
- Click the Dump trace button
Clicking the Dump trace button from the Memory Trace UI will stop memory tracing and write the results to disk.
Using either of the above methods to complete memory tracing will result in a Radeon Memory Visualizer trace file being written to disk.
Example output:
sample-20260512-103047.rmv
Raytracing
This feature enables capturing a raytracing scene for viewing in Radeon Raytracing Analyzer.
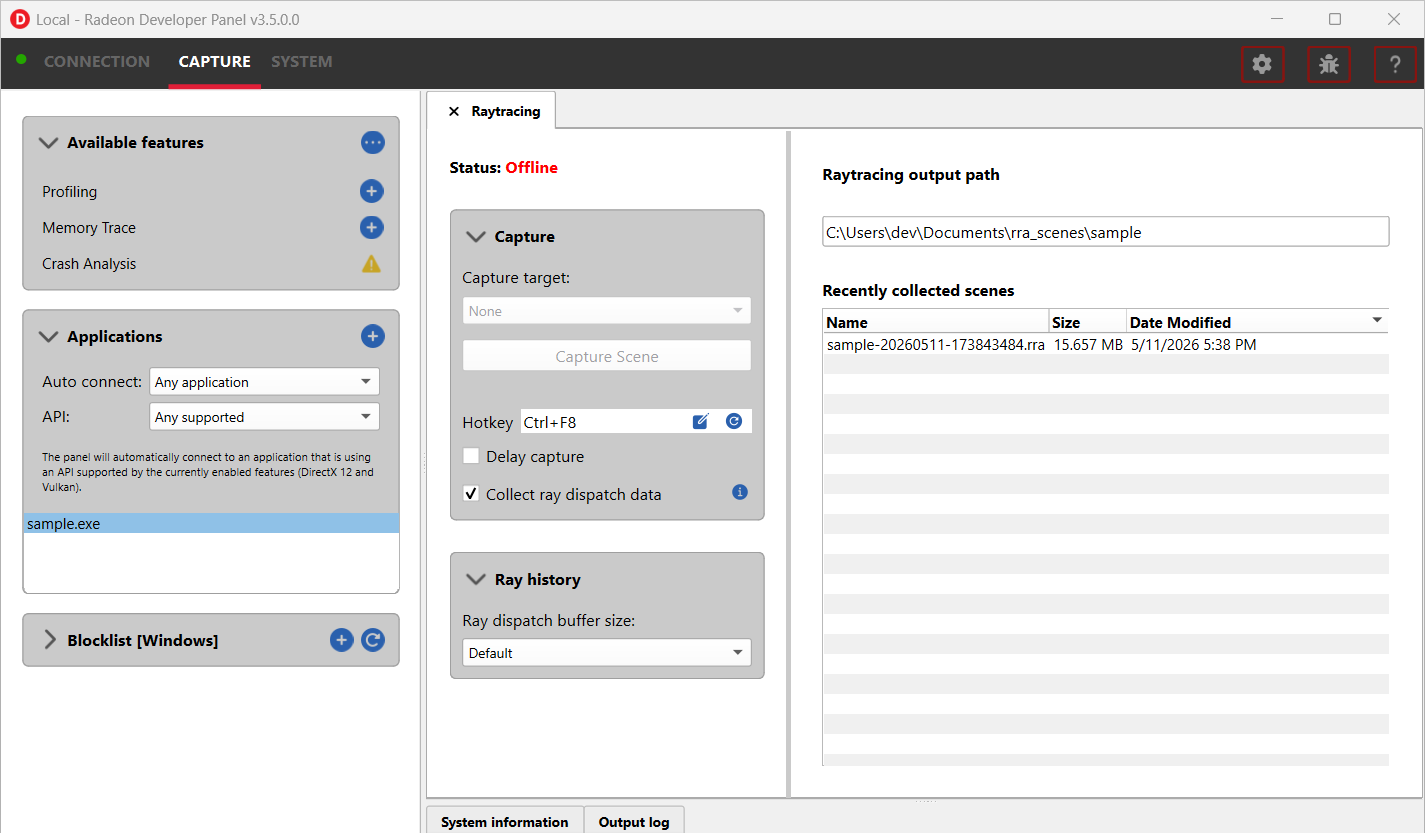
The Capture section has the following items for raytracing:
-
Capture target - Selects the driver connection that should have its raytracing scene captured when a capture is triggered.
-
Capture scene - Captures a scene and writes to disk.
-
Delay capture - If this is enabled, pressing the capture scene button or triggering the hotkey will first wait the entered number of milliseconds before capturing.
-
Collect ray dispatch data - Captures detailed information about ray dispatches.
- Recently collected scenes - Displays any recently collected scenes found in the output directory.
Ray history section allows for configuring settings for collecting ray dispatch data
- Ray dispatch buffer size:: - Defines the buffer size in system memory used for allocating ray dispatch data during scene capture.
Capturing a scene can be achieved by the following:
- Click the Capture scene button
Clicking the Capture scene button from the Raytracing UI will capture a raytracing scene and write the results to disk.
- Use the Ctrl-F8 hotkey
Using Ctrl-F8 default hotkey on Windows or Linux® will capture a raytracing scene and write the results to disk.
This can be configured before launching an application by clicking the edit button to the right of the hotkey label and then entering a series of key presses.
Example output:
sample-20260512-114215.rra
Crash Analysis
This feature enables capturing a GPU crash summary using Radeon GPU Detective.
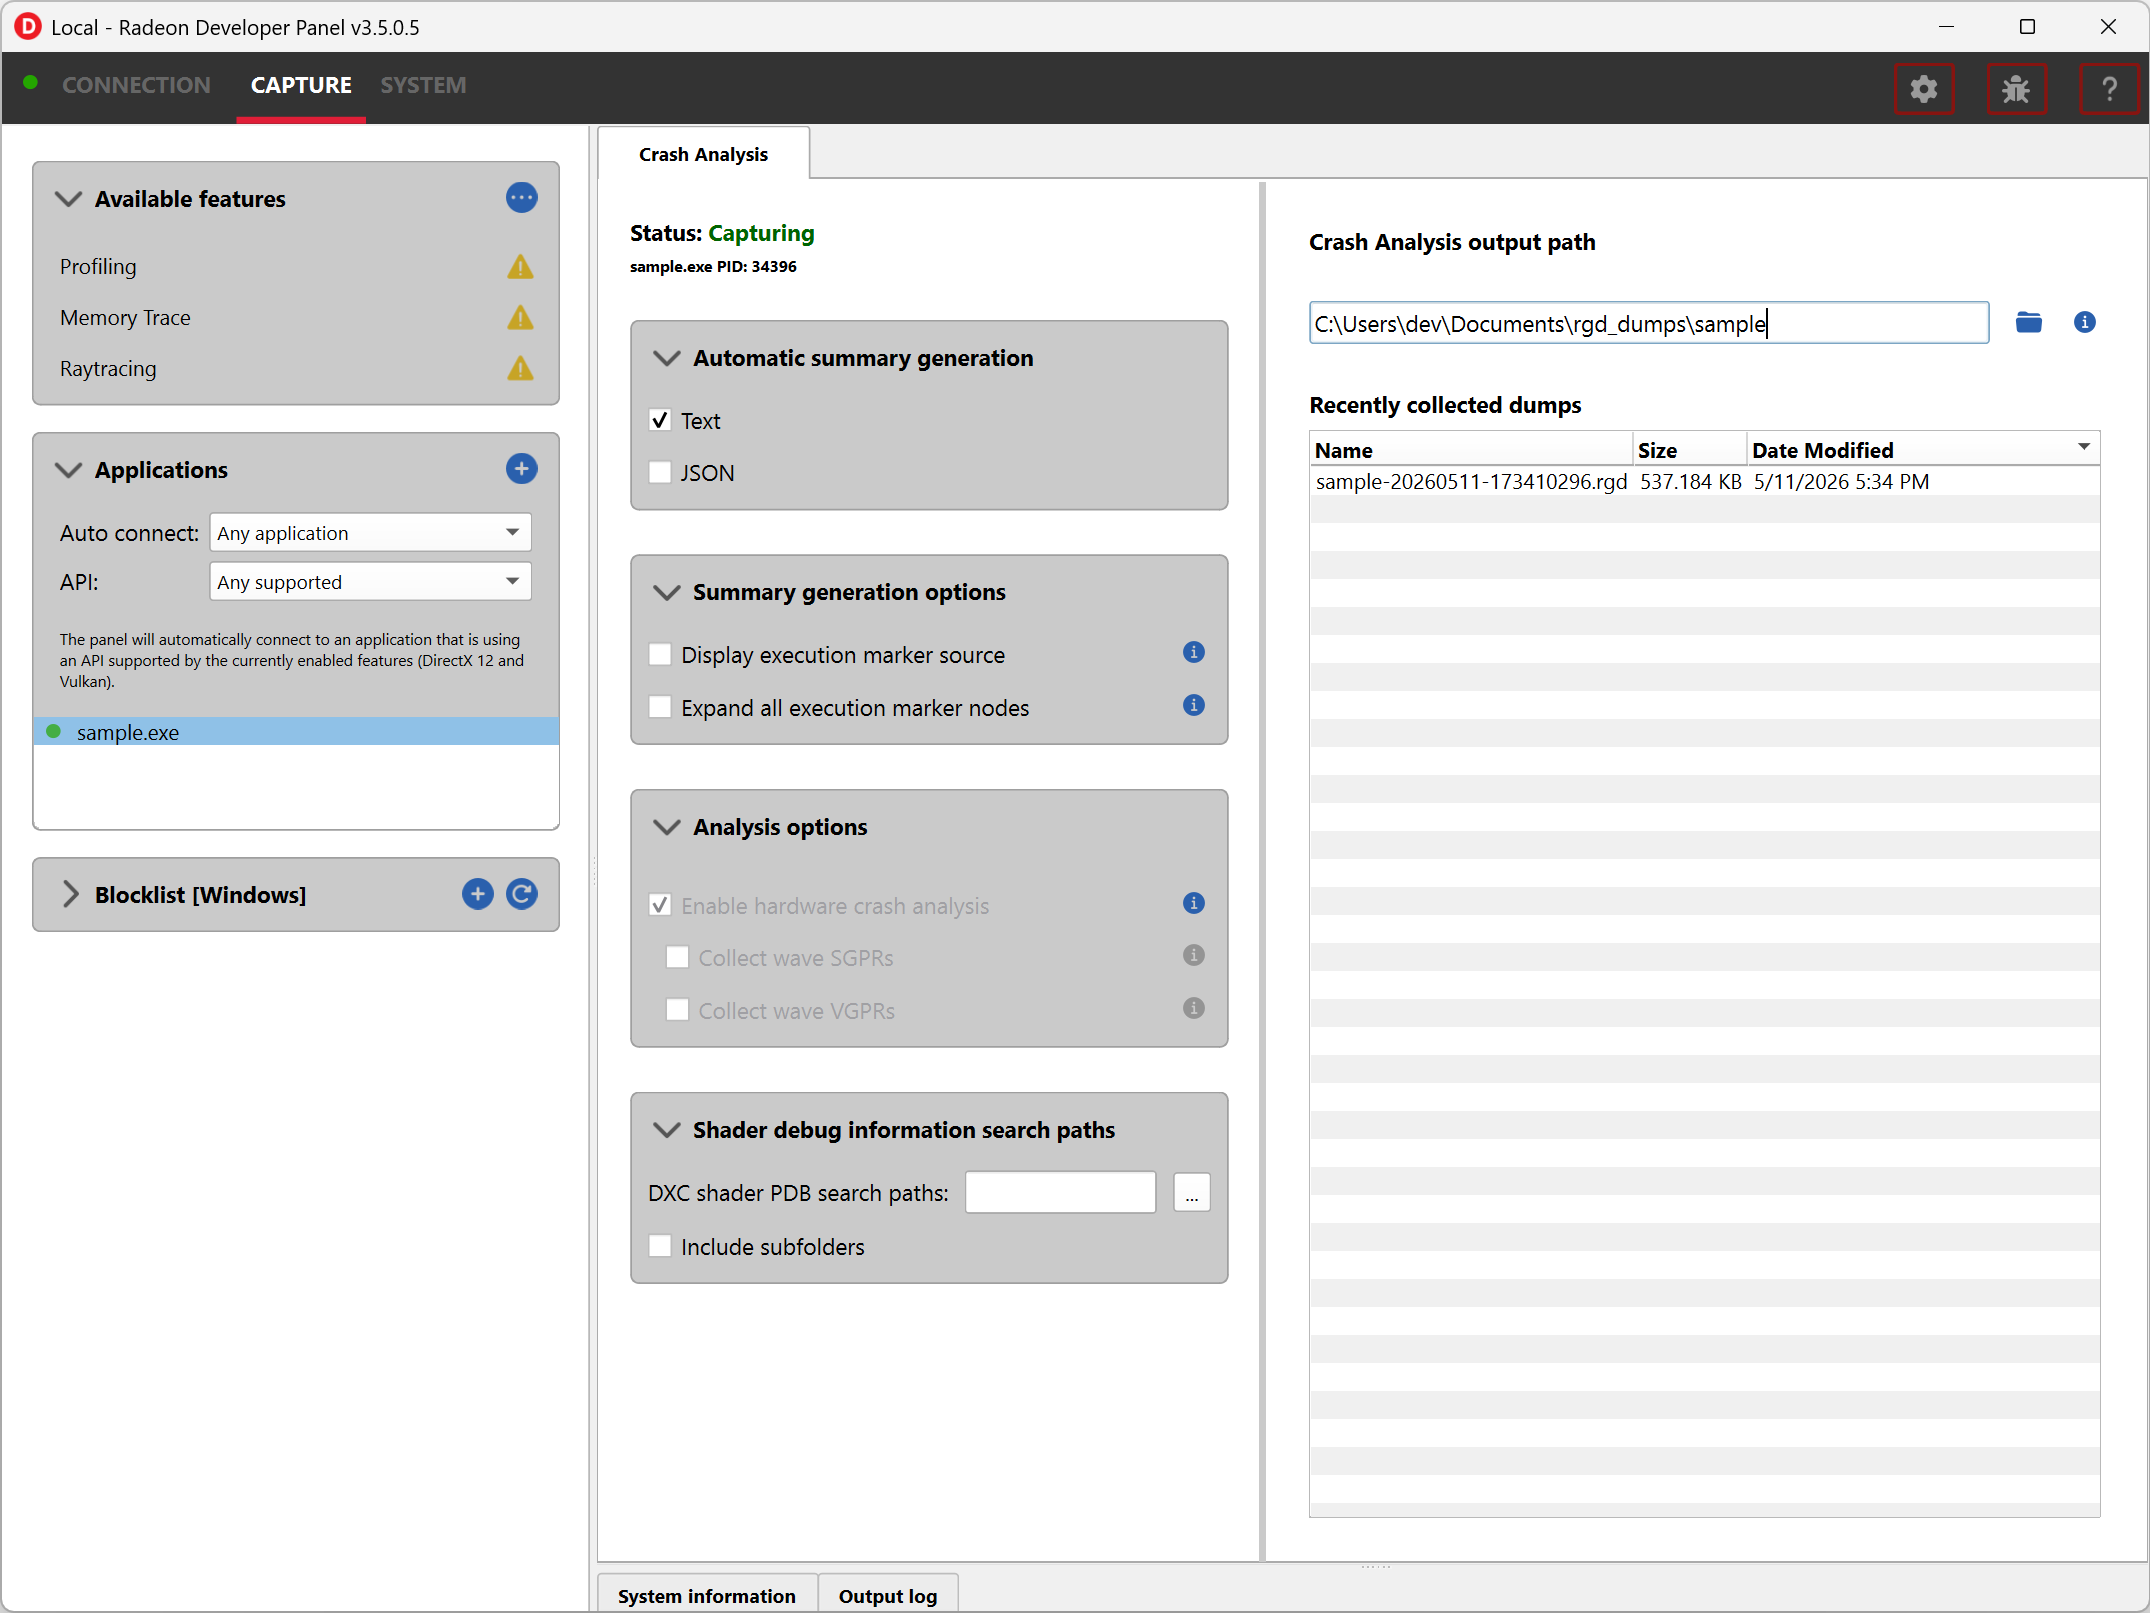
Before running an application to generate a crash dump, there are a few settings that can be configured in the capture settings pane shown here:
-
Directory to store your dumps - Path on disk where crash dumps are written out.
-
Automatic crash summary generation
For convenience, enabling these options will generate the respective crash dump summaries automatically upon capture.
- Display execution marker source
If checked, each marker node in the generated summary file’s execution marker tree will contain a tag specifying the source that generated the marker (such as Application, Driver, etc.).
- Expand all execution marker nodes
If checked, all execution marker nodes in the marker tree will be expanded.
The Analysis options section lists configuration options:
- Enable hardware crash analysis
When enabled, RGD collects low-level information about the GPU hardware state upon crash and augments the information that is presented in the Crash Analysis (.rgd) output file with meaningful insights.
-
Collect wave SGPRs: When enabled, RGD collects wave SGPRs to get more detailed information about the resource descriptors used by an in-flight instruction at the time of the crash.
-
Collect wave VGPRs: When enabled, RGD collects wave VGPRs to get more detailed information about the in-flight waves at the time of the crash.
The Shader debug information search paths section allows for configuring DXC shader PDB file search paths which will be used during crash dump generation.
- Include subfolders - When enabled, each configured PDB search path is searched recursively. Disable this option if you want a search path to be used as-is, without descending into its subdirectories.
When provided and PDBs are successfully correlated the associated shader entry points and source files will be available to rgd.exe. Please see Radeon GPU Detective documentation for more information.
Once active, a GPU crash dump will be created once a TDR occurs.
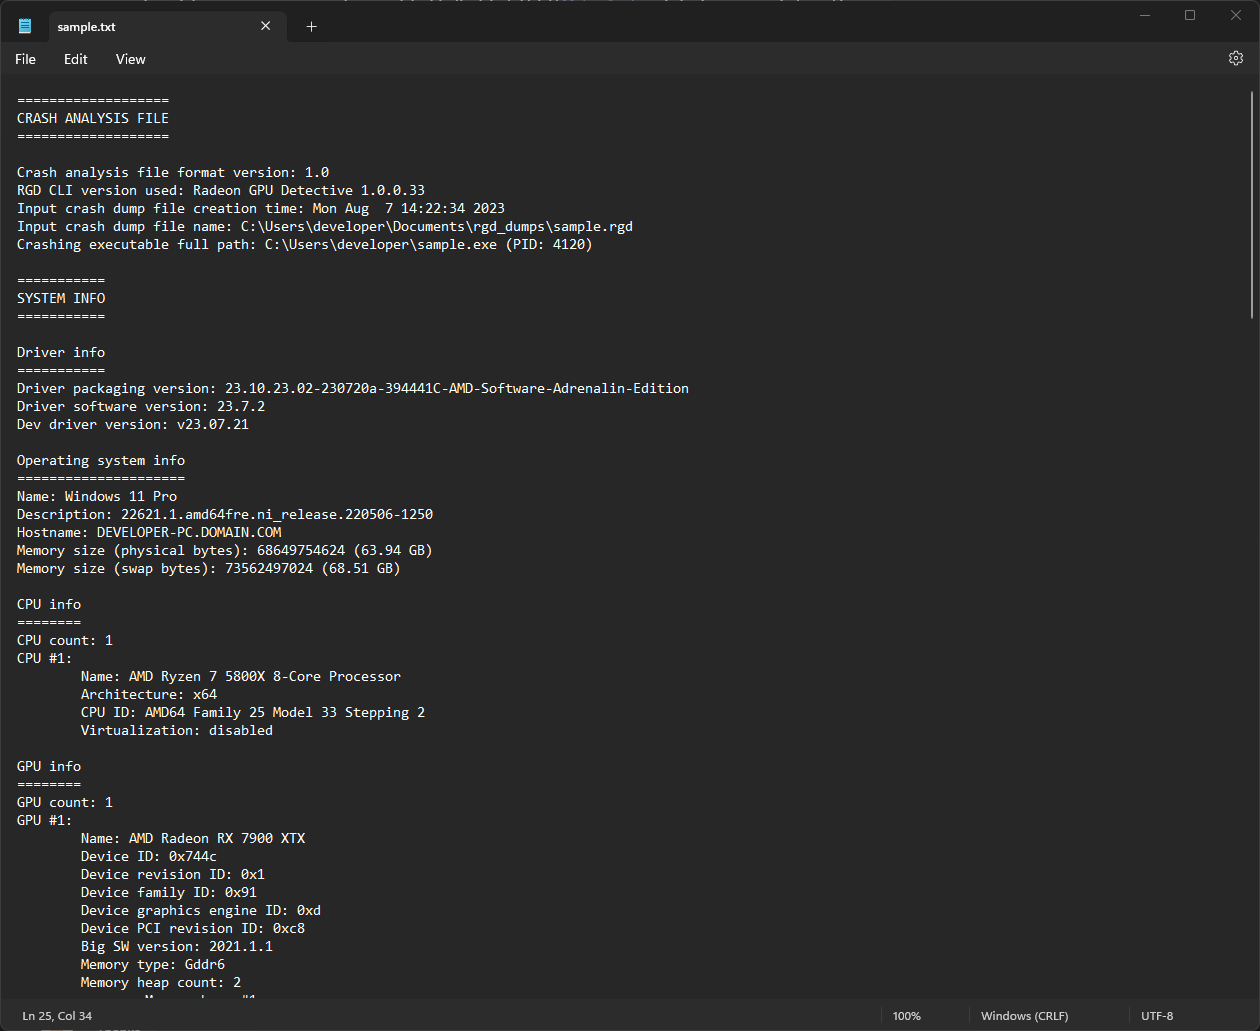
Example output:
sample-20260512-133405.rgd
Right clicking on a dump in the recently collected dumps pane will open a context menu with options to open the generated crash summaries in the text editor specified in the Radeon Developer Panel settings. If a summary has not been generated, an option will be present to first generate the summary using the Radeon GPU Detective CLI, then open the summary. Deleting a dump from this context menu will also remove any summaries that have been generated.
Shown here is a sample crash dump summary: