System
The System tab groups options that affect the local system used for development. It contains the Driver Experiments and Device Clocks features.
Driver Experiments
Driver Experiments offer a way to change the behavior and performance characteristics of a game or other graphics application without modifying its source code or configuration. They control the low-level behavior of the graphics driver. This tool exposes some of the driver settings that were previously only available to AMD engineers who develop the driver, e.g. disabling support for ray tracing or some optimizations in the shader compiler. Experiments are separate per graphics API (DirectX 12, Vulkan). Both APIs offer a similar set of experiments, but not all experiments are available for every API.
Experiments may be used as the only feature in Radeon Developer Panel or together with other features. For example, taking an RGP capture while experiments are activated will allow you to observe how the experiments influenced the performance of some specific render passes and draw calls. Alternatively, you may enable Crash Analysis feature and capture an RGD crash dump. Opening files captured with active driver experiments in their respective tools will display a notification that the file was captured with some driver experiments applied, and lists their values.

Activating driver experiments
After driver experiments are activated, the desired test application will need to connect to Radeon Developer Panel to apply the experiments. Experiments are active only as long as Radeon Developer Panel is running. Closing the Panel application or restarting the system reverts them to defaults.
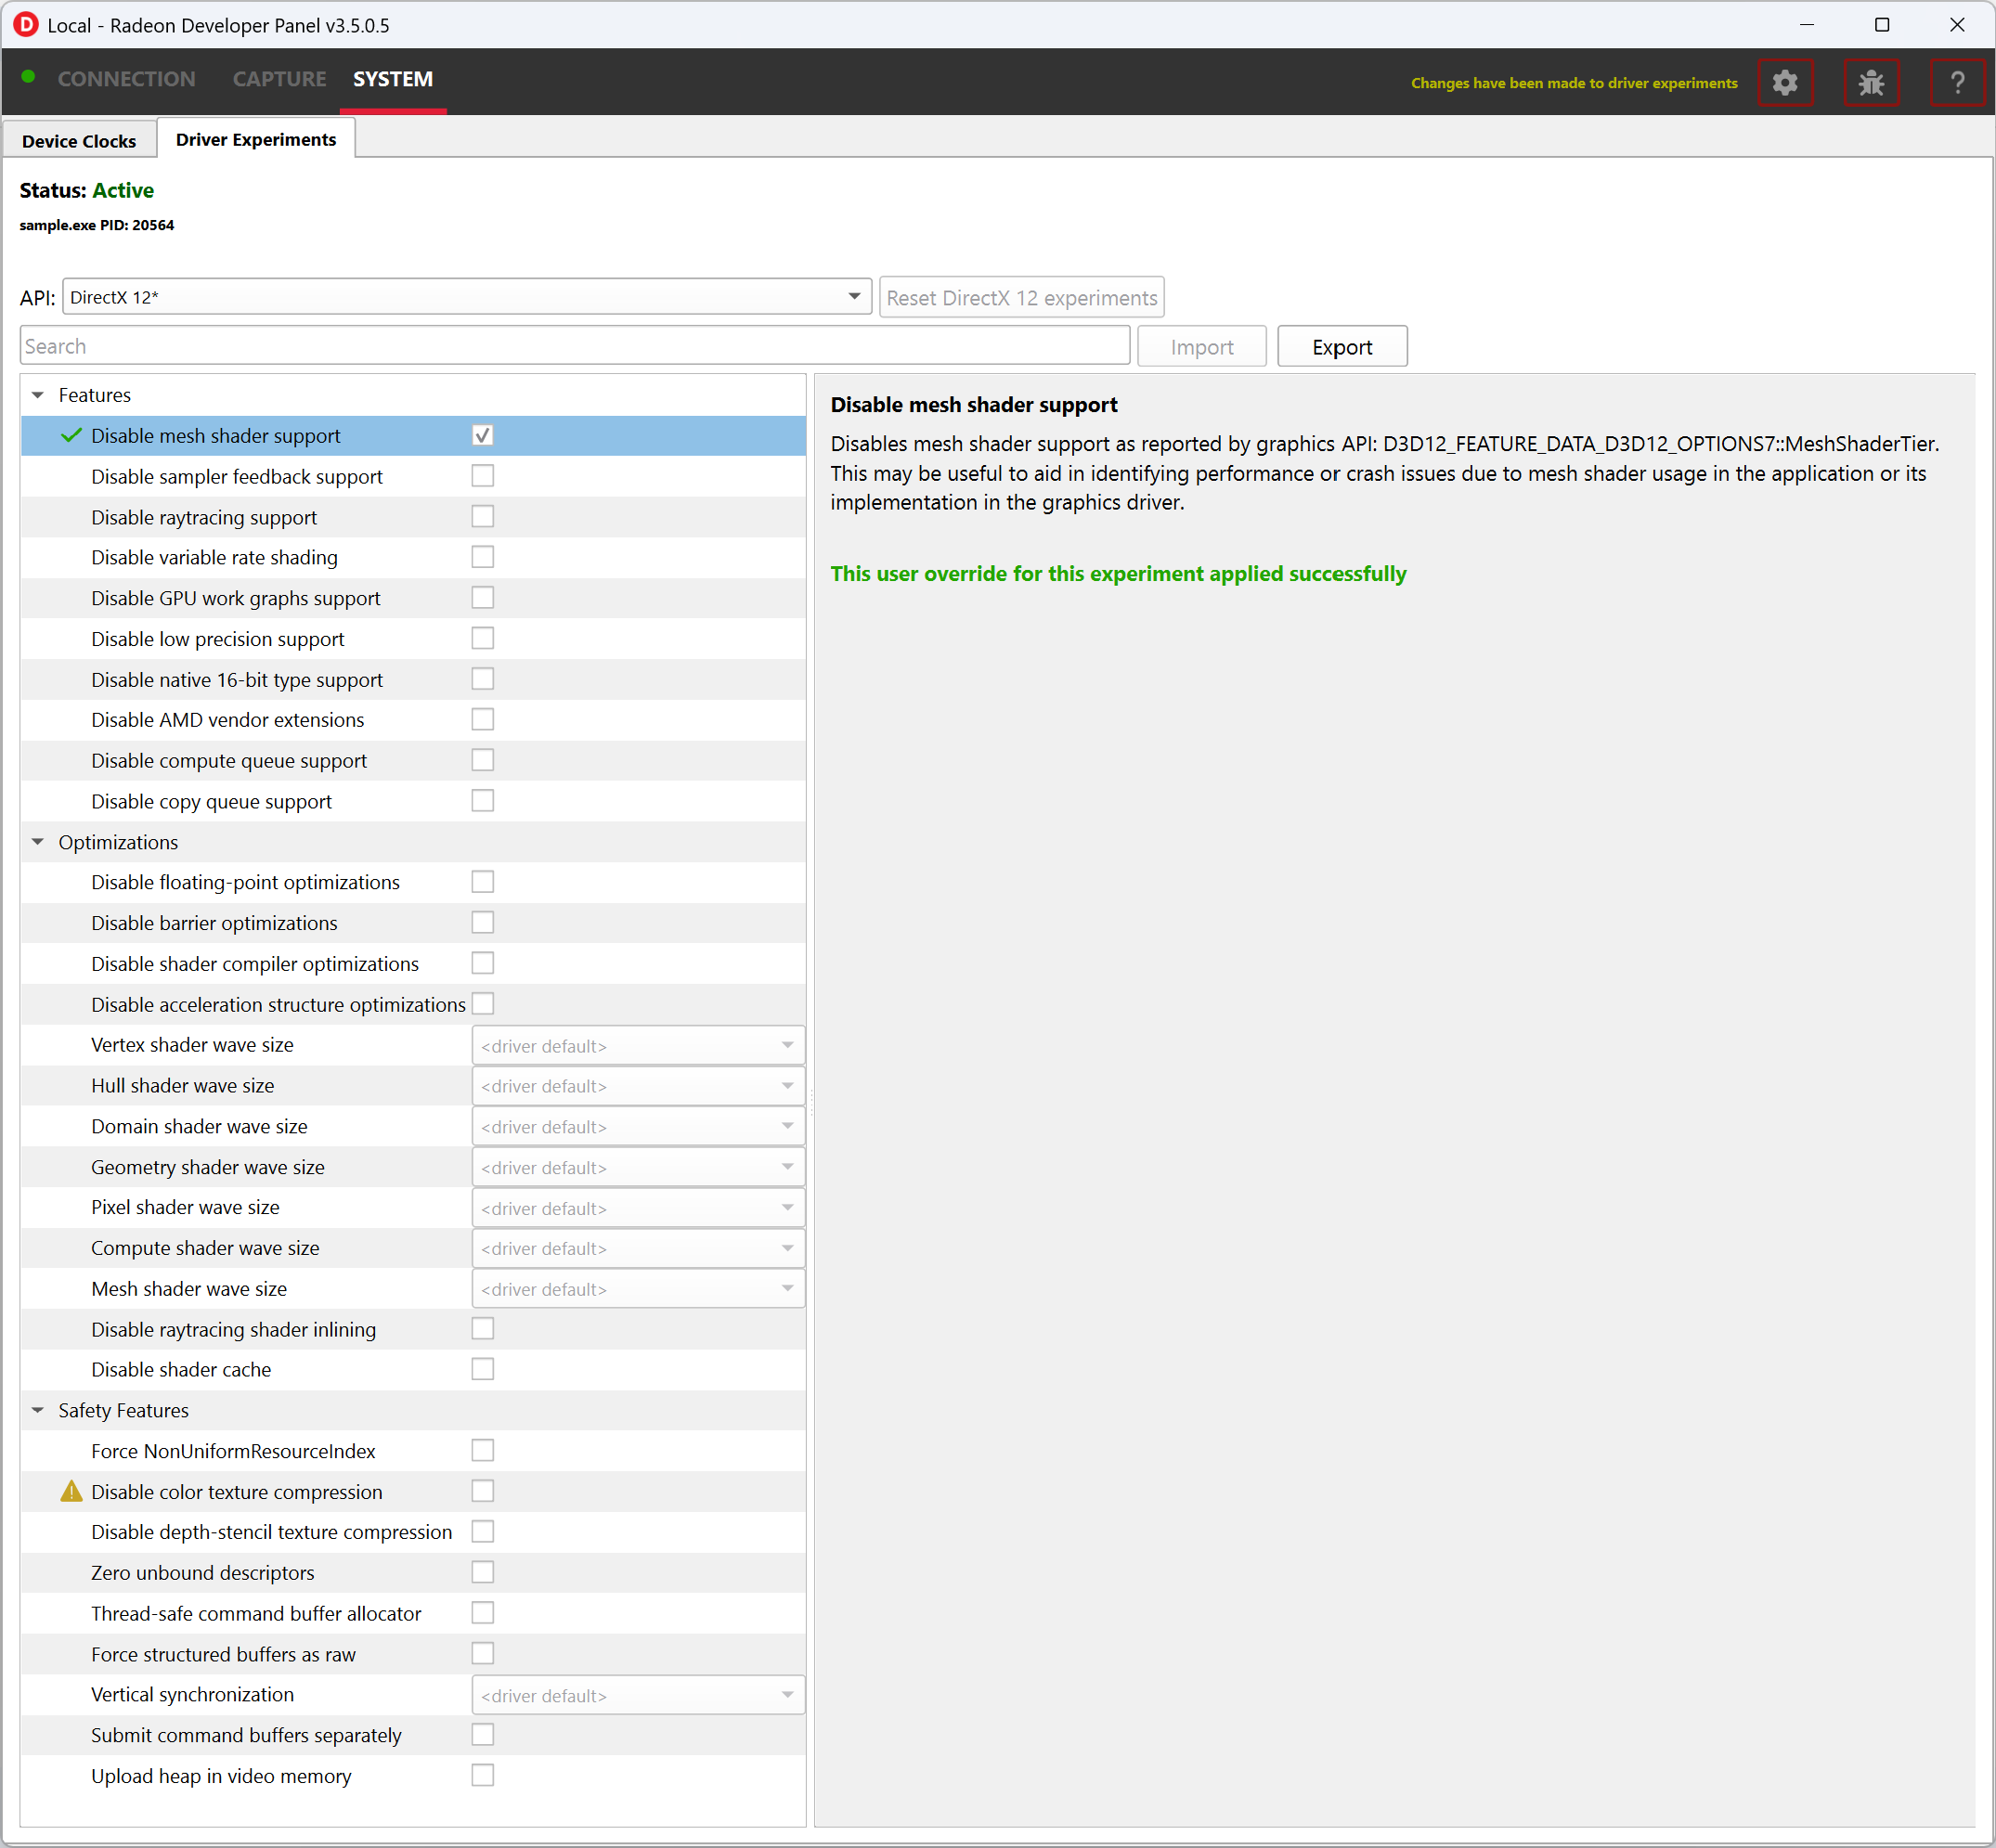
The details pane will contain a description of the state of the selected experiment once an application connects. A corresponding indicator will also be displayed in the experiments list to the left of each experiment name:
-
Modified: The user has provided an override for the experiment, but it has not yet been applied in a connected application.

-
Applied: The user override was successfully applied and the driver behavior will be changed.

-
Failed to apply: The user override was not accepted by the driver and the driver’s behavior will remain unchanged.

-
Unsupported: The driver reported that this experiment was not currently supported. If the experiment was set by the user, the value was not applied in the driver.

The user overrides of experiments can be saved to a JSON file using the Export button and loaded later using the Import button.
Available driver experiments
Features
Experiments in this group allow disabling support for some of the hardware features of modern AMD/Radeon GPUs, which may be useful for debugging.
Disable mesh shader support
Disable sampler feedback support
Disable raytracing support
Disable variable rate shading
Disable GPU work graphs support
These experiments make it possible to disable support for some of the new GPU hardware features. When activated,
the graphics API exposes no support for the feature, like D3D12_FEATURE_DATA_D3D12_OPTIONS7::MeshShaderTier,
or the equivalent Vulkan extension, like VK_EXT_mesh_shader, as if the GPU doesn’t have the support.
Applications that don’t require the feature typically then fall back to some other implementation, e.g. using vertex shaders instead of mesh shaders or using screen-space reflections instead of ray-traced reflections. If there is a bug in the application code that uses the feature, which makes it crash or return incorrect results, disabling the feature allows testing without the feature enabled. For example, if an application is crashing and activating the “Disable raytracing support” experiment alleviates the crash, it can be surmised that the raytracing code is causing the crashes.
Disable low precision support
Disables support for 16-bit floating point numbers (half-floats) in shaders when used as minimum precision numbers.
Minimum precision numbers in HLSL, like the min16float type, allow declaring variables where 16-bit precision is
sufficient. If half-floats are not supported in some operation or if it would yield better performance, the shader
compiler will use a full 32-bit (single precision) float. With this experiment activated,
minimum precision numbers (D3D12_FEATURE_DATA_D3D12_OPTIONS::MinPrecisionSupport) are not supported and such
numbers in shaders fall back to using the full 32-bit precision.
Using half-floats in shaders can improve performance in some cases due to faster calculations and smaller storage
requirements, but it can also be a source of bugs. A 16-bit floating-point number retains only around 3 decimal digits
of precision, can represent integer numbers exactly only up to 2048. Additionally, 16-bit floating points have a maximum
value of 65504, above which they become infinity. This may be enough for calculations on HDR colors or normal vectors,
but it is not sufficient to operate on vertex positions and many other types of data. It is very easy for intermediate
calculations to exceed the maximum value, e.g. in dot product of two vectors. If activating this
experiment fixes the problem of seeing incorrect results of the calculations in shaders, NaN or INF values, then
likely the shader should be modified to use full precision (float). It may also indicate a bug in the shader
compiler, although less likely.
Disable native 16-bit type support
This experiment disables support for explicit 16-bit data types in shaders
(D3D12_FEATURE_DATA_D3D12_OPTIONS4::Native16BitShaderOpsSupported) available in Shader Model 6.2, like the
type float16_t. When the experiment is activated, applications cannot use shaders that utilize native 16-bit types,
and they should fall back to some implementation that uses full precision numbers. If activating this experiment fixes a
bug, it may indicate there is a bug in the 16-bit version of the shader. Possibly, the precision or range of 16-bit numbers is
insufficient for some calculations. It may also indicate a bug in the shader compiler, although less likely.
Disable AMD vendor extensions
Activating this experiment disables support for custom AMD extensions to the graphics APIs. In DirectX 12 it means
extensions available through AMD GPU Services (AGS) library (AGSDX12ReturnedParams::ExtensionsSupported) are
returned as unsupported. In Vulkan, it means VK_AMD_ and VK_AMDX_-prefixed device extensions are not available.
If an application makes use of such custom vendor extensions, this experiment can help with debugging. When the bug is fixed after activating this experiment, it indicates that the problem may be in the incorrect use of one of these extensions.
Disable compute queue support
When this experiment is activated, the Vulkan implementation does not expose compute-only queues. It will be as if
the GPU did not support asynchronous compute queues; for the queue family with VK_QUEUE_COMPUTE_BIT
but not VK_QUEUE_GRAPHICS_BIT set queueCount will be zero. Vulkan applications should typically
be prepared for that and fall back to an implementation that executes its workload on the graphics queue only.
In DirectX 12 there is no way to expose the lack of support for asynchronous compute queue. When the experiment is activated, the GPU executes all commands submitted to compute queues on the graphics queue, serialized with the graphics workload.
This experiment can be used for debugging problems with asynchronous compute. If activating it fixes the bug, it may indicate a problem with synchronization or accessing resources shared between the 3D workload (draw calls) executed on the graphics queue and compute dispatches intended to run in parallel in the compute queue.
Disable copy queue support
Activating this experiment for DirectX 12 makes all copy commands submitted to the copy queue execute on the graphics queue instead, which can help in debugging synchronization issues with workloads intended to run in parallel on multiple queues.
Optimizations
Experiments in this group modify shader compiler and general driver behavior that improves performance. While optimizations should not change the logic, in some cases disabling them may help in debugging various types of issues.
Disable floating-point optimizations
When activated, the compiler skips some of the optimizations typically done on the shader code related to calculations on floating-point numbers, like fusing MUL + ADD instructions into an FMA instruction. While in general optimizations should not change the compiler logic, they can change the precision of some operations, so the numerical results would not be bit-exact to the least significant bits with the unoptimized version. If activating this experiment fixes a bug (e.g., a discrepancy between numerical results of a position-only versus full vertex shader), it may indicate that the application relies too much on the precision of the calculations. Changing some expressions in the shader code may help. It may also indicate a bug in the shader compiler, although less likely.
Disable shader compiler optimizations
When active, the experiment disables shader compiler optimizations which may result in non-optimal shader code. This may cause shaders to take longer to run.
If enabling this experiment fixes a bug, it may indicate the bug is related to timing of individual draw calls. This may be a problem with synchronization, such as a missing barrier. It may also indicate a bug in the shader compiler.
Disable barrier optimizations
This experiment disables some optimizations made by the driver at the level of synchronization and barriers between draw calls. By default, the driver optimizes command execution as much as possible by inserting fine-grained barriers to ensure correctness and maximum performance at the same time. For example, a pixel shader may need to wait for the pixel shader of the previous draw call to finish, but the vertex shader of that draw call can start executing earlier. This experiment disables some of these optimizations, which may decrease performance. If activating this experiment fixes a bug, it may indicate a bug in synchronization, like a missing or incorrect barrier.
Disable acceleration structure optimizations
This experiment disables some of the optimizations made by the driver when building ray tracing acceleration structures, which may increase their size in memory and decrease the traversal performance in ray tracing. It should not change the logic.
If activating this experiment fixes a bug, it can indicate that the application incorrectly handles synchronization between ray tracing dispatches (e.g. a missing or incorrect barrier). It could also indicate that the application doesn’t correctly handle the increased size required for the acceleration structures or the scratch buffers needed to build them. It may also indicate a bug in the driver, although less likely.
Vertex shader wave size
Hull shader wave size (DirectX 12) / Tess control shader wave size (Vulkan)
Domain shader wave size (DirectX 12) / Tess eval shader wave size (Vulkan)
Geometry shader wave size
Pixel shader wave size (DirectX 12) / Fragment shader wave size (Vulkan)
Compute shader wave size
Mesh shader wave size
AMD RDNA architecture supports 32 or 64 threads per wave. During the compilation of every shader, the shader compiler will use a heuristic to determine whether to use 32 or 64 threads per wave, with the goal of reaching maximum performance. These experiments allow enforcing a specific mode of shader compilation for a specific shader stage (e.g. vertex or pixel shaders) whenever possible. Each per-stage experiment exposes two settings:
-
Force 32 threads per wave
-
Force 64 threads per wave
This should not change the logic, but it can impact performance.
If a shader uses explicit wave functions (called subgroup functions in Vulkan), like WaveReadLaneFirst, and toggling
this experiment fixes a bug, it can indicate the shader relies on a specific wave size to work correctly, which should
not be the case. It may also indicate a bug in the shader compiler, although less likely.
The experiment may also be used to compare the performance of a draw call executing the same shader with different wave
sizes. If profiling (e.g. using RGP) shows that the wave size selected by the driver is not optimal for a specific
shader, you can use [WaveSize()] attribute from Shader Model 6.6 to prepare an optimized version of the shader
with an explicit wave size to be used when possible.
Disable raytracing shader inlining
DXR shaders on AMD GPUs can be compiled in one of two modes. It can be observed in tools like RGP or RRA as:
-
<Indirect>: individual ray generation, closest hit, any hit, miss shaders etc. stay separate, get called and returned from.
-
<Unified>: all shaders participating in the ray tracing pipeline are inlined together, which may increase the time it takes to compile the pipeline state object but may improve the performance when executing this shader.
The decision is made by the shader compiler based on some heuristics with the goal of reaching maximum performance. It should not change the logic. This experiment forces the compiler to always choose the Indirect mode.
If activating this experiment shortens the time it takes for a game to launch and load while it creates Pipeline State Objects (PSOs), it indicates that the creation of ray tracing PSOs takes a significant amount of this time. For the fastest loading times, PSO creation should be done in multiple background threads.
If activating this experiment fixes a bug: a CPU crash or hang on PSO creation, GPU crash on shader execution, or incorrect results returned, it indicates a bug in the shader compiler.
Disable shader cache
Shader compilation happens in two stages.
- First, high level shader language (HLSL or GLSL) is compiled to an intermediate representation independent of the GPU and defined by the graphics API (DXIL in DirectX 12, SPIR-V in Vulkan). This should happen offline when the application is prepared to release to end users.
- The second stage happens in the graphics driver when a pipeline state object (PSO) is created. The intermediate representation is then compiled to the assembly (ISA) appropriate for the specific GPU. This typically happens at runtime (e.g. when a game is launched or loads a level) and can take significant time. To optimize this process, compiled shaders are cached by the driver.
This experiment disables the shader cache implemented by the driver. It should not change the logic, but it can impact the duration of PSO creation.
If activating this experiment makes the application launch and load much longer, it can indicate the creation of the application PSOs takes significant time that is optimized thanks to the cache, but new users would experience it the first time they launch the application. Activating this experiment will make PSO behave like it would on a system that has never run the application before. This can provide a more reliable measurement of the application startup time with a cold shader cache.
Safety features
Experiments in this group generally offer extra safety features that can decrease performance, but can make the application more correct and stable. Activating safety features can help expose errors in the code that could potentially cause instability in an application.
Submit command buffers separately
Submits each command buffer for execution on the GPU separately - disables chaining of multiple command buffers in a single submit call, so they don’t execute concurrently even when they are part of a single submission
Force NonUniformResourceIndex
Forces the shader compiler to treat all dynamic descriptor indexing as if it was decorated with NonUniformResourceIndex. This can be useful to aid in identifying bugs in shaders where NonUniformResourceIndex usage is missing while the index is non-uniform.
Upload heap in video memory
Enables automatic use of CPU-visible video memory preferred over system memory by resources created in the UPLOAD heap. This can be useful in identifying an opportunity to improve the performance of GPU data uploading by creating some buffers in the GPU_UPLOAD heap instead.
Disable color texture compression
GPUs utilize internal compression formats for textures. This should not be confused with general data compression file formats (like ZIP) or algorithms (like Deflate), or with explicit block-compressed texture pixel formats (like BC6, ASTC). Internal compression formats are lossless, opaque to developers and are used to improve performance. Internal compression formats typically increase, rather than decrease, texture sizes in memory because additional space is needed for metadata. Such compression is typically used on render-target and depth-stencil textures. A decision whether a texture should be compressed is made by the driver based on some heuristics with the goal of achieving maximum performance. It can be observed in RGP, on the Render/depth targets tab, DCC column.
Compressed textures may be more sensitive to incorrect data. Textures must be correctly initialized with either the
Clear, Copy or DiscardResource operation so that the compression metadata is valid. Not using these
operations causes undefined results, as textures can be created in a place where memory may contain garbage data,
e.g. created as placed in a larger memory heap where another resource existed before, or aliasing memory with some
other resource used in a disjoint period throughout each render frame. Overwriting the whole texture using a shader
as a render target or UAV doesn’t count as proper initialization. In such case, visual artifacts can remain,
or it can even lead to a GPU crash.
This experiment disables compression of textures other than depth-stencil, typically render targets. If activating this
experiment fixes a bug like a visual artifact visible on the screen, it can indicate incorrect initialization of the
texture – missing Clear, Copy, or a missing or incorrect barrier.
Disable depth-stencil texture compression
This experiment disables internal compression of depth-stencil textures. If activating it fixes a bug related to incorrect rendering, it can indicate that there is missing or incorrect initialization of a depth-stencil texture.
Zero unbound descriptors
This experiment initializes unbound descriptors with zeros. If enabling it fixes a bug, it can indicate that the application may be accessing an unbound descriptor table.
Thread-safe command buffer allocator
Command buffer allocator objects are not thread-safe and should only be accessed from one thread at a time. When an application uses parallel recording of command buffers or multiple threads, it typically uses a separate command allocator per thread.
This experiment makes command allocators thread-safe, synchronized internally. If activating it fixes a bug, it can indicate the bug is related to synchronization between threads that use command allocators and command buffers for rendering.
Force structured buffers as raw
A structured buffer defines a stride, which is the number of bytes needed for a single instance of the structure, or a step to take with a pointer to move to the next structure instance. This parameter is passed when creating a Shader Resource View (SRV) descriptor for a structured buffer, but the structure of specific size is also declared in the shader code for that structured buffer to be bound to the specific shader resource slot. These two should match. If they do not match, the result is undefined and may differ between different GPUs.
This experiment forces the GPU to use the stride from the shader instead of the descriptor. If activating it fixes a bug, it may indicate the bug is caused by incorrect declaration of the structured buffer in the application code or in the shader code. It could also indicate that a raw buffer is being accidentally used instead of a structured buffer.
Vertical synchronization
Vertical synchronization (V-sync) is a setting commonly offered by games to control the behavior of presenting frames on the screen.
When off, frames are presented as soon as they are ready (when rendering is finished). It typically increases the number of frames per second (FPS), makes the GPU busier, up to 100% (if the game is not bound by its CPU workload), but it can expose an unpleasant visual effect on the screen known as tearing. This mode is good for testing the system and the game under maximum load, and for performance measurements.
When on, new frames are presented only when the monitor is ready to present them. FPS is then limited to the refresh rate of the monitor (60 Hz on typical monitors), GPU load is lower, battery usage is lower, as the game is blocked and waits until a subsequent frame can be rendered and presented. This eliminates the tearing effect and so this mode is good for normal gaming.
V-sync is typically controlled by the application. This experiment allows to override it and force it to be on or off. This allows performing tests with various purposes on applications that don’t offer control over V-sync. For example, if forcing it on fixes a bug, it may indicate the bug is sensitive to the timing of draw calls and render passes, which may be caused by incorrect CPU-GPU synchronization of render frames, command buffer submission, present call, etc. If forcing V-sync on fixes a problem with the whole system crashing or shutting down, it may indicate a problem with GPU or CPU overheating.
Device Clocks
The Radeon Developer Panel (RDP) allows the developer to select from a number of clock modes.
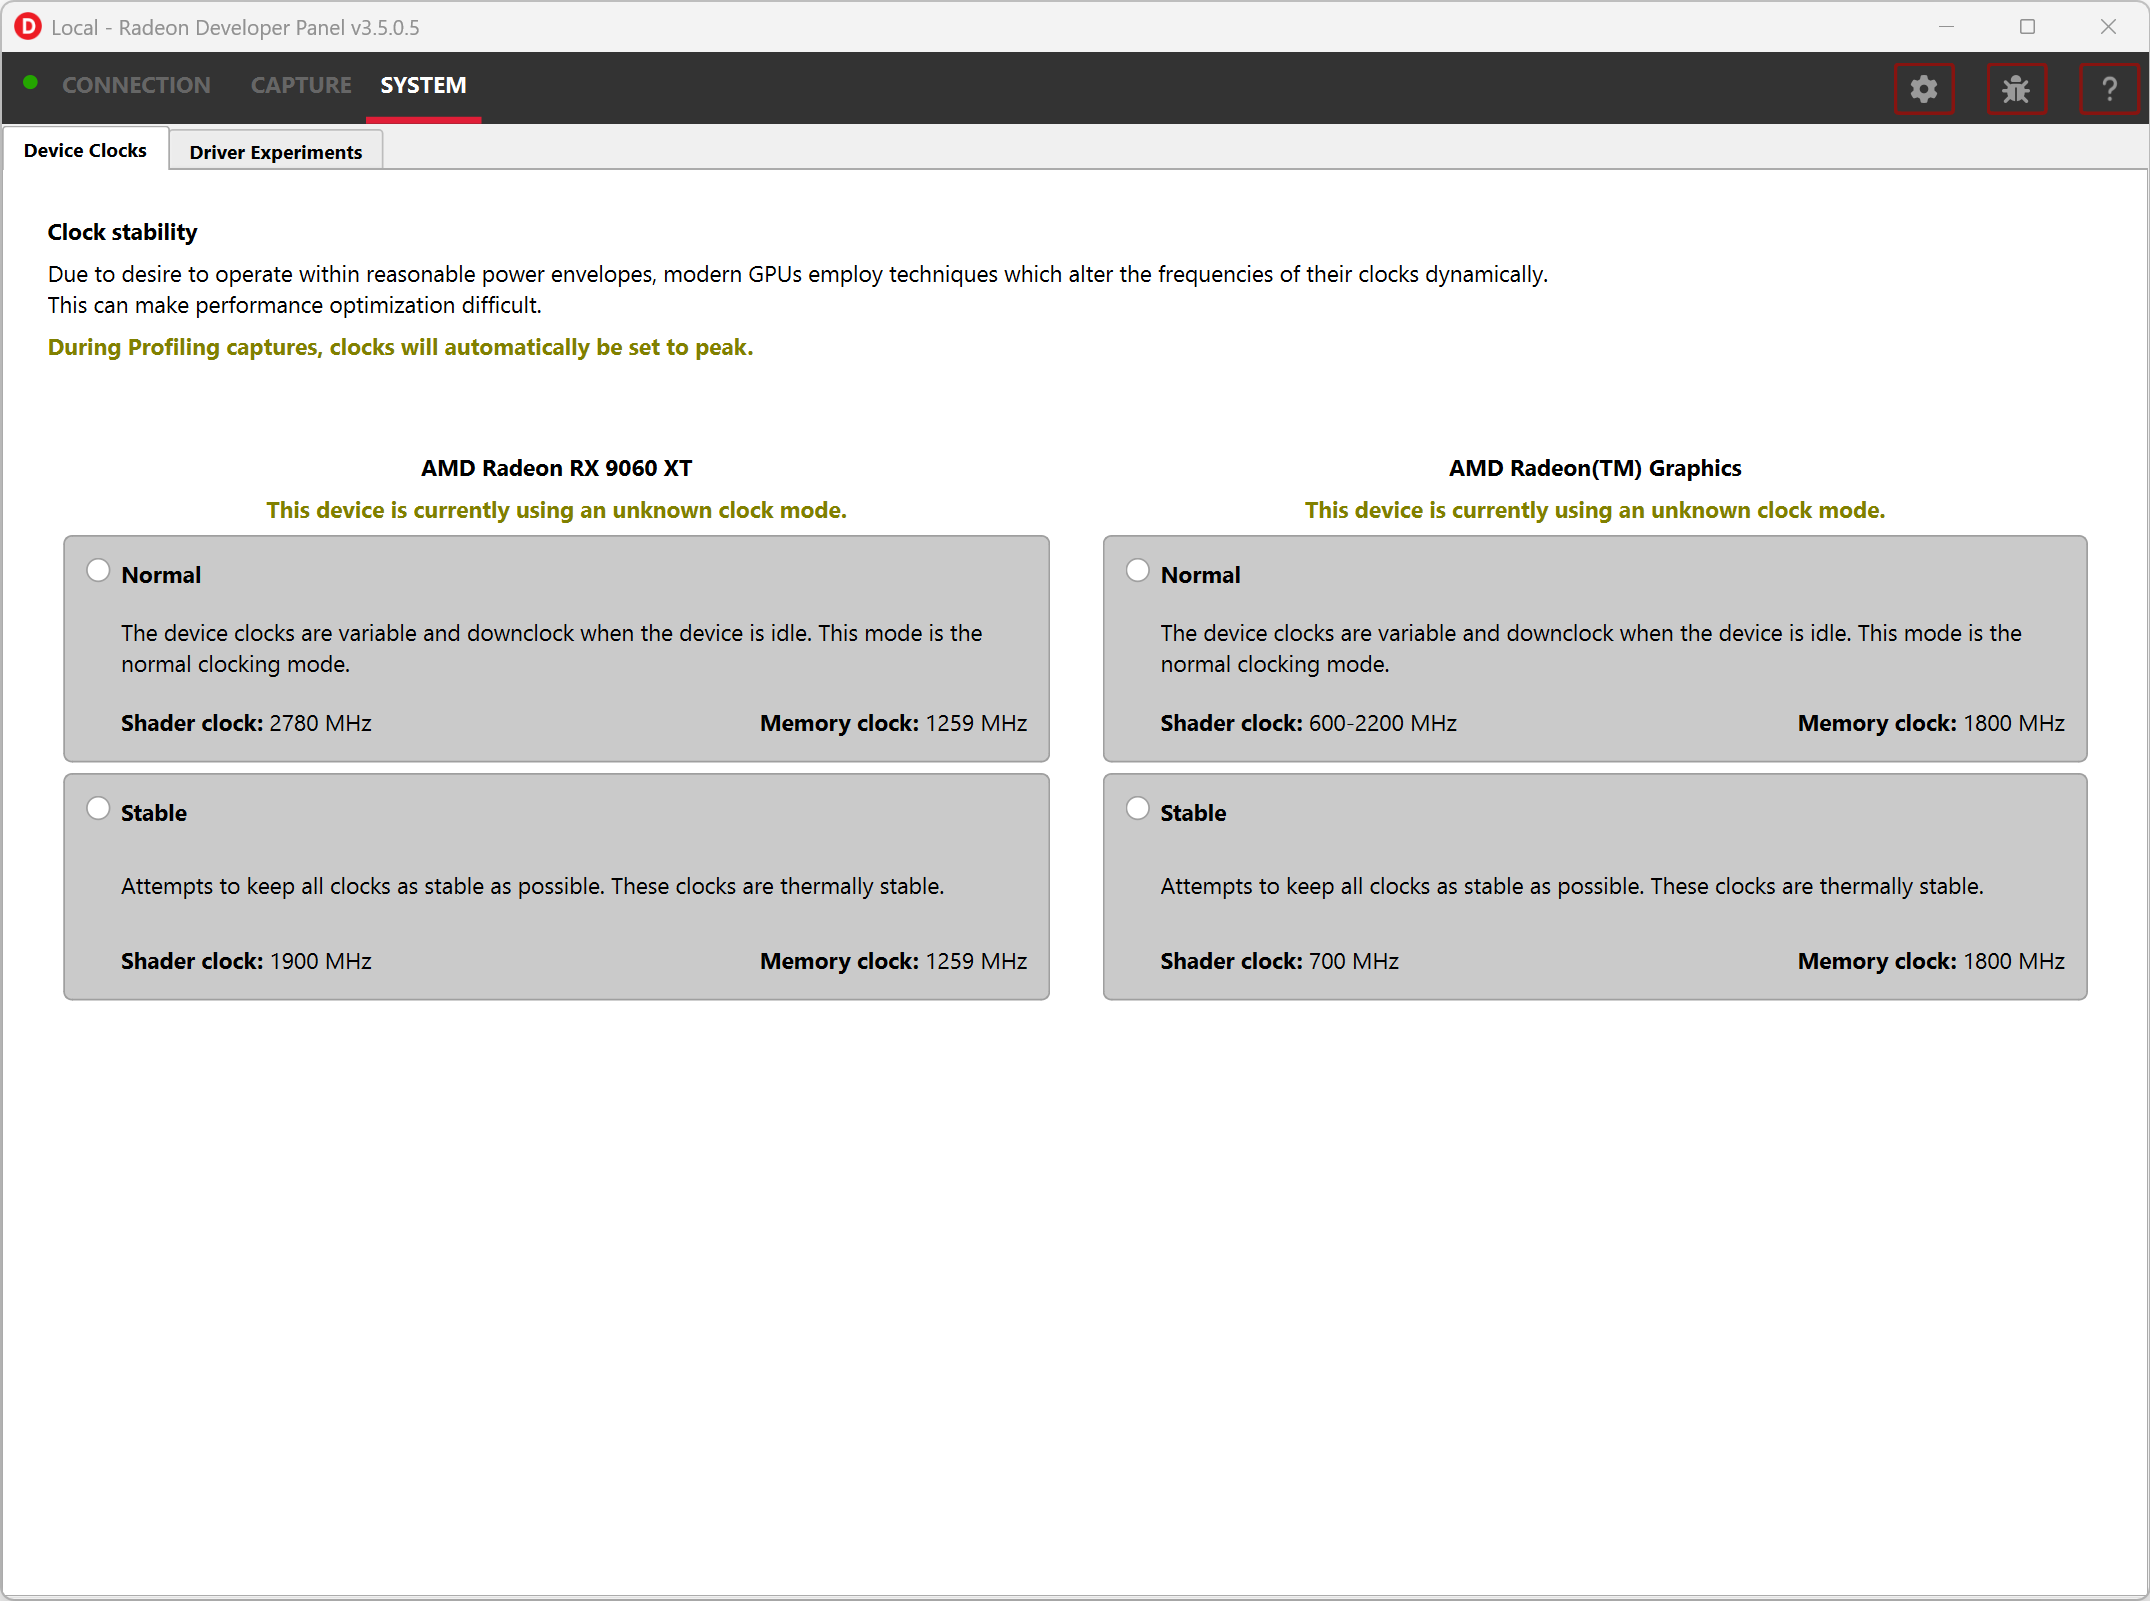
Normal clock mode will run the GPU as it would normally run your application. To ensure that the GPU runs within its designed power and temperature envelopes, it dynamically adjusts the internal clock frequency. This means that profiles taken of the same application may differ significantly, making side-by-side comparisons impossible.
Stable clock mode will run the GPU at a lower, fixed clock rate. Even though the application may run slower than normal, it will be much easier to compare profiles of the same application.