The OVERVIEW windows
These panes show the overview of the scene and the system.
Summary
The summary pane presents a high-level view of the acceleration structures in a scene. If dispatches was specified when taking a capture, the dispatches that shot rays will also be shown.
At the top, a small table will show the number of acceleration structures by type and if there are any acceleration structures that are empty or missing.
-
Total TLASes is the total number of top-level acceleration structures in the scene.
-
Total BLASes is the total number of bottom-level acceleration structures in the scene.
-
Empty BLASes is the number of BLASes which have no geometry data.
-
Missing BLASes is the number of instances which contain a reference to a BLAS that isn’t present in the scene file.
-
Inactive instances is the number of instances which either have a null handle in place of their BLAS reference or have an instance mask of 0x0. This does not exactly match the DirectX 12 and Vulkan specification definitions of inactive instances in which an instance mask of 0x0 is not considered inactive. The reason for this is that the driver internally converts inactive instances to have an instance mask of 0x0 so they are indistinguishable in the scene file.
The Total memory is the memory used for all the acceleration structures.
The TLAS list shows a list of all Top-level acceleration structures in the scene. It is split into several sections:
-
The left section shows a high level diagram of the TLAS, showing the number of instances and BLASes. Also shown is the memory used by the TLAS and the total memory used. The total here is the combined memory used by the TLAS and all the BLASes it references. TLASes can, and do, share BLASes so the totals for all the TLASes can sometimes be larger than the total memory displayed above.
-
The right section displays some useful statistics for each TLAS are shown so each can be easily identified.
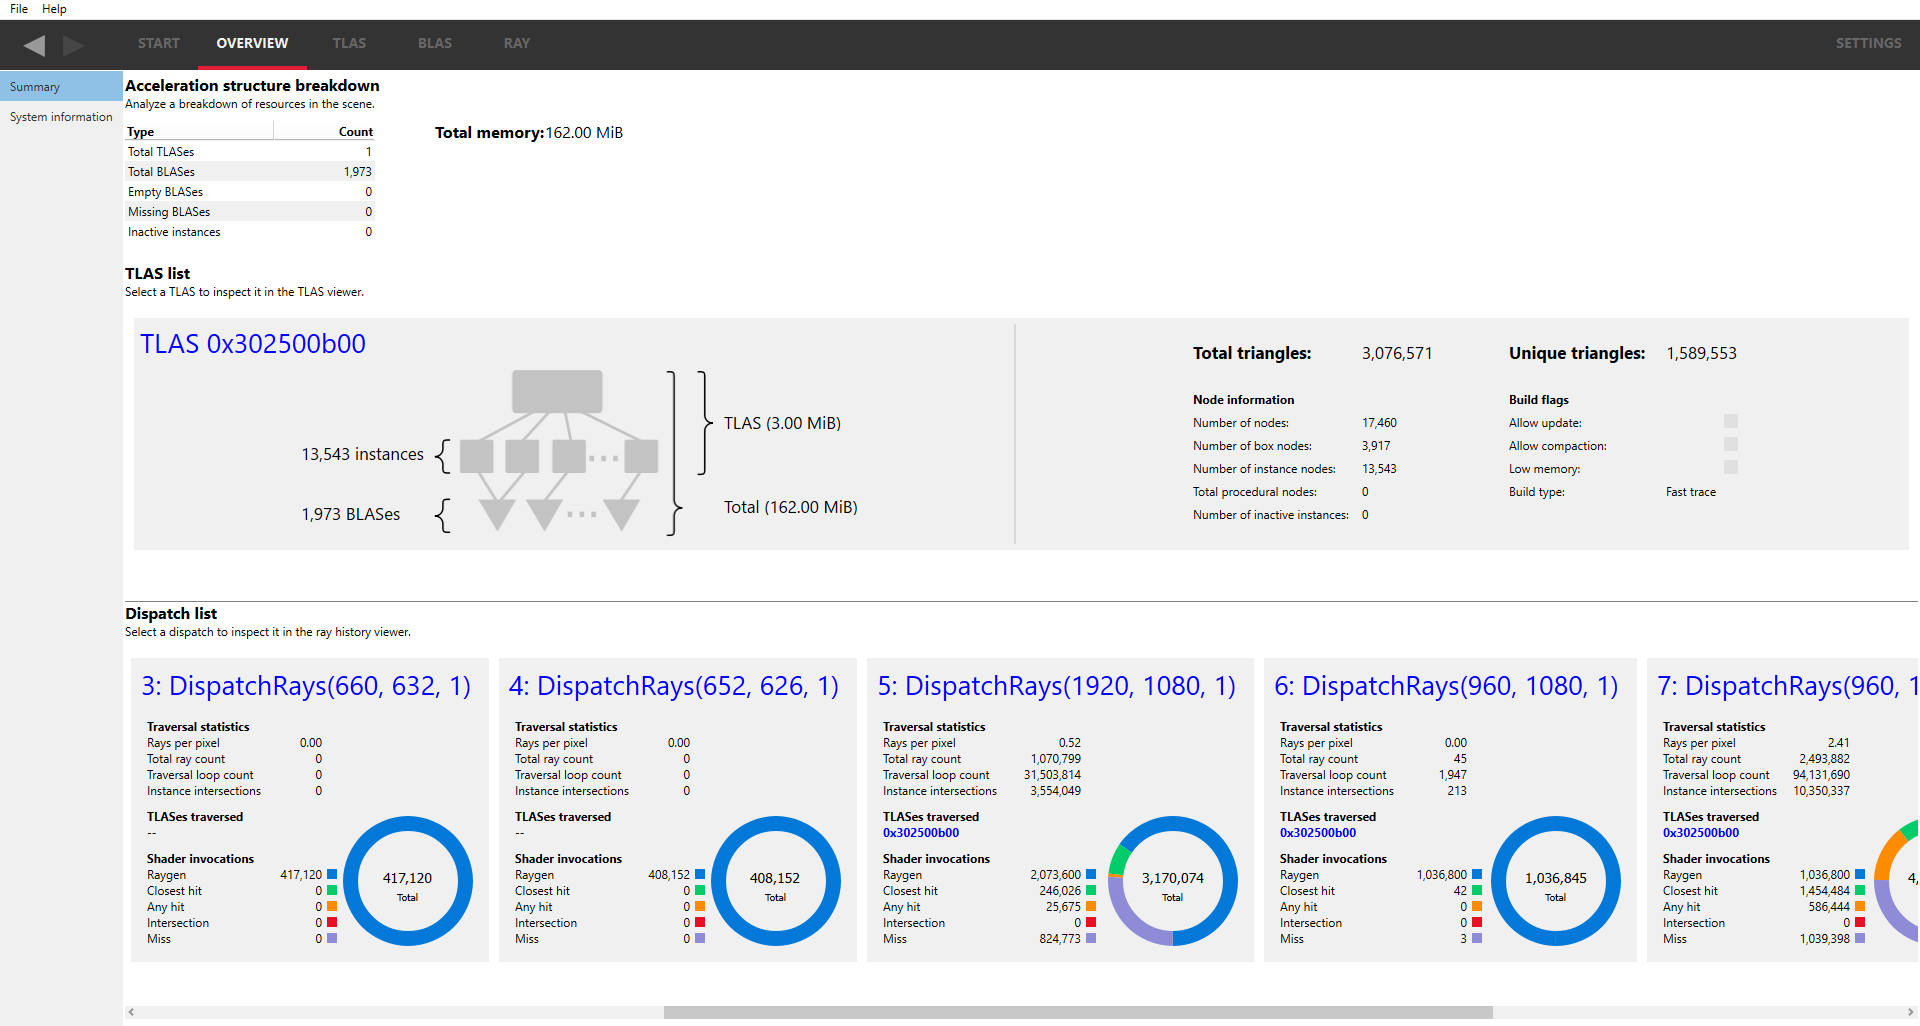
Clicking on the TLAS name or address (text in blue) will navigate to the TLAS Viewer pane.
If dispatches was enabled from the Radeon Developer Panel, the Dispatch list shows a list of all ray dispatches that were executed during the captured frame.
A splitter between the TLAS list and the Dispatch list, indicated by a horizontal line, allows the area of interest to be expanded. This can be useful on smaller displays or where more than one TLAS needs to be viewed.
Each dispatch is shown as a card. The title text shows the API function name that launched the dispatch and the dispatch dimensions. If the dispatch has been named (using vkCmdBeginDebugUtilsLabelEXT or equivalent in Vulkan, or agsDriverExtensionsDX12_PushMarker or equivalent in DirectX 12), the name will show below the API name.
The Traversal statistics show information pertaining to how much computation was done by this dispatch, such as the number of rays that were cast, the traversal loop counts and the number of instance intersections. The size of these values relative to the size of the dispatch may give the user an indication of the efficiency of a particular dispatch.
The TLASes traversed shows which TLASes were intersected by rays from this dispatch. Each intersected TLAS will be shown as an address. In the example here, just one TLAS was intersected. Clicking on an address will navigate to the TLAS Viewer pane and show the appropriate TLAS. If no TLASes were intersected, the list will be empty and represented by a “–“.
The Shader invocations shows the number of shaders that were executed and their type. This is also represented as a donut, showing the relative counts of the shader types.
Clicking on the Dispatch API function name (text in blue) will navigate to the RAY Dispatches pane.
Since RRA 1.7 it is possible to associate each dispatch with a user-defined string called a user marker. If a user marker has been associated with a dispatch, it will be shown below the dispatch API call as shown below:
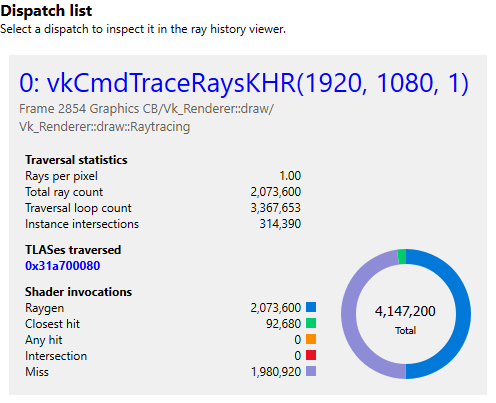
The Radeon GPU Profiler documentation provides a comprehensive description of adding user markers to your application.
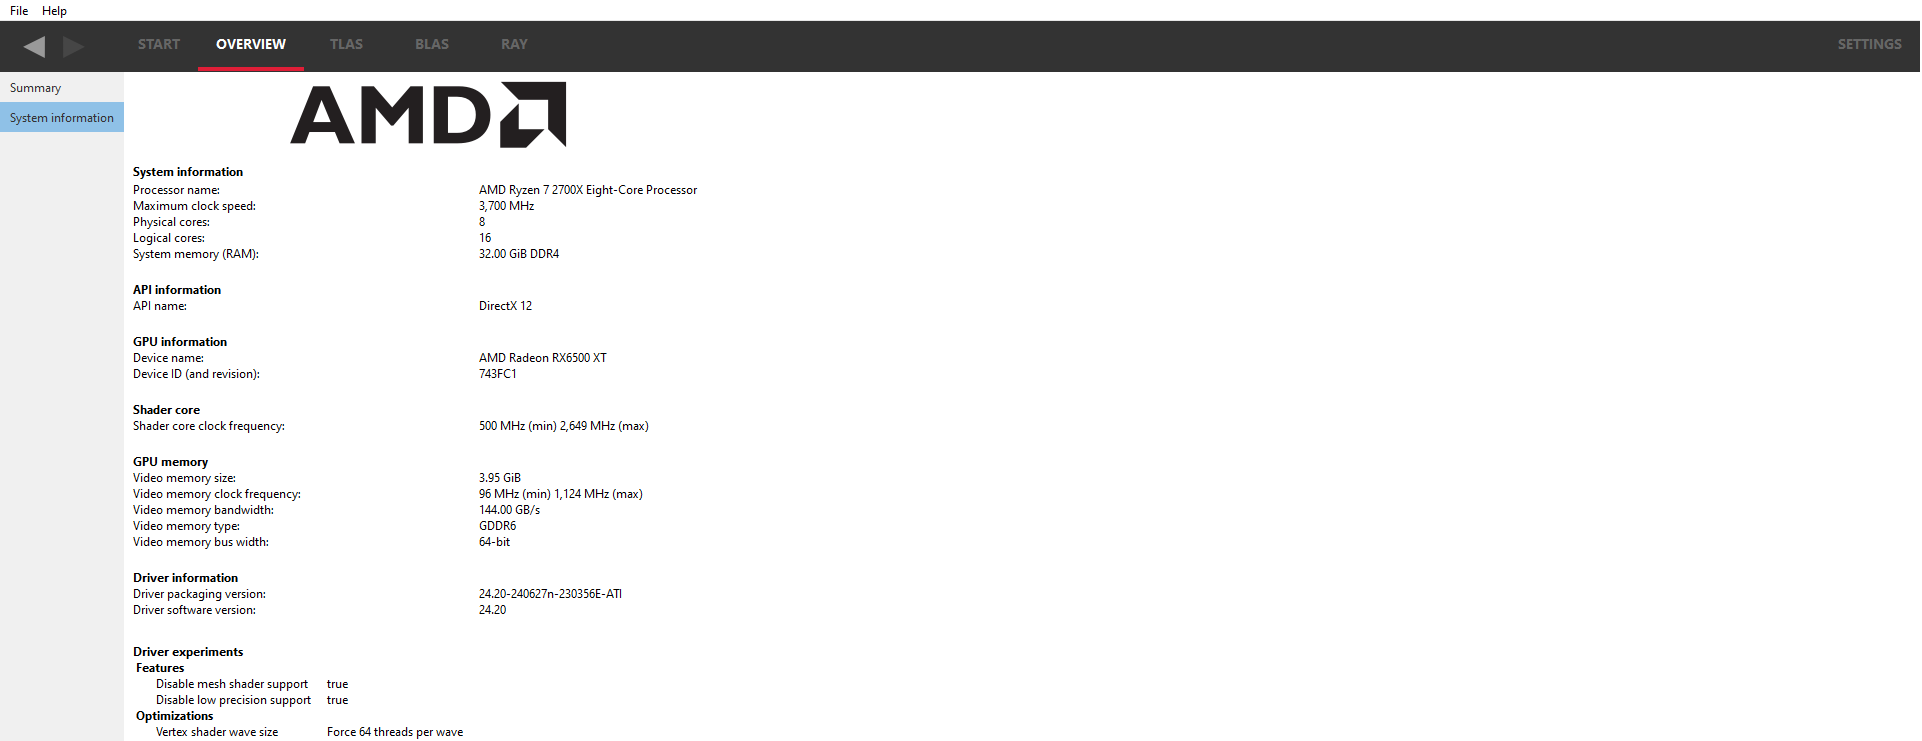
System information
This pane will show some of the parameters of the video hardware on which the scene was recorded, showing such things as the name of the video card and the memory bandwidth. In addition, if any Driver experiments are included when the scene was captured, they will be displayed here under the section labeled Driver experiments. Hovering over a driver experiment name or value with the mouse pointer displays a tooltip describing that item.
