AMD Radeon™ GPU Profiler
AMD RGP gives you unprecedented, in-depth access to a GPU. Easily analyze graphics, async compute usage, event timing, pipeline stalls, barriers, bottlenecks, and other performance...
Getting a code to be functionally correct is not always enough. In many industries, it is also required that applications and their complex software stack run as efficiently as possible to meet operational demands. This is particularly challenging as hardware continues to evolve over time, and as a result codes may require further tuning. In practice, many application developers construct benchmarks, which are carefully designed to measure the performance, such as execution time, of a particular code within an operational-like setting. In other words: a good benchmark should be representative of the real work that needs to be done. These benchmarks are useful in that they provide insight into the characteristics of the application, and enables one to discover potential bottlenecks that could result in performance degradation during operational settings.
At face value, benchmarking sounds simple enough and is often interpreted as simply a comparison of execution time on a variety of difference machines. However, in order to extract the most performance from emerging hardware, the program must be tuned many times and requires more than measuring raw execution time: one needs to know where the program is spending most of its time and whether further improvements can be made. Heterogenous systems, where programs run on both CPUs and GPUs, introduce additional complexities. Understanding the critical path and kernel execution is all the more important. Thus, performance tuning is a necessary component in the benchmarking process.
With AMD’s profiling tools, developers are able to gain important insight into how efficiently their application is utilizing hardware and effectively diagnose potential bottlenecks contributing to poor performance. Developers targeting AMD GPUs have multiple tools available depending on their specific profiling needs. This post serves as an introduction to the various profiling tools offered by AMD and why a developer might leverage one over the other. This post covers everything from low level profiling tools to extensive profiling suites.
In this introductory blog, we briefly describe the following tools that can aid in application analysis:
The following terms are used in this blog post:
Term | Description |
|---|---|
AMD’s x86-64 processor core architecture design. Used by the AMD EPYC™, AMD Ryzen™, AMD Ryzen™ PRO, and AMD Threadripper™ PRO processor series. | |
AMD’s Traditional GPU architecture optimized for graphically demanding workloads like gaming and visualization. Includes the RX 5000, 6000 and 7000 GPUs. | |
AMD’s Compute dedicated GPU architecture optimized for accelerating HPC, ML/AI, and data center type workloads. Includes the AMD Instinct™ MI50/60, MI100, and MI200 series accelerators. | |
A C++ Runtime API and kernel language that allows developers to create portable compute kernels/applications for AMD and NVIDIA GPUs from a single source code | |
A profiling approach where durations of compute kernels and data transfers between devices are collected and visualized | |
Hardware agnostic methodology for quantifying a workload’s ability to saturate the given compute architecture in terms of floating-point compute and memory bandwidth | |
Hardware Counters | Individual metrics which track how many times a certain event occurs in the hardware, such as bytes moved from L2 cache or a 32 bit floating point add performed |
The first step in profiling is determining the right tool for the job. Whether one wants to collect traces on the CPU, GPU, or both, understand kernel behavior, or assess memory access patterns, performing such an analysis might appear daunting for new users of AMD hardware. We begin by identifying the architecture and operating systems supported by each of the profiling tools provided by AMD. Almost all the tools in Table 1 support Linux® distros and with the gaining popularity of Instinct™ GPUs, every tool has some capability to profile codes running on CDNA™ architecture. However, those who prefer Windows will be limited to using AMD uProf to profile CPU and GPU codes targeting AMD “Zen”-based processors and AMD Instinct™ GPUs, and Radeon™ GPU Profiler that can provide great insights to optimize applications’ use of the graphics pipeline (rasterization, shaders, etc.) on RDNA™-based GPUs.
AMD Profiling Tools | AMD “Zen” Core | RDNA™ | CDNA™ | Windows | Linux® |
|---|---|---|---|---|---|
ROC-profiler | Not supported | ☆ | ★ | Not supported | ★ |
Omniperf | Not supported | Not supported | ★ | Not supported | ★ |
Omnitrace | ★ | ☆ | ★ | Not supported | ★ |
Radeon™ GPU Profiler | Not supported | ★ | ☆ | ★ | ☆ |
AMD | ★ | Not supported | ☆ | ★ | ☆ |
★ Full support | ☆ Partial support
Table 1: Profiler/architecture support and operating system needs.
The final choice of the tool on any platform depends on the profiling objective and the kind of analysis required. To make it simpler, we encourage the users to think of their objectives in terms of three questions as depicted in the flow diagram in Figure 1:
Where should I focus my time? : Whether benchmarking a new application, or getting started with a new software package that has not yet been profiled, it is recommended to first identify hotspots in the application that may benefit from quick optimization. In such a scenario, it is best if users start by collecting timelines and traces of their application. On Linux® platforms, Omnitrace enables the collection of CPU and GPU traces, and call stack samples to help identify major hotspots. However, on Windows, one may have to choose between AMD uProf and Radeon™ GPU Profiler depending on the targeted architecture.
How well am I using the hardware?: The first step is to obtain a characterization of workloads that can provide a glimpse into how well the hardware is being utilized. For example, identifying what parts of your application are memory or compute bound. This can be accomplished through roofline profiling. Typically, hotspots are well understood and interest is usually in identifying the performance of a few key kernels or subroutines. At present, roofline profiling is only available through Omniperf on AMD Instinct™ GPUs and AMD uProf on AMD “Zen”-based processors.
Why am I seeing this performance?: Once hotspots are identified and the initial assessment of performance on a particular hardware is completed, the next phase likely involves profiling and collecting the hardware metrics to understand where the observed performance is coming from. On AMD GPUs, tools such as Omnitrace, Omniperf and AMD uProf interface with the low-level ROC-profiler API and/or uses rocprof under-the-hood to gather GPU metrics. We do not recommend using rocprof directly because of the extra overhead in dealing with text/CSV files and hardware-specific metrics unless there is a specific need. On Windows systems, one will have to rely on using either AMD uProf or Radeon™ GPU Profiler.
Quick Tip: The Omni* suite of tools (Omniperf and Omnitrace), available on Linux® platforms, provide an easy-to-use interface for studying performance of the code across AMD hardware and should be treated as “go-to” profiling tools for performance tuning and benchmarking.
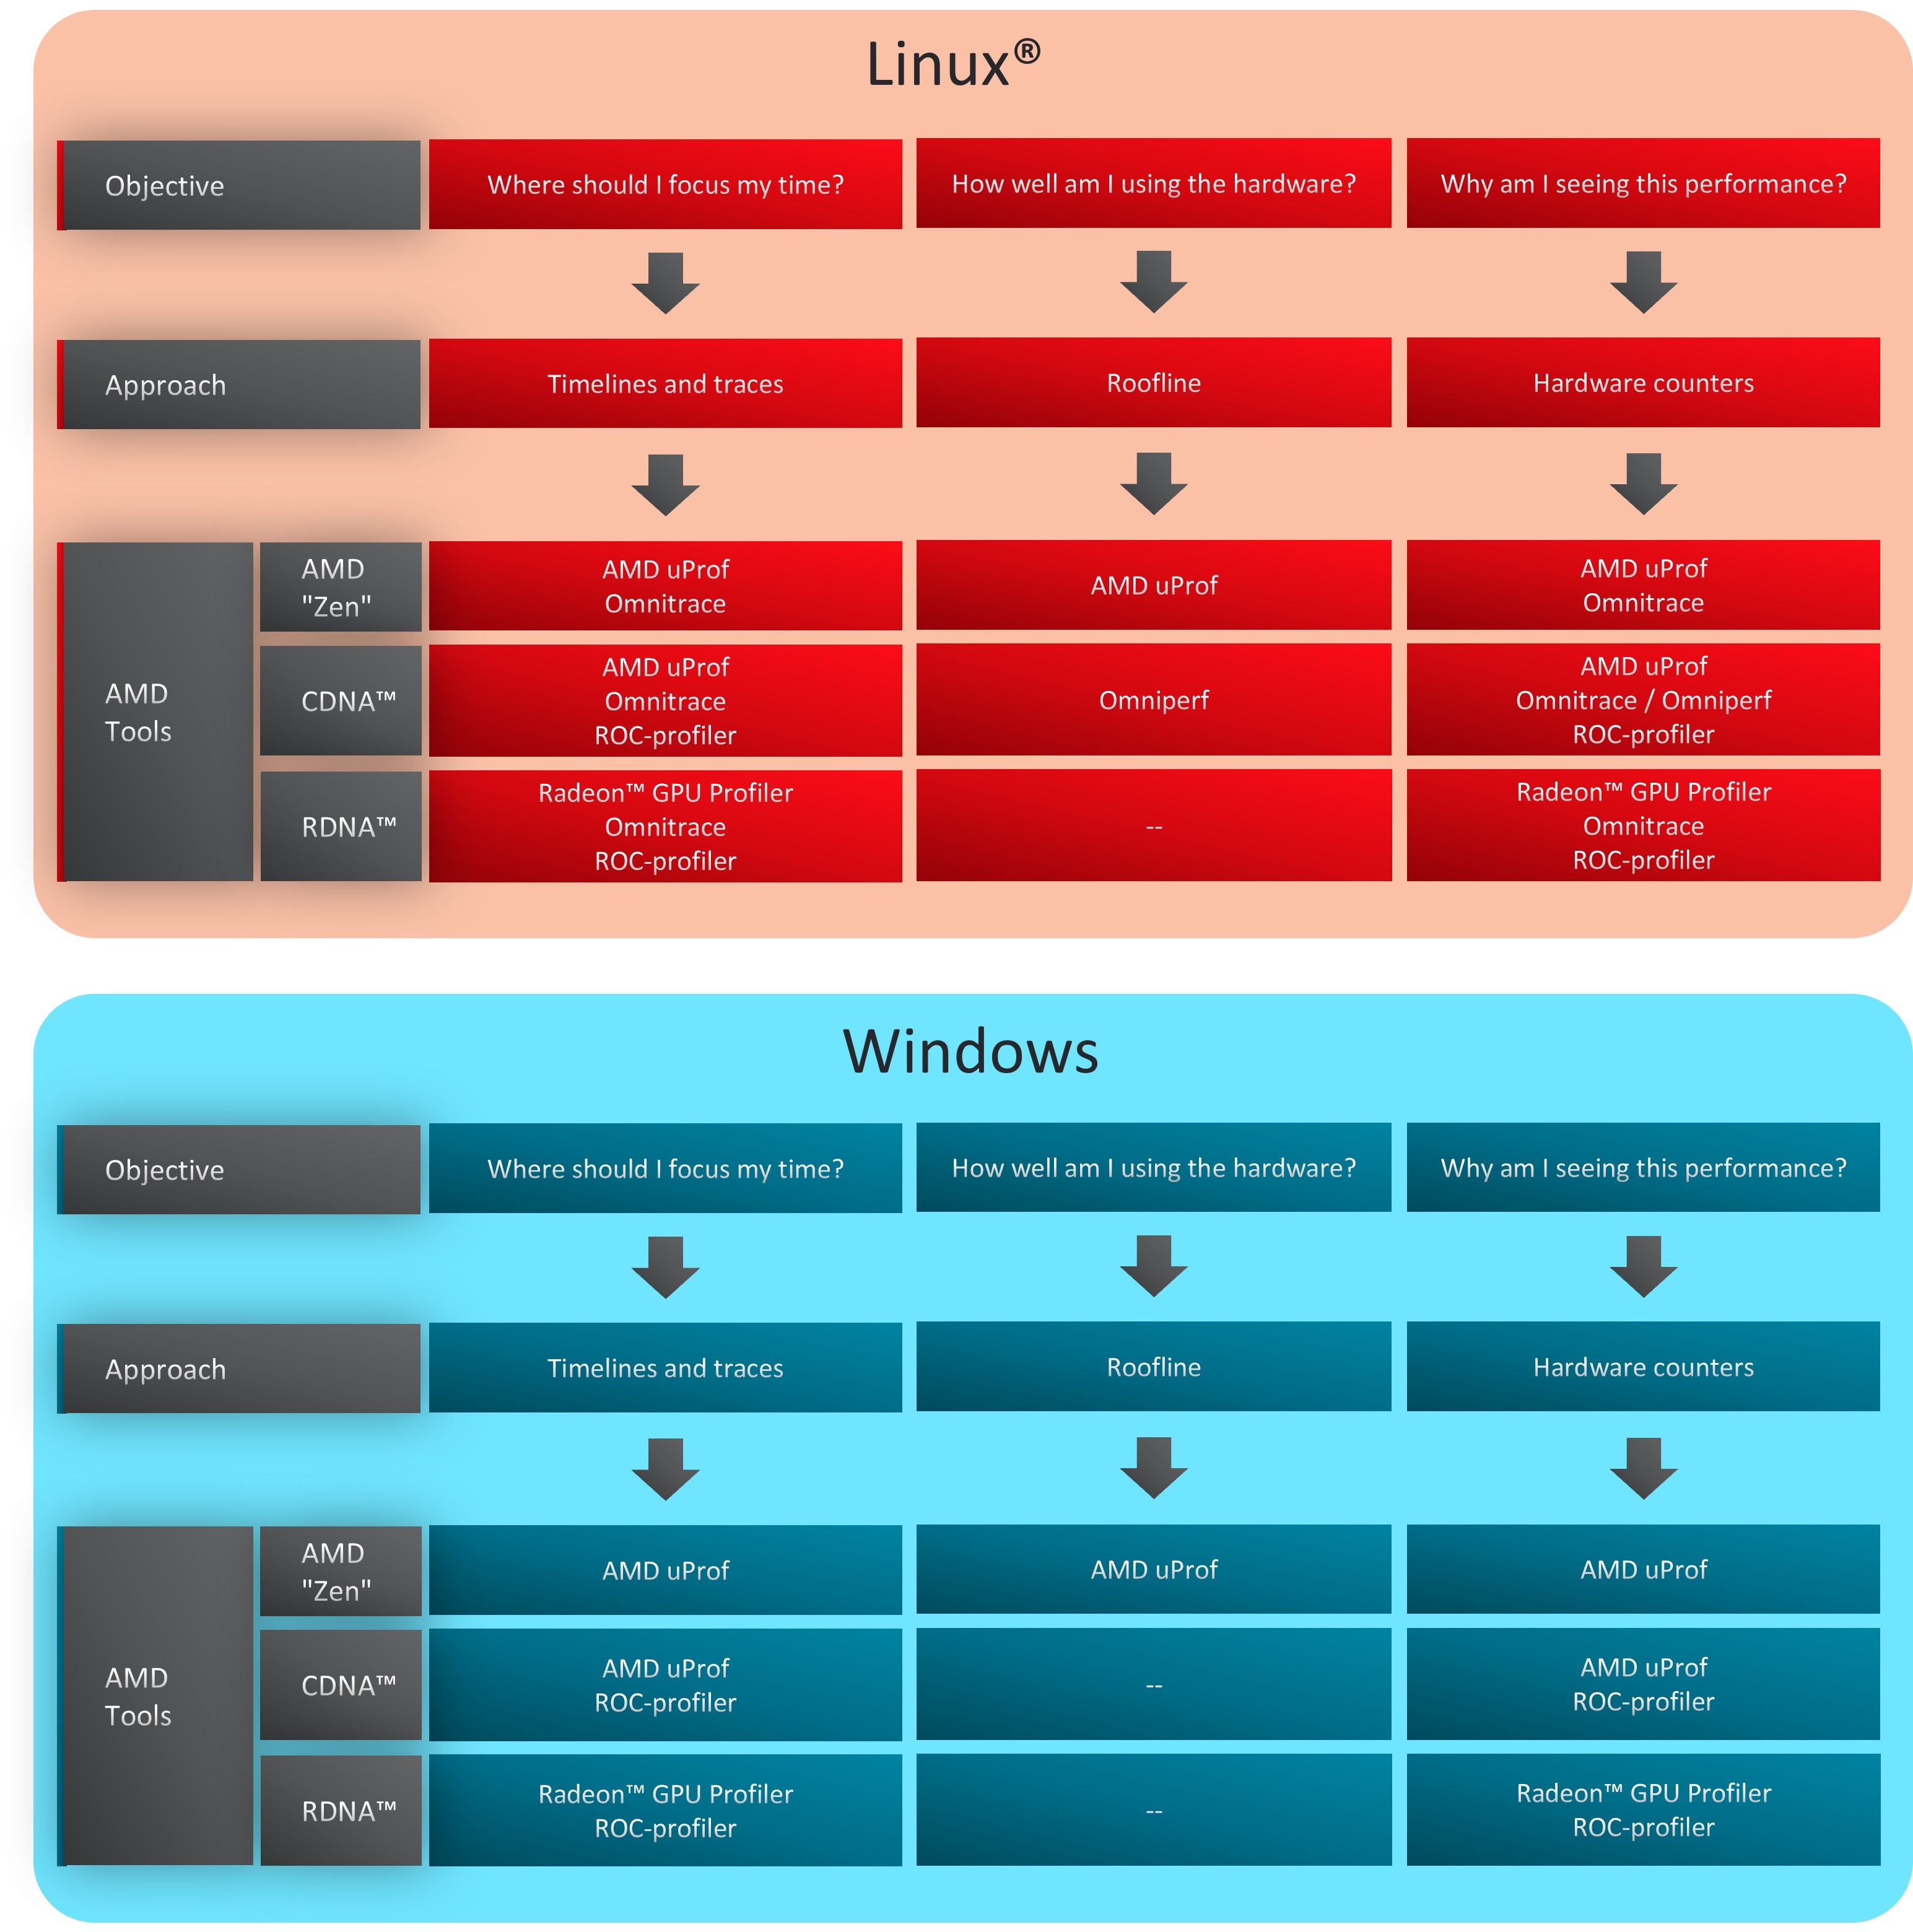
Figure 1: Use cases for a variety of AMD profiling tools.
In this section, we provide a brief overview of the above-mentioned AMD tools and some third-party toolkits.
Omnitrace is a comprehensive profiling and tracing tool for parallel applications, including HPC and ML packages, written in C, C++, Fortran, HIP, OpenCL™, and Python™ which execute on the CPU or CPU+GPU. It is capable of gathering the performance information of functions through any combination of binary instrumentation, call-stack sampling, user-defined regions, and Python™ interpreter hooks. Omnitrace supports interactive visualization of comprehensive traces in the web browser in addition to high-level summary profiles with mean/min/max/stddev statistics. Beyond runtime information, Omnitrace supports the collection of system-level metrics such as CPU frequency, GPU temperature, and GPU utilization. Process and thread level metrics such as memory usage, page faults, context switches, and numerous other hardware counters are also included.
When analyzing the performance of an application, it is always best to NOT assume you know where the performance bottlenecks are and why they are happening. Omnitrace is the ideal tool for characterizing where optimization would have the greatest impact on the end-to-end execution of the application and/or viewing what else is happening on the system during a performance bottleneck.
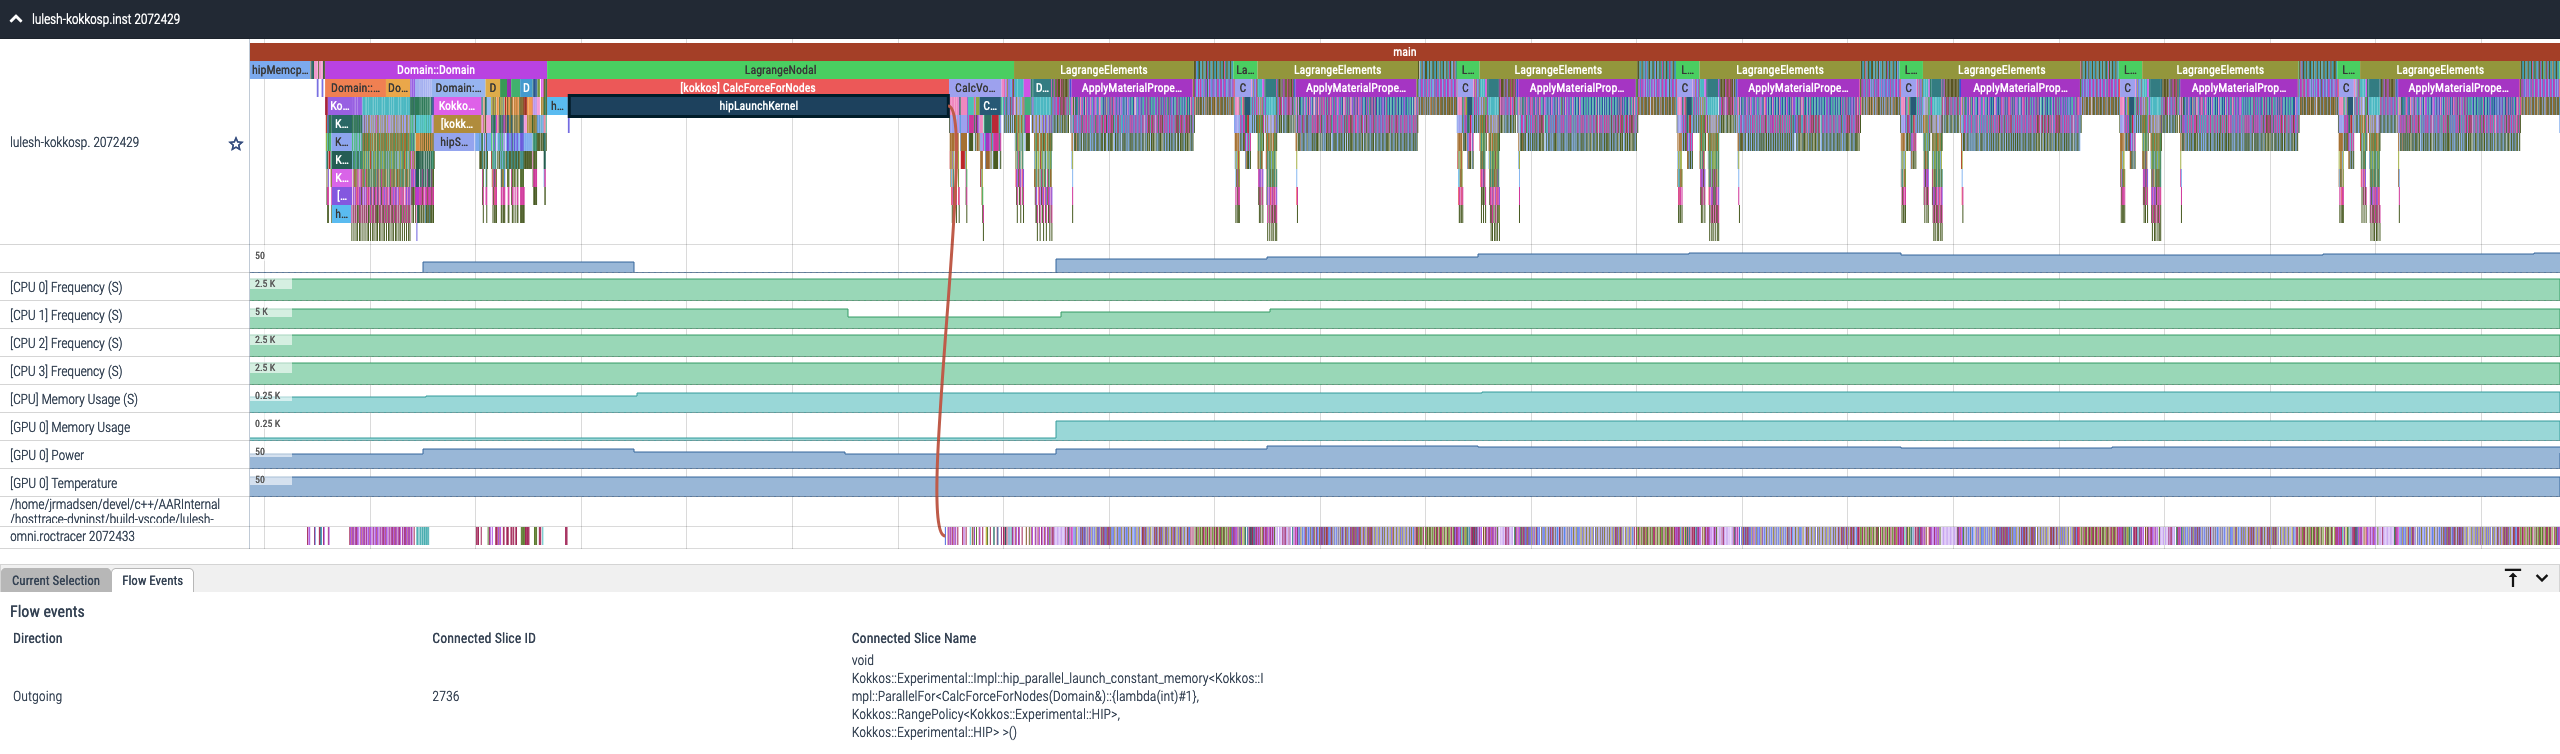
Figure 2: Omnitrace timeline trace example.
Please see the official Omnitrace documentation for the latest information. Users are encouraged to submit issues, feature requests, and provide any additional feedback.
Omniperf is a system performance profiler for High-Performance Computing (HPC) and Machine-Learning (ML) workloads using AMD Instinct™ GPUs. Omniperf utilizes AMD ROC-profiler to collect hardware performance counters. The Omniperf tool performs system profiling based on all approved hardware counters for AMD Instinct™ MI200 and MI100 architectures. It provides high level performance analysis features including System Speed-of-Light, IP block Speed-of-Light, Memory Chart Analysis, Roofline Analysis, Baseline Comparisons, and more.
Omniperf takes the guess work out of profiling by removing the need to provide text input files with lists of counters to collect and analyze raw CSV output files as is the case with ROC-profiler. Instead, Omniperf automates the collection of all available hardware counters in one command and provides a graphical interface to help users understand and analyze bottlenecks and stressors for their computational workloads on AMD Instinct™ GPUs. Note that Omniperf collects hardware counters in multiple passes, and will therefore re-run the application during each pass to collect different sets of metrics.
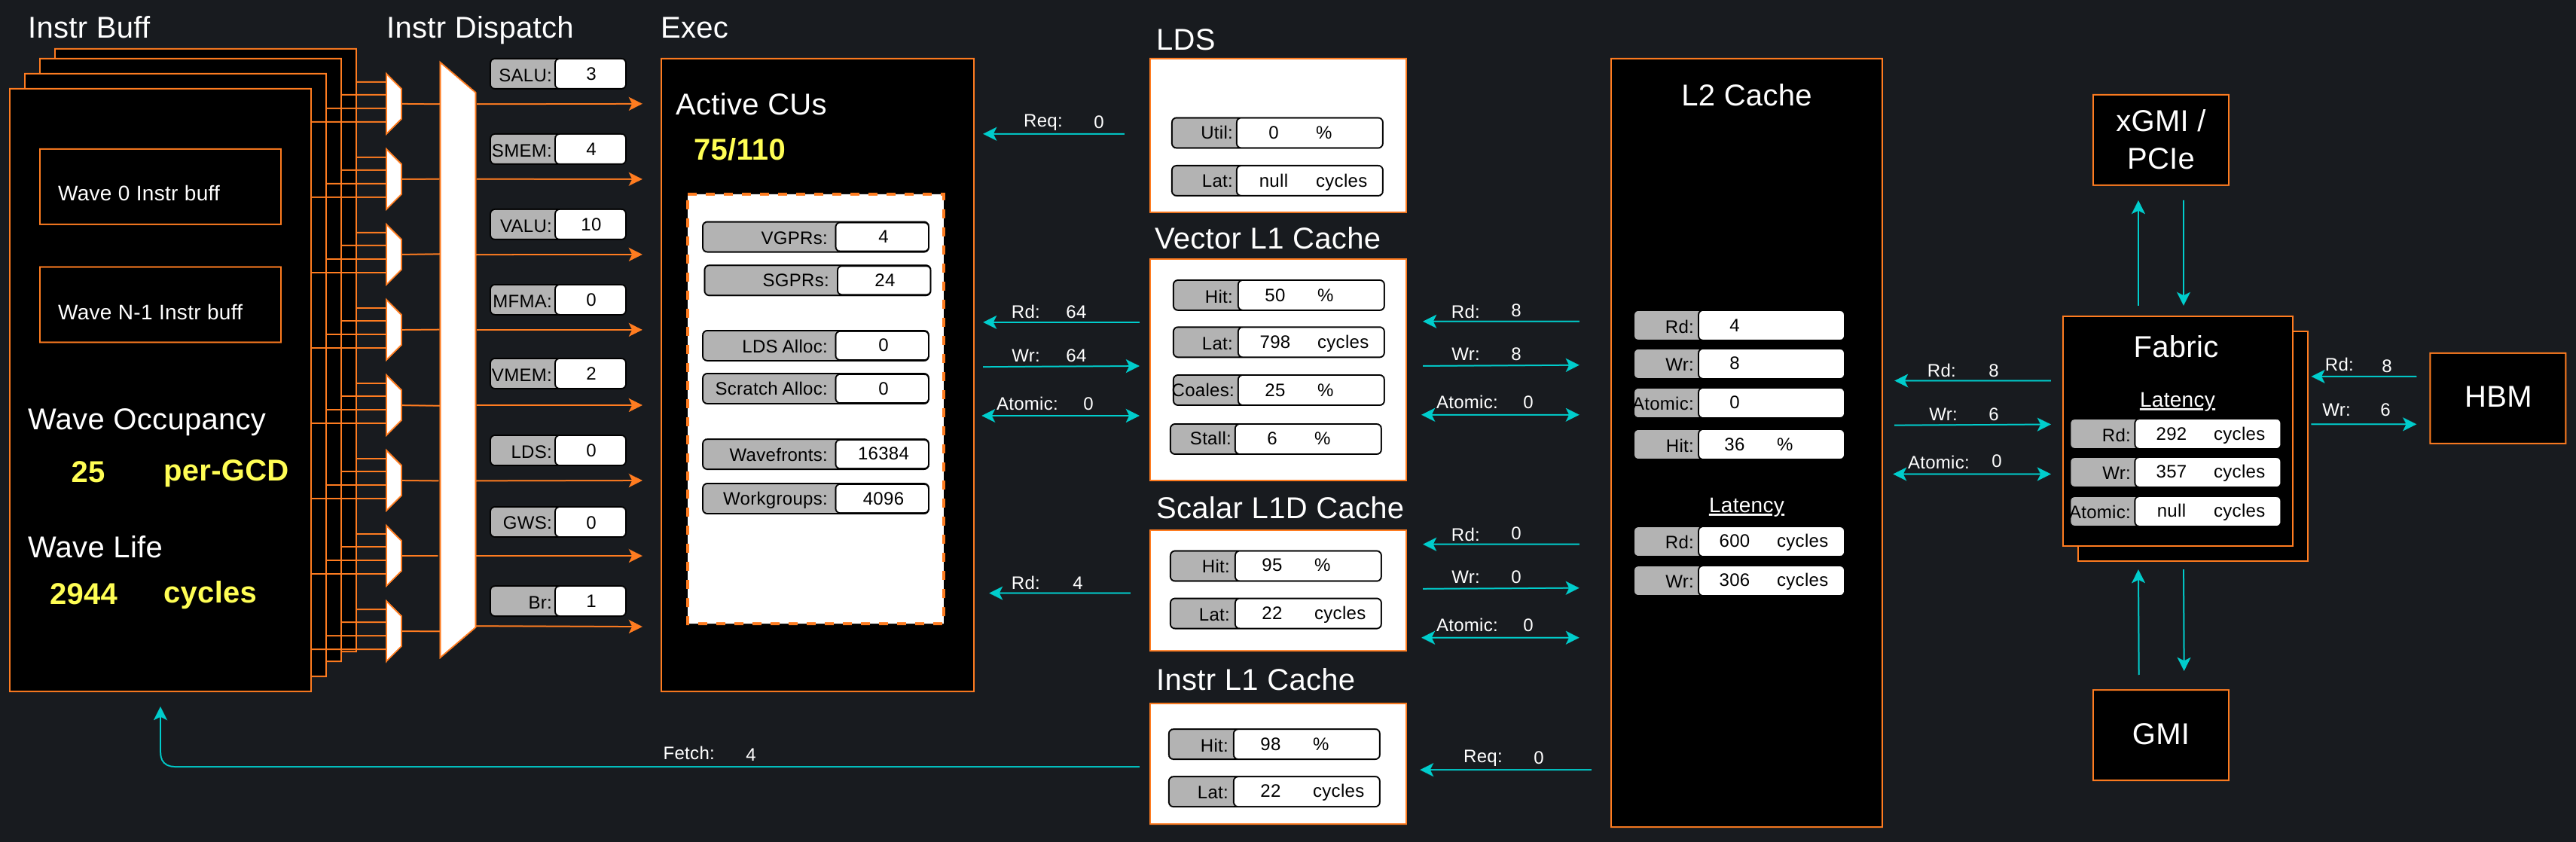
Figure 3: Omniperf memory chart analysis panel.
In a nutshell, Omniperf provides details about hardware activity for a particular GPU kernel. It also supports both a web-based GUI or command-line analyzer, depending on the user’s preference. For up-to-date information on available Omniperf features, we highly encourage readers to view the official Omniperf documentation. Users are encouraged to submit issues, feature requests and we welcome contributions and feedback from the community.
The ROC-profiler primarily serves as the low level API for accessing and extracting GPU hardware performance metrics, also typically called performance counters. These counters quantify the performance of the underlying architecture showcasing which pieces of the computational pipeline and memory hierarchy are being utilized. A script/executable command called rocprof is packaged with the ROCm™ installation and provides the functionality for listing all available hardware counters for your specific GPU as well as running applications and collecting counters during the execution.
The rocprof utility also depends on the ROC-tracer and ROC-TX libraries, giving it the ability to collect timeline traces of the GPU software stack as well as user anotated code regions. Note that rocprof is a command-line only utility so input and output takes the format of txt and CSV files. These formats provide a raw view of the data and puts the onus on the user to parse and analyze. Therefore, rocprof gives the user full access and control of raw performance profiling data, but requires extra effort to analyze the collected data.
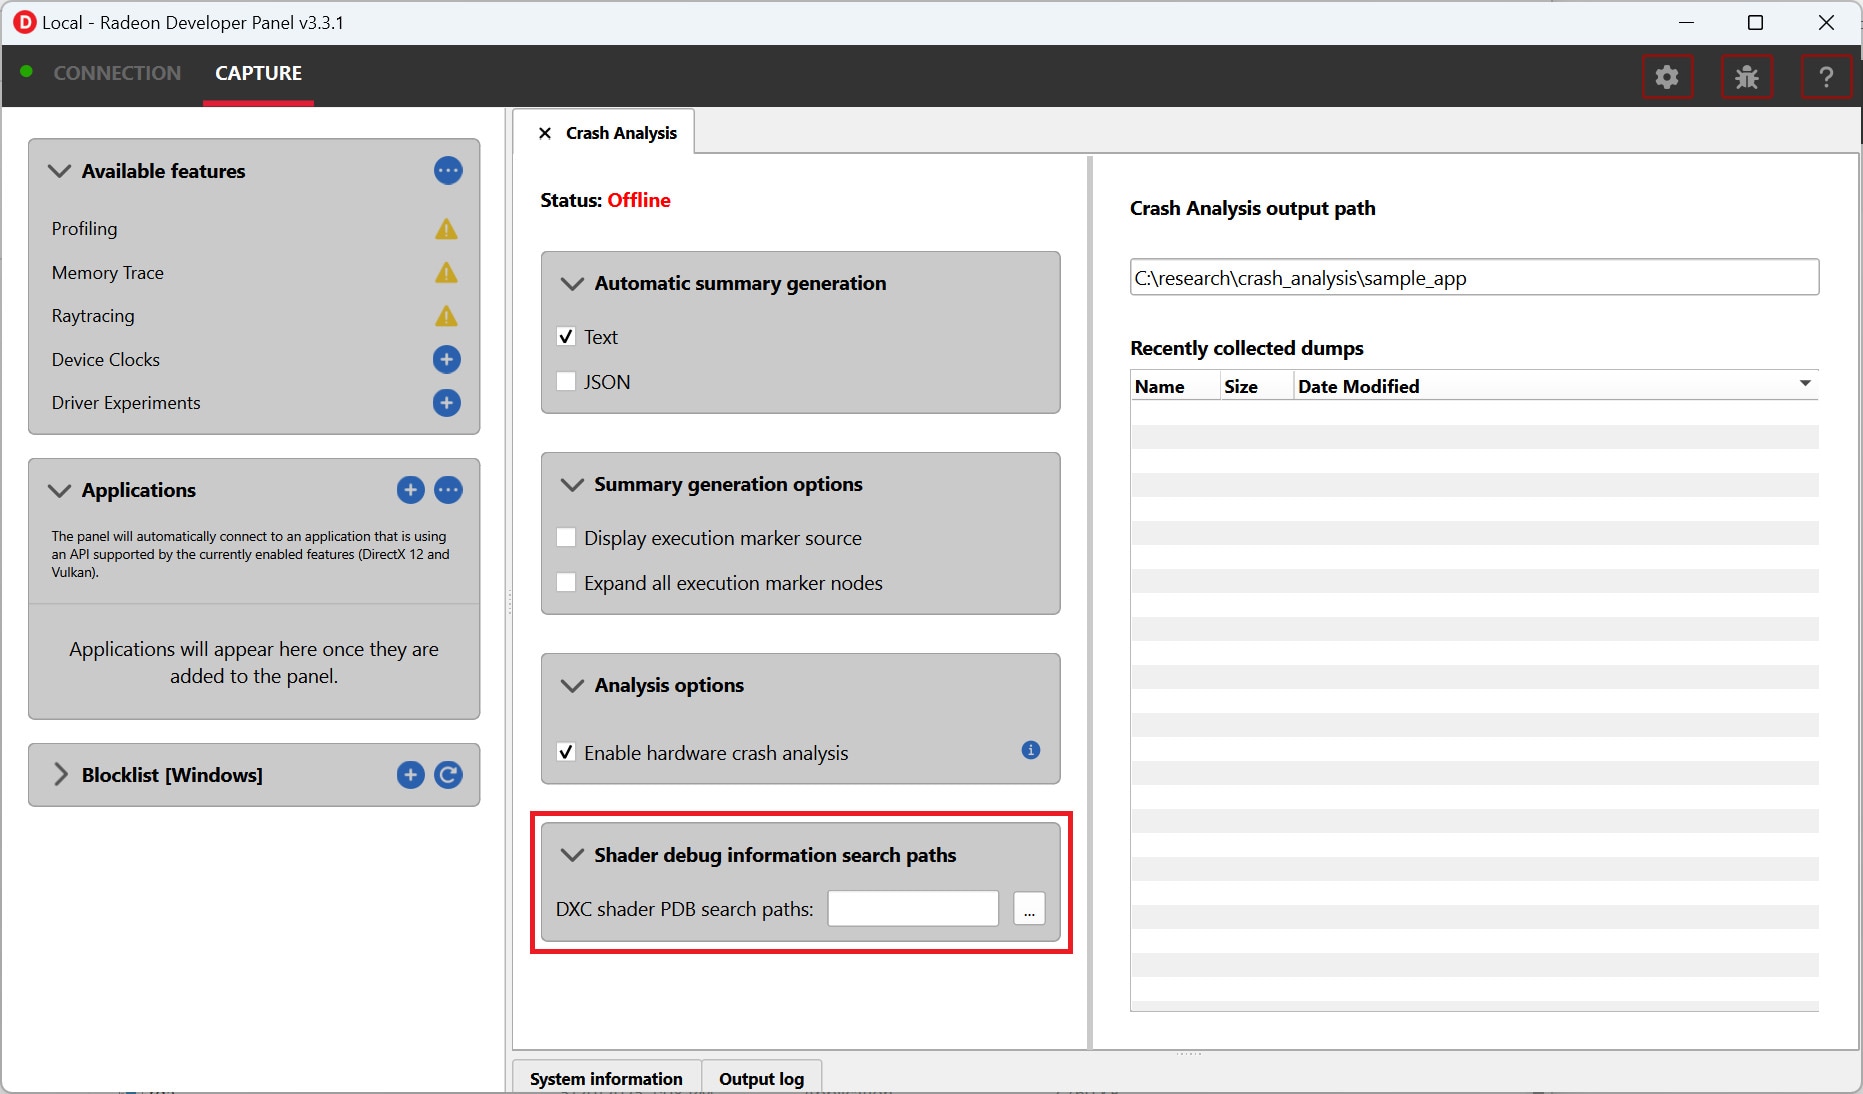
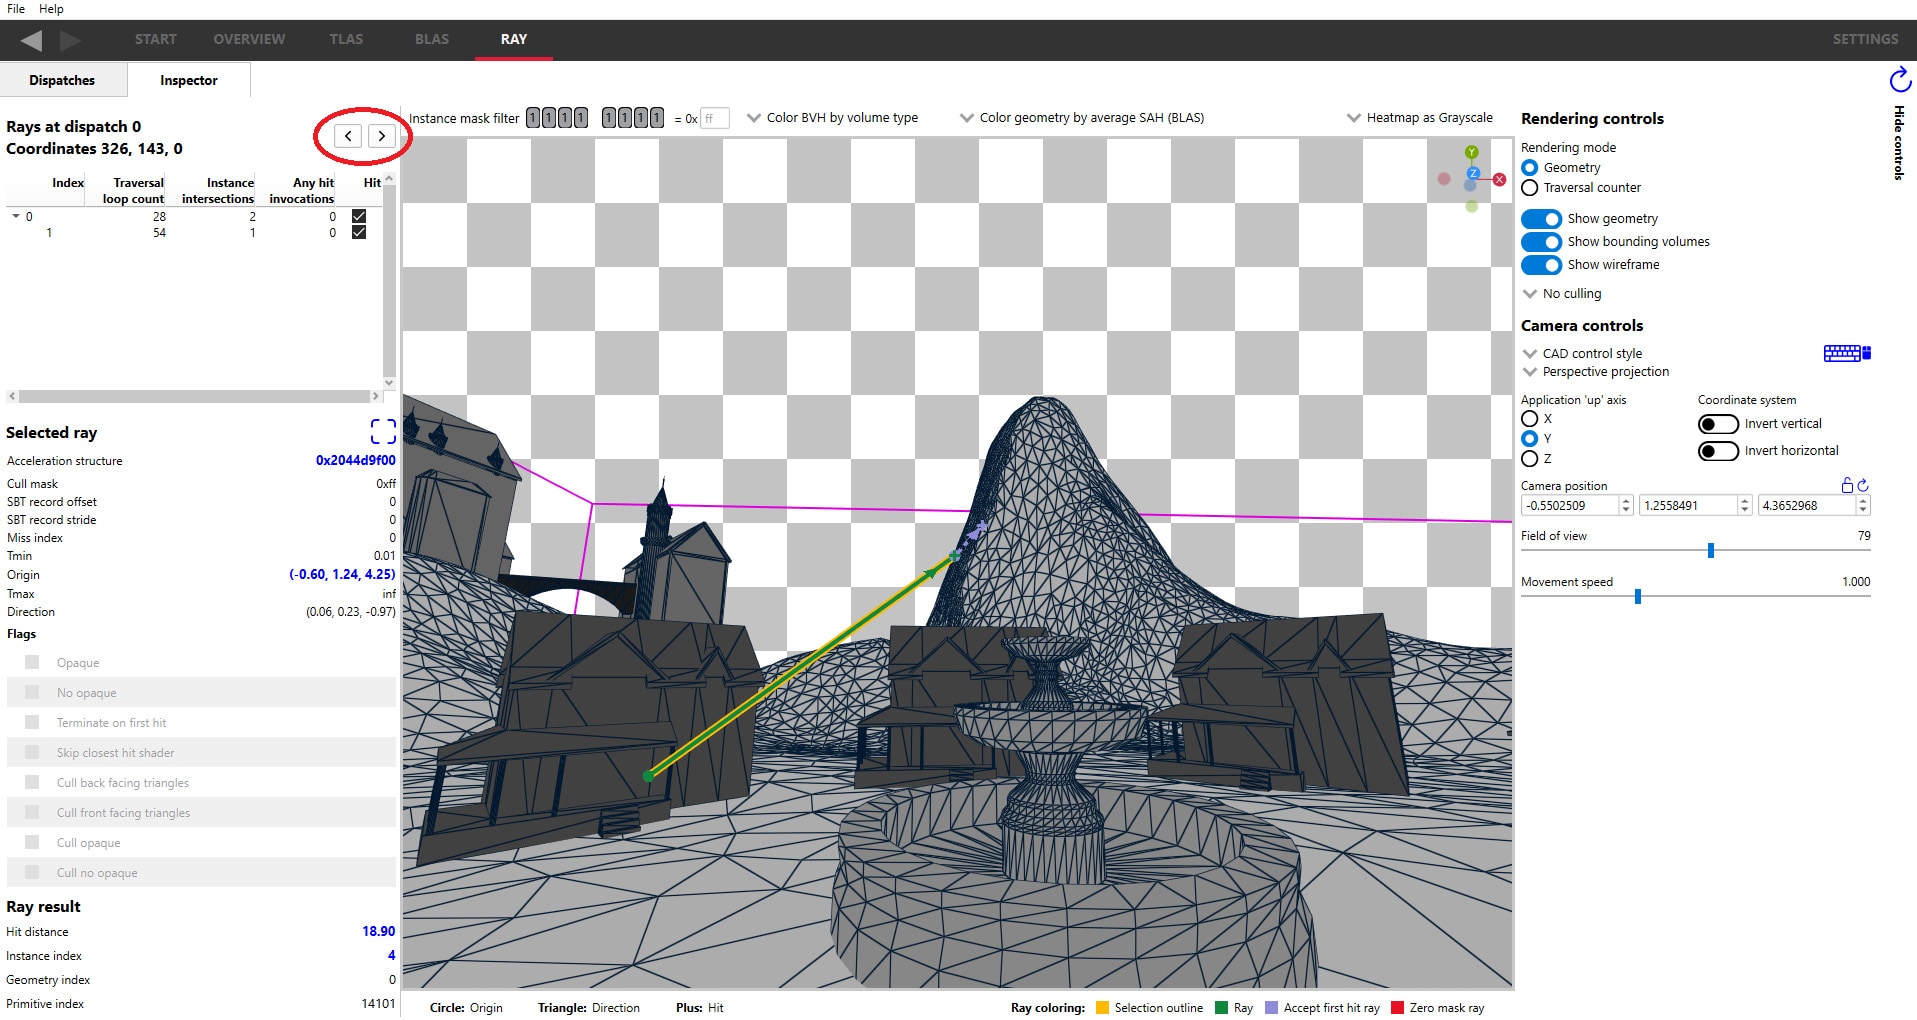
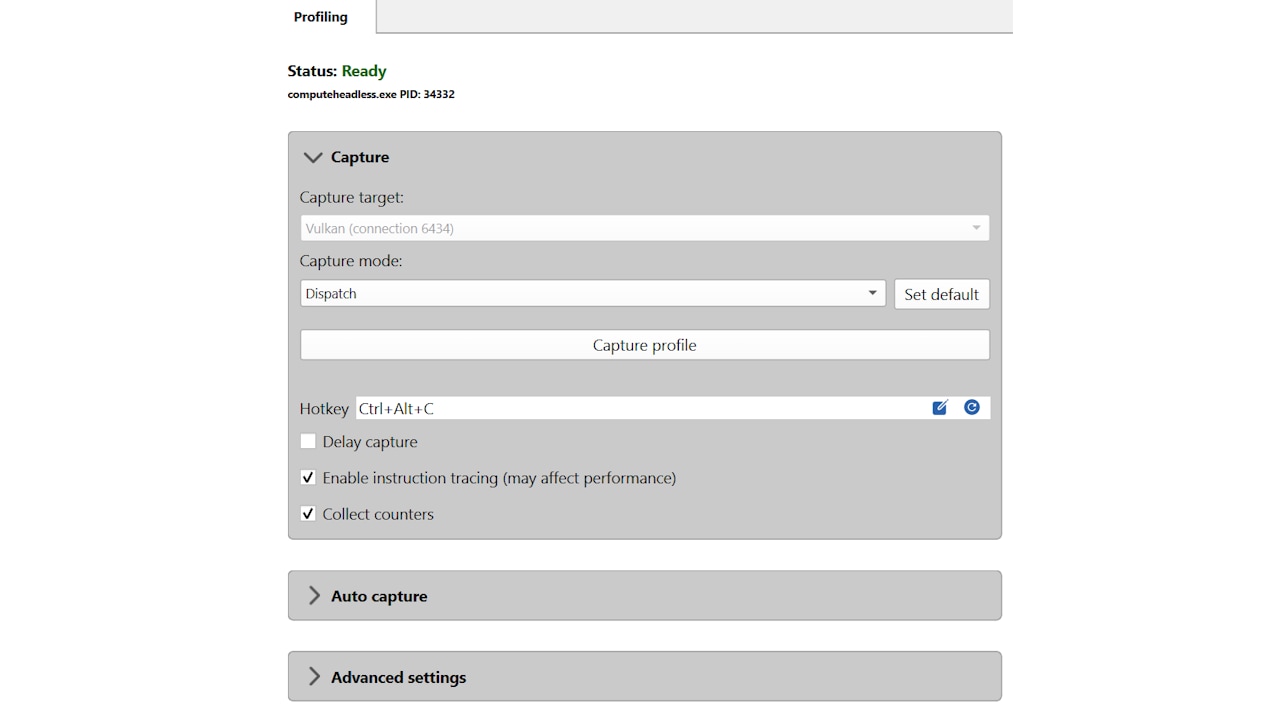
The Radeon™ GPU Profiler is a performance tool that can be used by traditional gaming and visualization developers to optimize DirectX 12 (DX12) and Vulkan™ for AMD RDNA™ hardware. The Radeon™ GPU Profiler (RGP) is a ground-breaking low-level optimization tool from AMD. It provides detailed timing information on Radeon™ Graphics using custom, built-in, hardware thread-tracing, allowing the developer deep inspection of GPU workloads. This unique tool generates easy to understand visualizations of how your DX12 and Vulkan™ games interact with the GPU at the hardware level. Profiling a game is both a quick and simple process using the Radeon™ Developer Panel together with the public display driver.
Note Radeon™ GPU Profiler does have support for OpenCL™ and HIP applications but it requires running on AMD RDNA™ GPUs in the Windows environment. Running HIP and OpenCL™ in the Windows environment is a whole blog series in itself and outside the current recommendation for HPC applications. For HPC workloads, we recommend programming with HIP in a Linux® environment on AMD Instinct™ GPUs and using Omniperf, Omnitrace or ROC-profiler profiling tools on them.
AMD uProf (AMD MICRO-prof) is a software profiling analysis tool for x86 applications running on Windows, Linux® and FreeBSD operating systems and provides event information unique to the AMD “Zen”-based processors and AMD Instinct™ MI Series accelerators. AMD uProf enables the developer to better understand the limiters of application performance and evaluate improvements.
AMD uProf offers:
Performance Analysis to identify runtime performance bottlenecks of the application
System Analysis to monitor system performance metrics
Roofline analysis
Power Profiling to monitor thermal and power characteristics of the system
Energy Analysis to identify energy hotspots in the application (Windows only)
Remote Profiling to connect to remote Linux® systems (from a Windows host system), trigger collection/translation of data on the remote system and report it in local GUI
Initial support for AMD CDNA™ accelerators is provided in AMD uProf 3.6 for AMD Instinct™ MI100 and MI200 Series devices and new features are under development
In the High Performance Computing space, a number of third-party profiling tools have enabled support for ROCm™ and AMD Instinct™ GPUs. This provides a platform for users to maintain a vendor independent approach to profiling, providing an easy-to-use and high level suite of functionality, that can potentially provide a unified profiling experience across numerous architectures. For users already familiar with these tools, it makes for another easy entry point into understanding performance of their workloads on AMD hardware.
Currently available third party profiling tools include:
CrayPat (only for CrayOS platforms)
Stay tuned as we release further posts in this series diving into the details of setting up and utilizing these available tools. Complete with examples!
If you have any questions or comments, please reach out to us on GitHub Discussions