GPU Reshape
GPU Reshape is a powerful tool that leverages on-the-fly instrumentation of GPU operations with instruction level validation of potentially undefined behavior.
The latest version of Radeon™ Memory Visualizer is now available for download!
One of the most anticipated features introduced with this release is improved support for aliased resources on the Resource overview pane. Other notable enhancements include support for loading Radeon GPU Detective crash dumps, system memory info in the Device configuration pane and hours mode for units of time. In addition, the handling of named resources and filtering of implicit buffers has been made more reliable.
The Resource overview pane presents the user with a diagram containing colored blocks that represent the resources bound to virtual memory allocations. The size of the blocks indicates how much memory the resources are using in relation to other resources and virtual allocations. There are numerous modes that can be selected for colorizing the blocks (with the Color by… dropdown list box). The types of resources can also be filtered from the diagram using the Resource usage dropdown list box.
Aliased resourcing is a graphics API technique game developers can leverage to reduce memory consumption and improve performance. Multiple resources can fully, or partially occupy the same region of a virtual allocation. In other words, the resources can share the same memory. Since the memory is shared, less storage space is needed. Only one resource can be used at a time, but only a single virtual allocation is needed for the aliased resources. The advantages of aliased resources come at a price, however. Memory must be managed by the developer and understanding the overall size of the shared resources can be difficult. Prior to the v1.7 RMV release, the size of the resource blocks on the Resource overview pane were calculated independently of other aliased resources. This could give misleading results. The combined size of the aliased resources shown on the Resource overview pane could exceed the size of the virtual allocation that the resources are bound to.
Starting with v1.7, RMV takes a different approach to calculating aliased resource sizes on the Resource overview pane. First, resources bound to memory regions that overlap with other resources are ordered by usage type in the following order: Event, Shader pipeline, Descriptors, Command buffer, internal, render target, texture, UAV, Ray tracing, Index buffer, Vertex buffer, Multi-use buffer and heap. The priority matches the resource usage color legend on the Resource overview pane from right to left order. If two or more resources of the same usage type overlap, they are then compared by size. The smallest size takes priority. If the size also matches, then the earliest created resource in the memory trace takes precedents. When aliased resources partially overlap one another, the regions of the virtual allocation with overlapped resources is sliced up into sections and the size of those sections is attributed to the portion of the resource’s memory based on the resource aliasing priority described above. As in past releases, the memory blocks have a stippled pattern to indicate they are aliased. Hovering over a memory block will show the actual size of the resource as well as the aliased size (if the resource overlaps with other resources). If the Resource details toggle is enabled, the actual size and aliased size of the selected resource will be displayed.
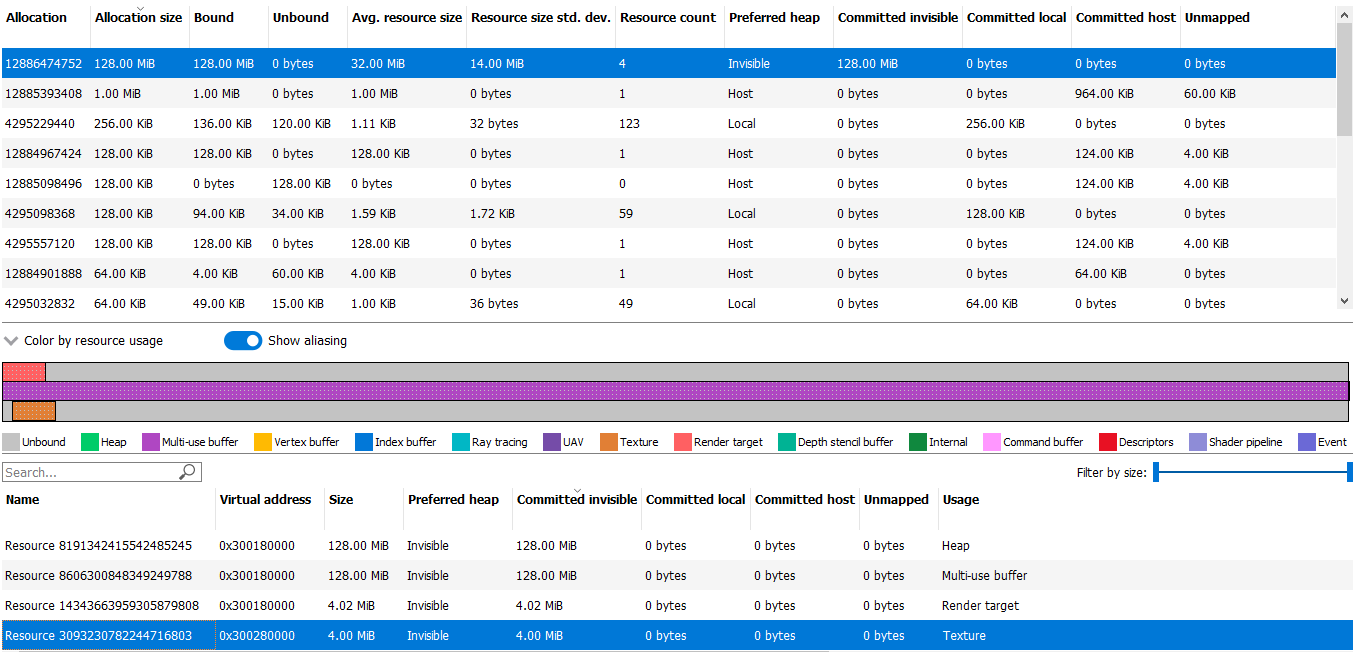
The screenshot below of the Allocation overview pane illustrates an example of aliased resources. A multi-use buffer spans the entire space of the 128 MB virtual allocation memory region. A render target resource overlaps about 4 MB starting from the beginning of the virtual allocation. A 4 MB texture overlaps with a slight offset from the render target. Also notice that the resource bars are drawn with the stipple pattern to indicate they are aliased.
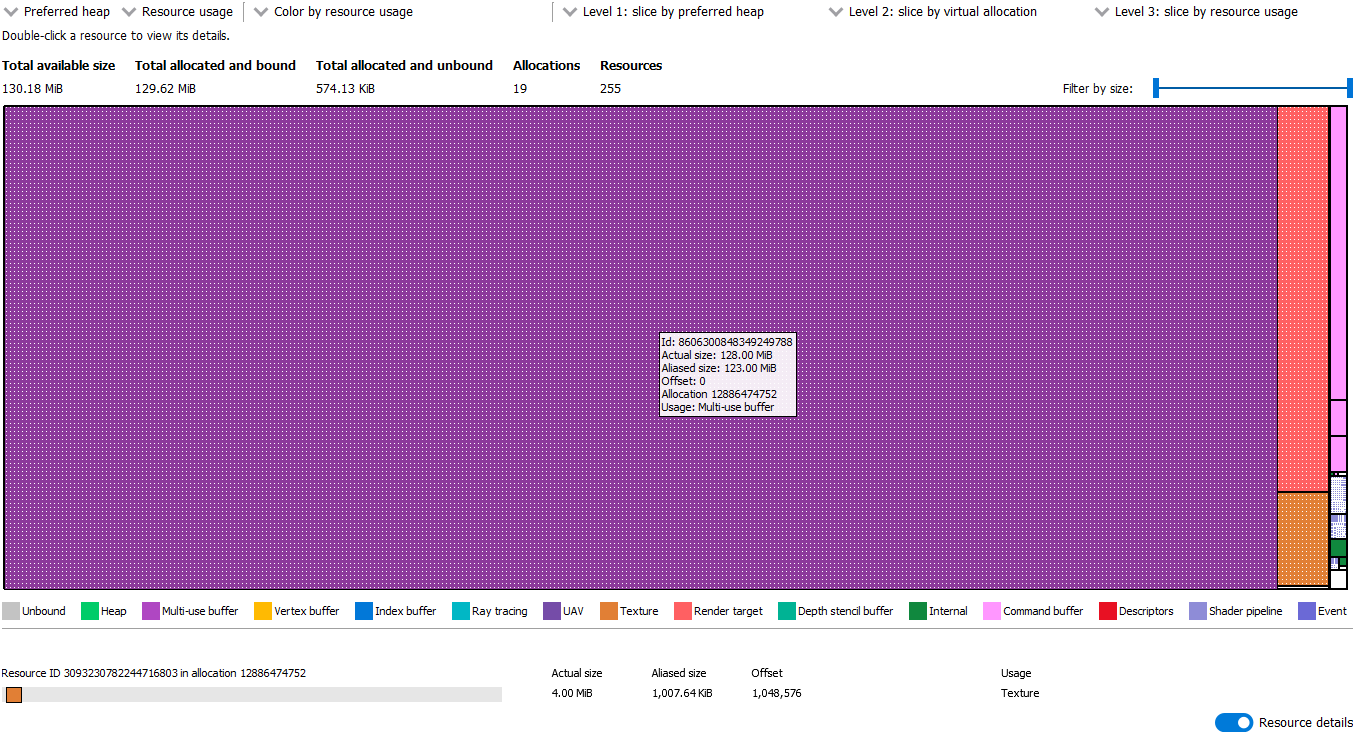
When viewed on the Resource overview pane (shown below), a large block representing the Multi-use buffer can be seen with smaller texture and Render target resource blocks. Hovering over the Multi-use buffer shows the tooltip with a size of 128 MB of actual memory used and 123 MB of aliased memory. The 5 MB difference is applied to the Texture and Render target resources because these have a higher priority when calculating aliased memory usage for the virtual allocation. The Texture resource is selected on the Resource overview pane and shows the details of this resource. The actual size of the Texture resource is 4 MB and the aliased size is about 1 MB. Since the Texture is partially overlapping with the higher priority Render target resource, only the smaller portion of the aliased memory is associated with the Texture.
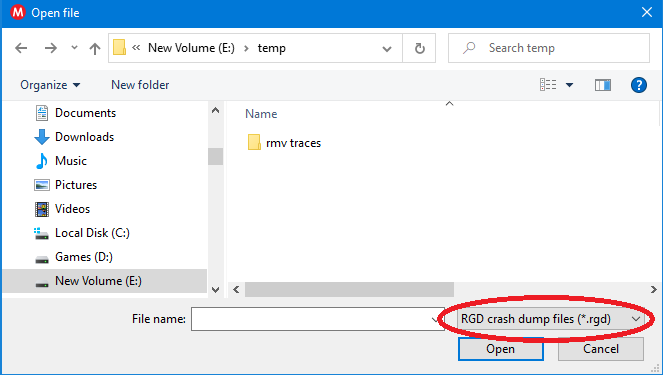
To support the recent introduction of Radeon GPU Detective, RMV now allows RGD crash dump files to be loaded and memory related data to be viewed in the UI. Radeon GPU Detective is a new AMD tool that can assist in tracking down the cause of GPU crashes. RGD files can only be opened in read-only mode by RMV (i.e., created snapshots are not saved). In order to view .rgd file names in the File open dialog box, be sure to select “RGD crash dump files (*.rgd)” in the file filter dropdown listbox.
Just as with RMV files, RGD files can be dragged from the file explorer and dropped onto the RMV UI to open them. RGD files load all the same types of data as RMV files (e.g., allocations and resources that were created and destroyed during the entire lifetime of the process). In order to analyze information about the crash and specific memory resources related to the offending virtual address, the RGD crash dump file needs to be opened with the rgd.exe command-line tool. Radeon GPU Detective Documentation and the software can be downloaded here.
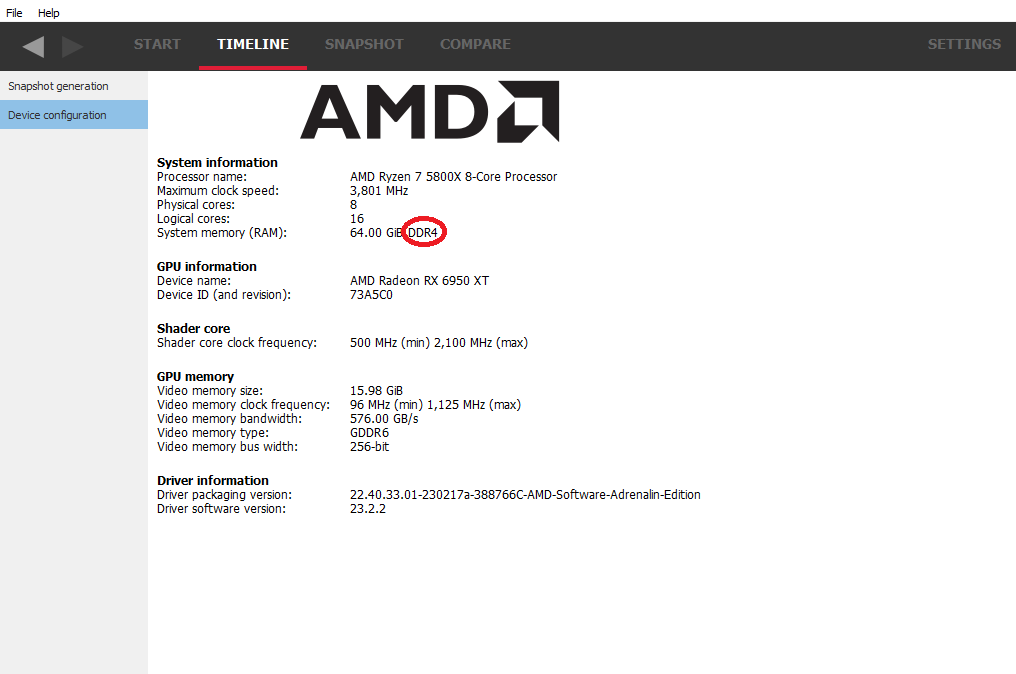
RMV’s Device configuration pane now includes system memory type (e.g. DDR4).
For memory traces that span a long period of time, users can now take advantage of the new Hours time unit mode. In this mode, timestamps are formatted as “H:MM:SS.clk_cycles.” Selecting the various timestamp formats can be accomplished through the General settings pane or with the Ctrl+T shortcut key combination. Pressing Ctrl+T will repeatedly cycle through the different timestamp formats.
Get a handle on your aliased resource memory usage with the improved Resource overview pane and take advantage of all the changes included in the latest Radeon Memory Visualizer release.
You can find out more about RMV, including links to the release binaries on GitHub and the full release notes list, on our product page. Your feedback is incredibly valuable to us and helps drive the RMV roadmap forward, so if you want something and it makes sense then just let us know!