AMD Radeon™ GPU Profiler
AMD RGP gives you unprecedented, in-depth access to a GPU. Easily analyze graphics, async compute usage, event timing, pipeline stalls, barriers, bottlenecks, and other performance inefficiencies.
Here to welcome the new year is a brand-new version of the Radeon™ GPU Profiler (RGP) – version 1.12.
RGP is our ground-breaking low-level optimization tool that provides detailed information on Radeon GPUs.
RGP and other tools, such as Radeon Memory Visualizer and Radeon GPU Analyzer, can be downloaded as part of the Radeon Developer Tool Suite.
This latest release of RGP provides some significant enhancements to the Instruction timing feature.
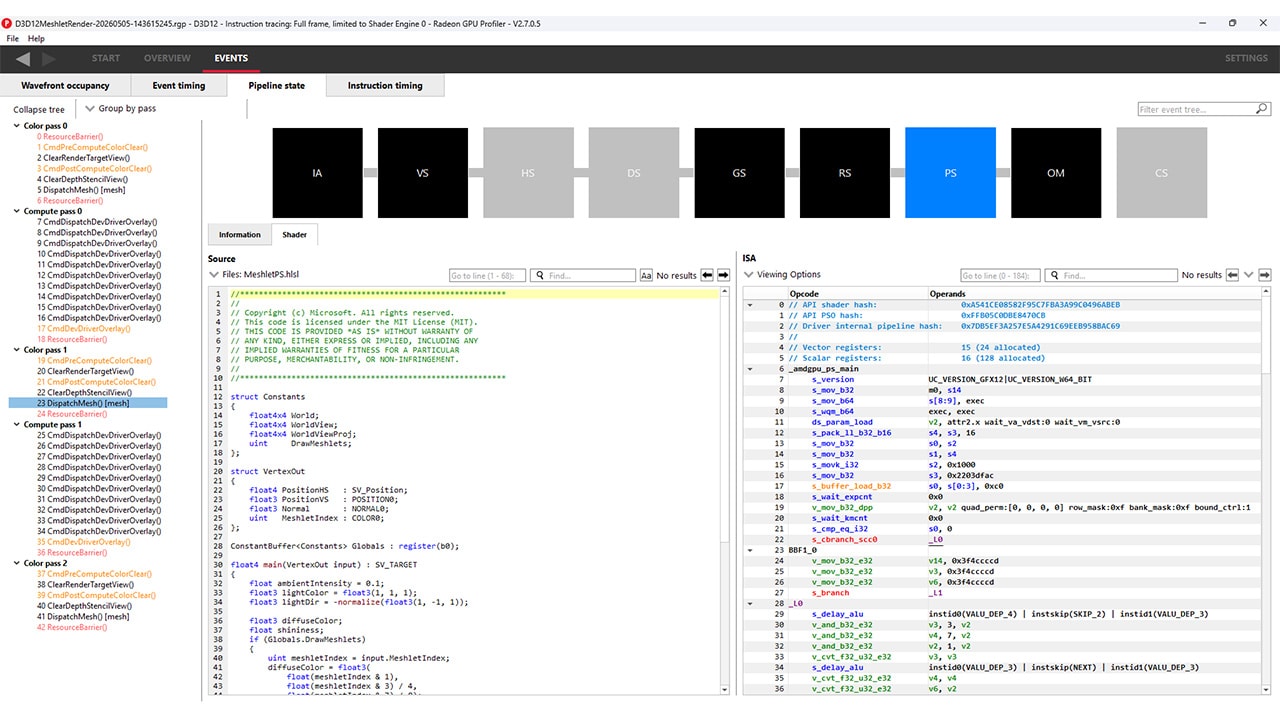
When you take a look at the Instruction timing pane in RGP, you will notice some new UI elements designed to provide additional insights into the performance characteristics of your shader.
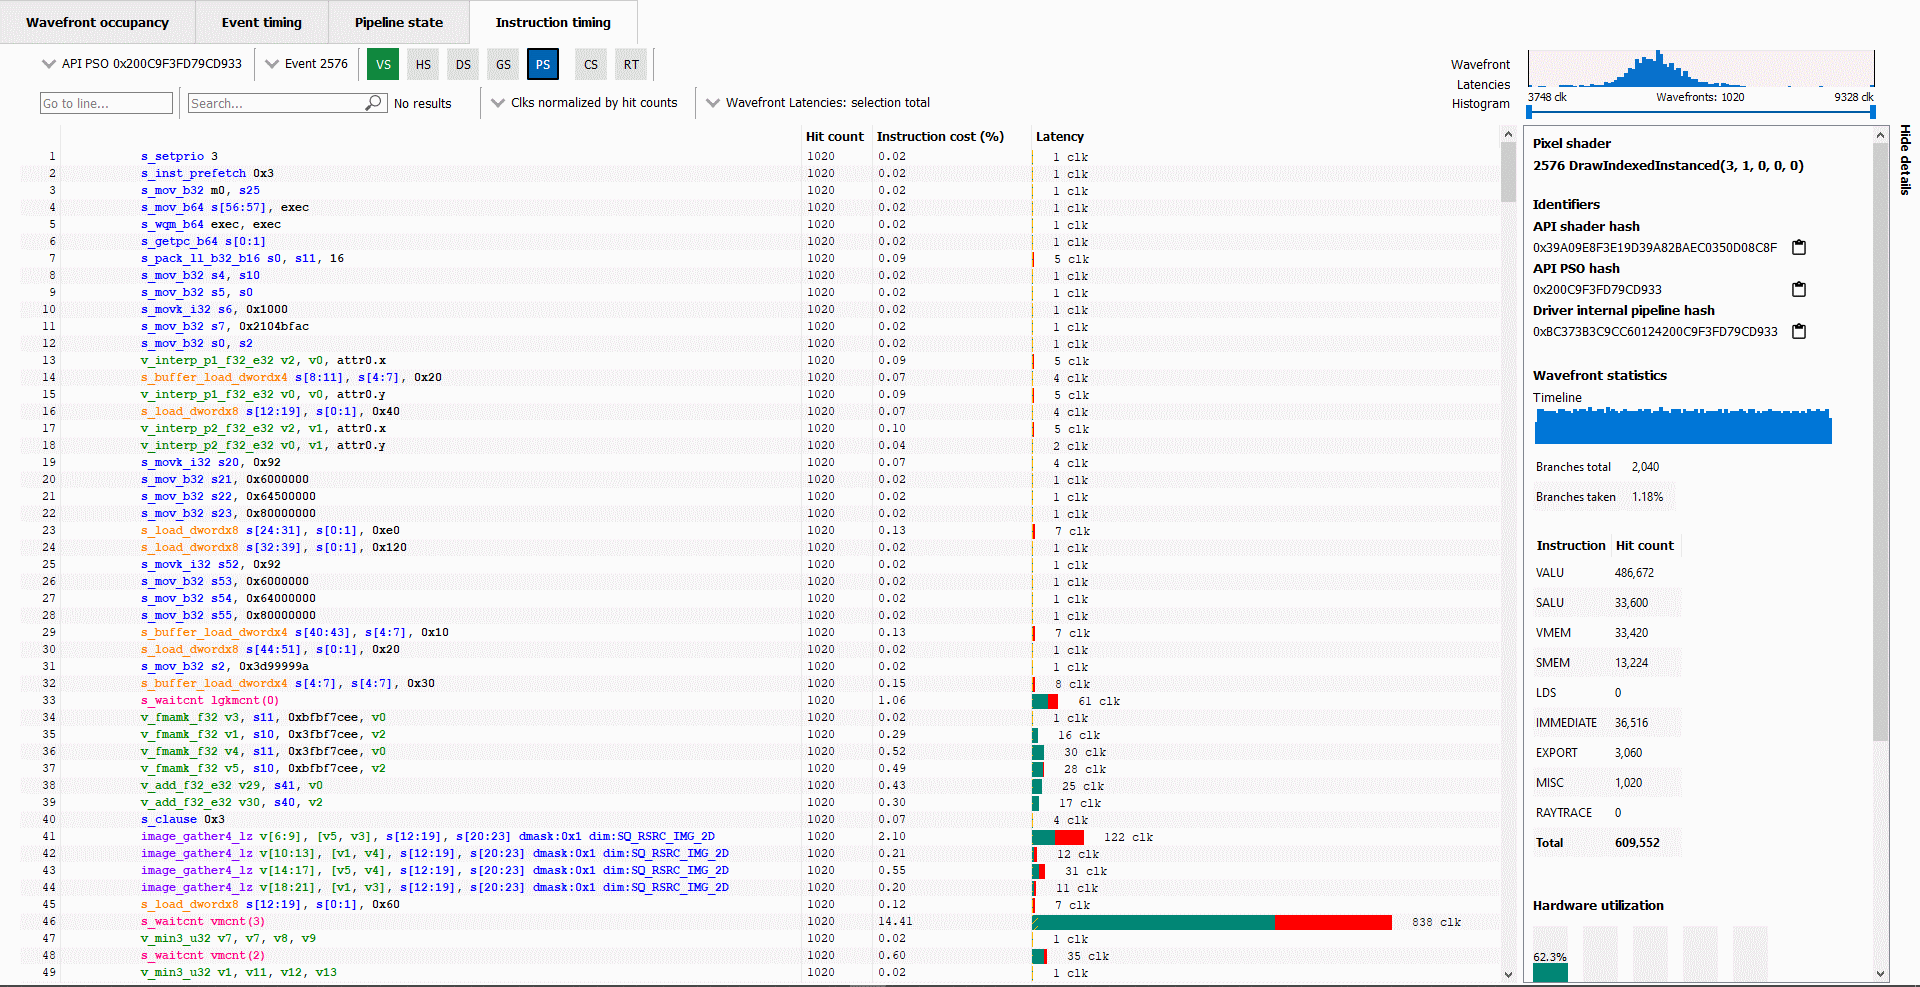
These new features include:
Up until now, the Hit count, Instruction cost, and Latency data shown in the Instruction timing pane has been totaled across all wavefronts analyzed for a particular shader. Starting with RGP 1.12, you can now filter out some of the wavefronts or look at data for a single wavefront (either the slowest wavefront or fastest wavefront in a set).
One of the new UI elements that allows for this is the Wavefront Latencies Histogram.
This histogram provides a visual indication of the distribution of wavefront performance for the selected event and shader.
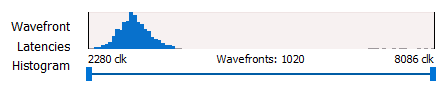
In the above screenshot, you can see that for the selected event, 1020 wavefronts were analyzed. Those wavefronts ranged in performance from 2280 clocks (the fastest) to 8086 clocks (the slowest). The histogram shows the distribution of wavefronts across that range of clock values, with most of the waves appearing at the low end of the distribution.
The double-ended slider control that appears below the histogram can be used to filter out wavefronts to focus on a particular range. For instance, if you want to focus on the slowest wavefronts for a shader, you can drag the left scroll button to the right to filter out the faster wavefronts.
Below, the histogram has been used to filter out many of the wavefronts so that only the slowest 16 wavefronts are selected:
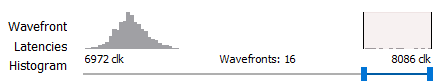
The clock values below the histogram get updated to show that these 16 wavefronts range between 6972 clocks and 8086 clocks. When you do this, the Hit Count, Instruction Cost, and Latency data shown in the Instruction timing pane also gets updated so that it only reflects the wavefronts contained in the specified range. Thus, you can use this feature to get a better understanding of why an event’s slowest wavefronts do not perform as well as its fastest wavefronts.
The screenshot below highlights two other UI elements that can be used together with the histogram to help gain more insight into a shader’s performance:
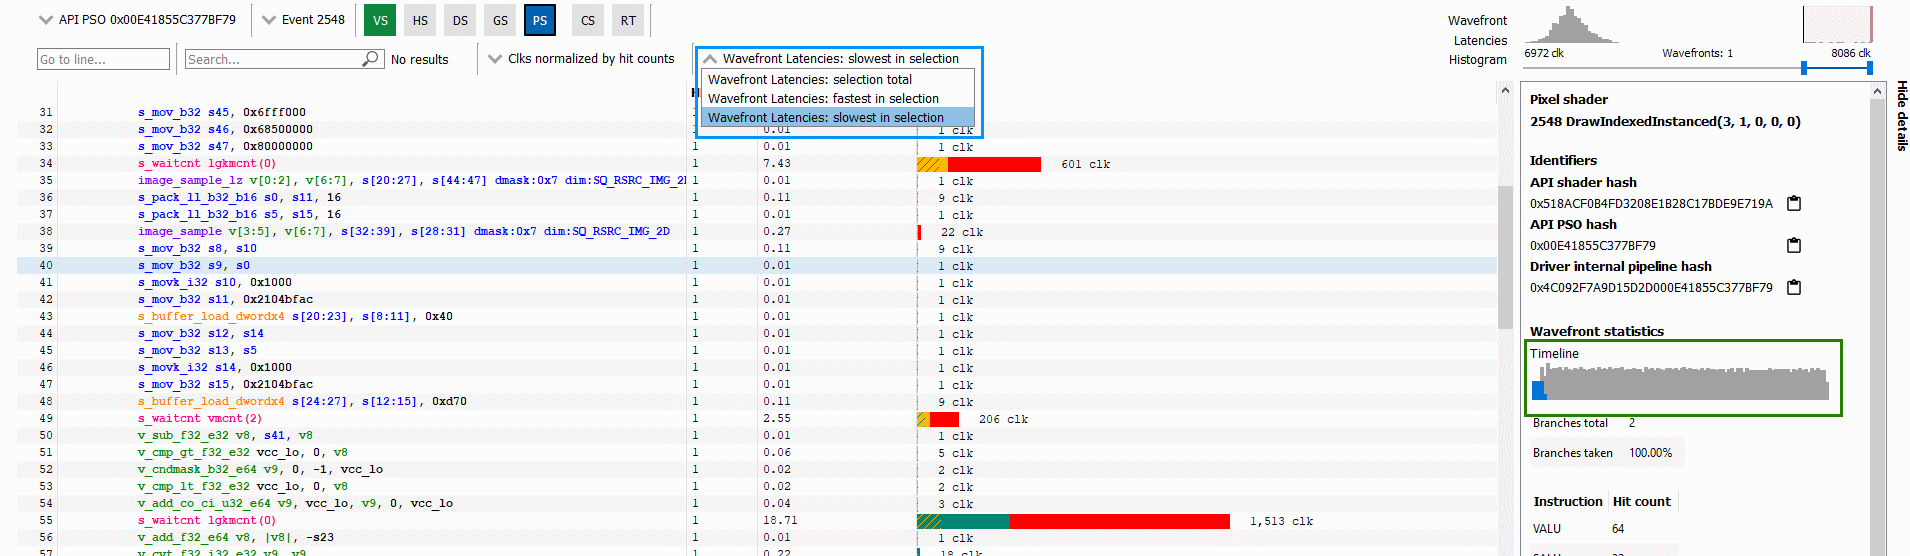
First, there is the wavefront selection drop down which is outlined in blue. This allows you to toggle between showing data for all waves in the current selection, the fastest wave in the selection, or the slowest wave in the selection. In this case, the current selection is the 16 waves selected via the histogram. This dropdown can allow you to quickly see what differences may exist between your slowest and fastest waves.
Second, there is the wavefront timeline in the Details panel which is outlined in green. This shows a timeline of all wavefronts – giving an indication of when wavefronts are executed within the lifetime of the event. When wavefronts are filtered, this timeline shows where in the timeline the selected wavefronts ran. The selected wavefronts are shown as blue in the timeline, while wavefronts that have been filtered out via the histogram are shown as grey.
In the above screenshot, the 16 slowest waves were all executed at the beginning of the timeline, perhaps suggesting that they may have been slow due to cold caches. Knowing when slow wavefronts are executed can provide insight and guidance on where to look for optimization opportunities.
While the Instruction timing pane can be a valuable tool for understanding shader performance, another enhancement in this release is designed to give you more information on where bottlenecks might be.
The latency bars shown for each instruction can now indicate where there is parallel VALU and SALU work being done on other waves slots, effectively showing you where latency may not be a problem because the GPU is able to perform other work. This can be seen in the screenshot below:
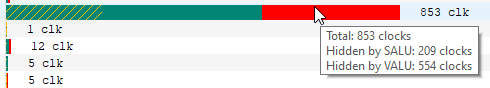
Solid green indicates how much of a given instruction’s latency was hidden by VALU work. Solid yellow indicates how much latency was hidden by SALU or SMEM work. A diagonal hatch pattern made up of both green and yellow indicates how much latency was hidden by both VALU and SALU work. Finally, red indicates how much latency was not hidden by other work being done on the GPU.
It is likely that bars with large red segments indicate a stall occurring while the shader is executing. When the mouse hovers over a row in the Latency column, a tooltip appears showing the exact breakdown of that instruction’s latency.
In the image above, the total latency of the instruction is 853 clocks. Of those 853 clocks, 209 clocks worth of latency are hidden by SALU work on other slots and 554 clocks worth of latency are hidden by VALU work. The 209 clocks where both SALU and VALU work was being done is shown using the hatch pattern. The segment between 209 and 554 clocks is shown as green since only VALU work is being done. The segment between 554 and 853 clocks is shown as red since there is no other work being done. Since there is more VALU work being done at the same time, green is more prevalent than yellow in this bar.
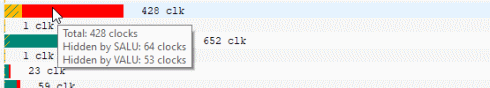
Contrast this with the image below, where an instruction is shown where more latency is hidden by SALU work. In this case, yellow is more prevalent than green.
You can find out more about RGP, including download links and the latest release notes list, on our product page.
As always, we love to get feedback and suggestions from developers. If there is something you’d like to see in RGP or if you run into any issues, please let us know!
The latest version of the Radeon GPU Profiler is available as part of the Radeon Developer Tool Suite.
Download Radeon Developer Tool Suite (Windows® 10) Download Radeon Developer Tool Suite (Linux)