AMD Radeon™ GPU Profiler
AMD RGP gives you unprecedented, in-depth access to a GPU. Easily analyze graphics, async compute usage, event timing, pipeline stalls, barriers, bottlenecks, and other performance inefficiencies.
We are happy to announce version 1.13 of the Radeon™ GPU Profiler (RGP) as well as version 2.6 of the Radeon Developer Panel.
The primary focus of this release has been enhancing the ray tracing features in RGP. This includes adding a few new features, as well as making improvements to existing ones.
We talked about some of these improvements in our recently-published “Raytracing Performance Revealed” video (YouTube link). Others updates will be presented in this article for the first time.
One major new feature is the collection and visualization of ray tracing performance counters. These new counters, shown in the screenshot below, provide you with information on the number of ray box intersection tests and ray triangle intersection tests performed by your frame. These counters only show up when profiling a game that performs hardware-accelerated ray tracing. In addition to providing the raw data about the number of intersections performed by the frame, the graphs also show how those tests are distributed across the ray tracing events in the frame.
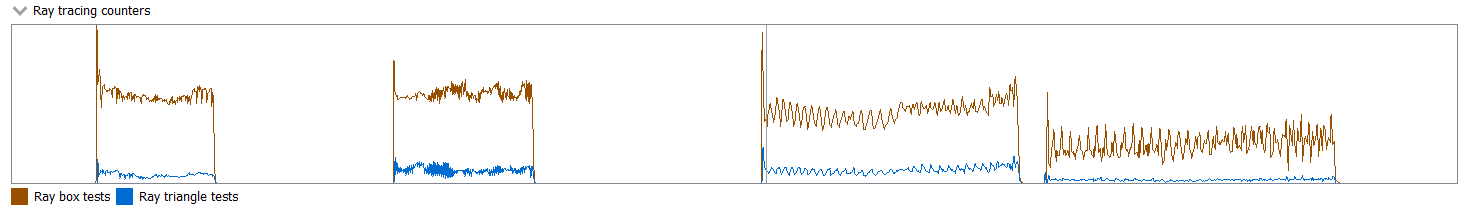
These counters appear in the Wavefront occupancy pane, beneath the cache counters which were added in a previous release. Here is a larger view of the Wavefront occupancy pane, showing the new ray tracing counters row:
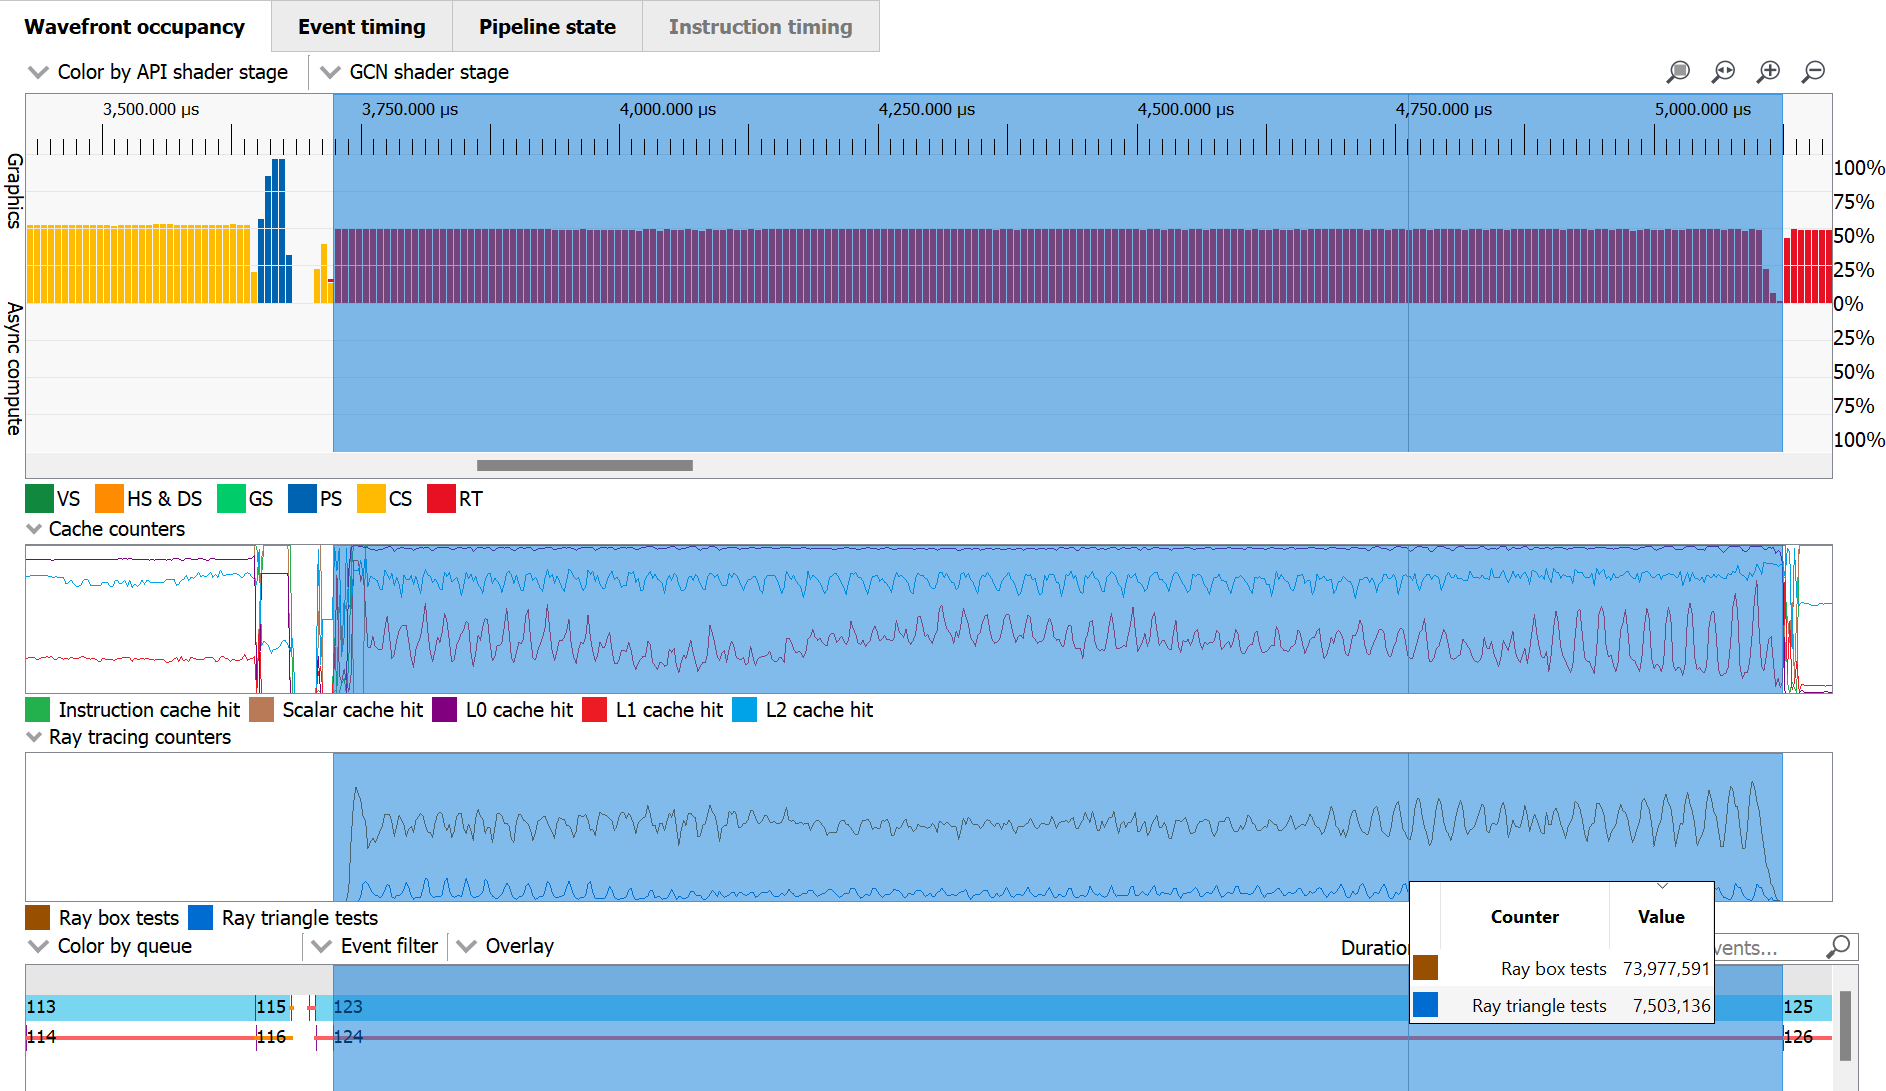
In the screenshot above, we have selected a range corresponding to a single DispatchRays call (Event #123). In the ray tracing counters tooltip, we can see the total number of ray box and ray triangle tests performed by the selected region. This gives us an idea of how many intersection tests are performed by this particular event.
In previous versions of RGP, it could be difficult to figure out which parts of a frame were using inline ray tracing. Inline ray tracing, which is part of the DirectX® Raytracing (DXR) Tier 1.1 support, is a form of ray tracing that doesn’t use separate dynamic shaders or shader tables. Instead, any shader stage can trace rays using a previously-built acceleration structure. While it was possible to manually check a shader’s ISA disassembly for an intersect ray instruction, that could be quite cumbersome. In version 1.13, RGP will now detect inline ray tracing in any shader. RGP also provides unique visualizations to let you know which pipelines, events, and wavefronts are performing ray tracing, whether it is inline or traditional ray tracing.
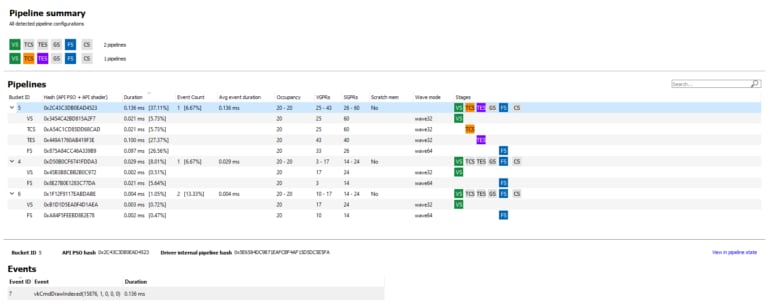
The first place to look for shaders with inline ray tracing is in the shader stage UI control that appears in the Most expensive events and Pipelines panes. This same control also appears in the Details panel in the Wavefront occupancy and Event timing panes, as well as in the toolbar area of the Instruction timing pane. Two examples of the shader stage control are shown below.
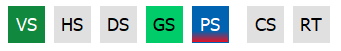
This is a pipeline that contains a Vertex Shader, Geometry Shader, and a Pixel Shader:

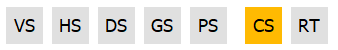
Here is a pipeline that contains a Compute Shader:
And here is a pipeline that contains a traditional ray tracing pipeline (initiated by a DispatchRays call):

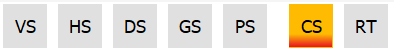
When a shader performs inline ray tracing, that shader is displayed with a color gradient that starts with the specified ray tracing color (red by default) and blends into the color defined for the stage. Here is how this looks for a Compute Shader that contains inline ray tracing:
And here is how it looks for a Pixel Shader that contains inline ray tracing:
In addition to the shader stage coloring, there are new and enhanced “Color by” modes in the Wavefront occupancy and Event timings panes. When selected, the “Color by ray tracing” mode will paint any wavefronts or events that contain any kind of ray tracing using the defined ray tracing color. In this case, it doesn’t matter whether the wavefront or event is triggered by inline ray tracing or whether it is triggered by a more traditional DispatchRays call.
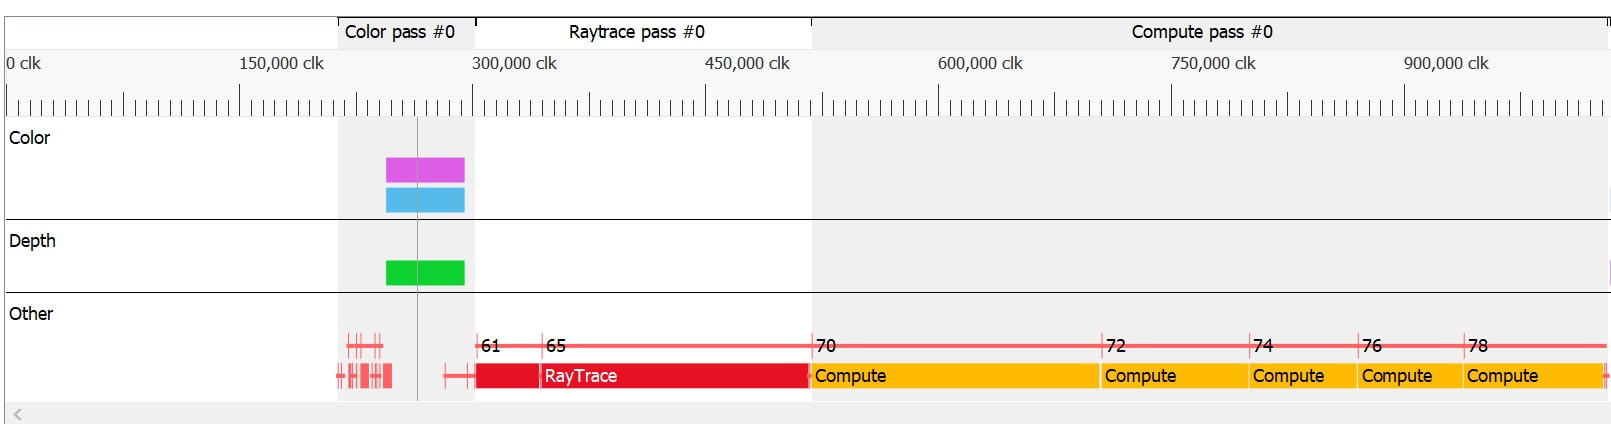
Here we can see these color modes in the Wavefront occupancy pane. The “Color by ray tracing” mode is supported in both the wavefront timeline and in the event timeline. In this screenshot, Event #2477 is an ExecuteIndirect call made up of a Compute Shader that contains inline ray tracing. We have selected “Color by ray tracing” in both parts of the view, causing both the wavefronts and the event to be colored as red.
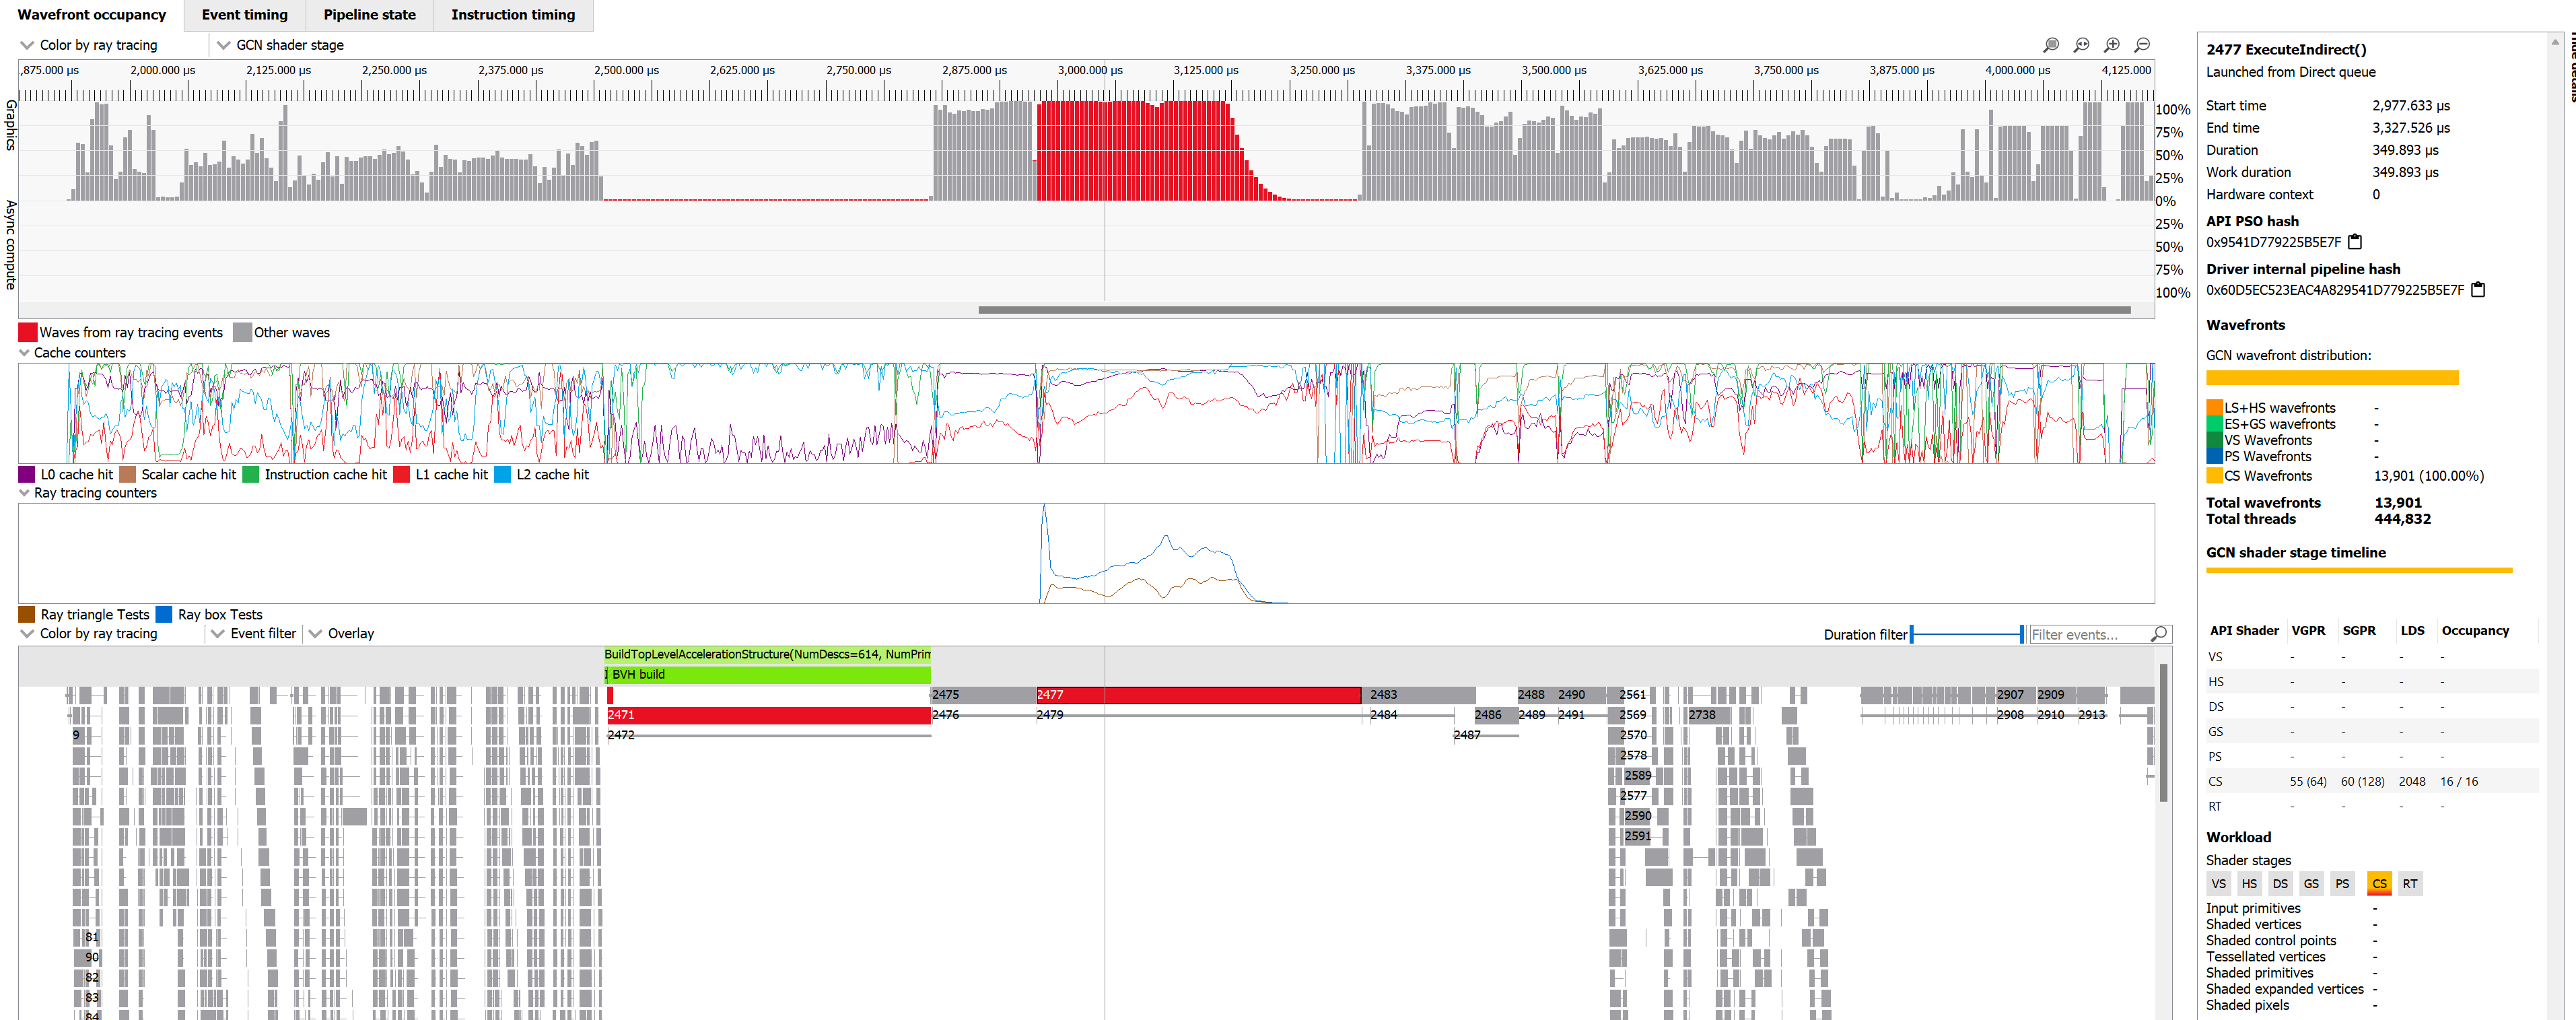
You can also see the aforementioned shader stage control in the Details panel, showing the gradient color indicating that the Compute Shader stage contains inline raytracing. The “Color by ray tracing” in the wavefront timeline is new for this release. The same coloring mode was available in the event timeline and in the Event timing pane in previous releases, but there is one key difference in this latest release. In previous releases, selecting “Color by ray tracing” simply used the “Color by queue” coloring scheme and then grayed out any events that were not related to ray tracing. We now use the more intuitive ray tracing color (red by default) to color the events that are related to ray tracing.
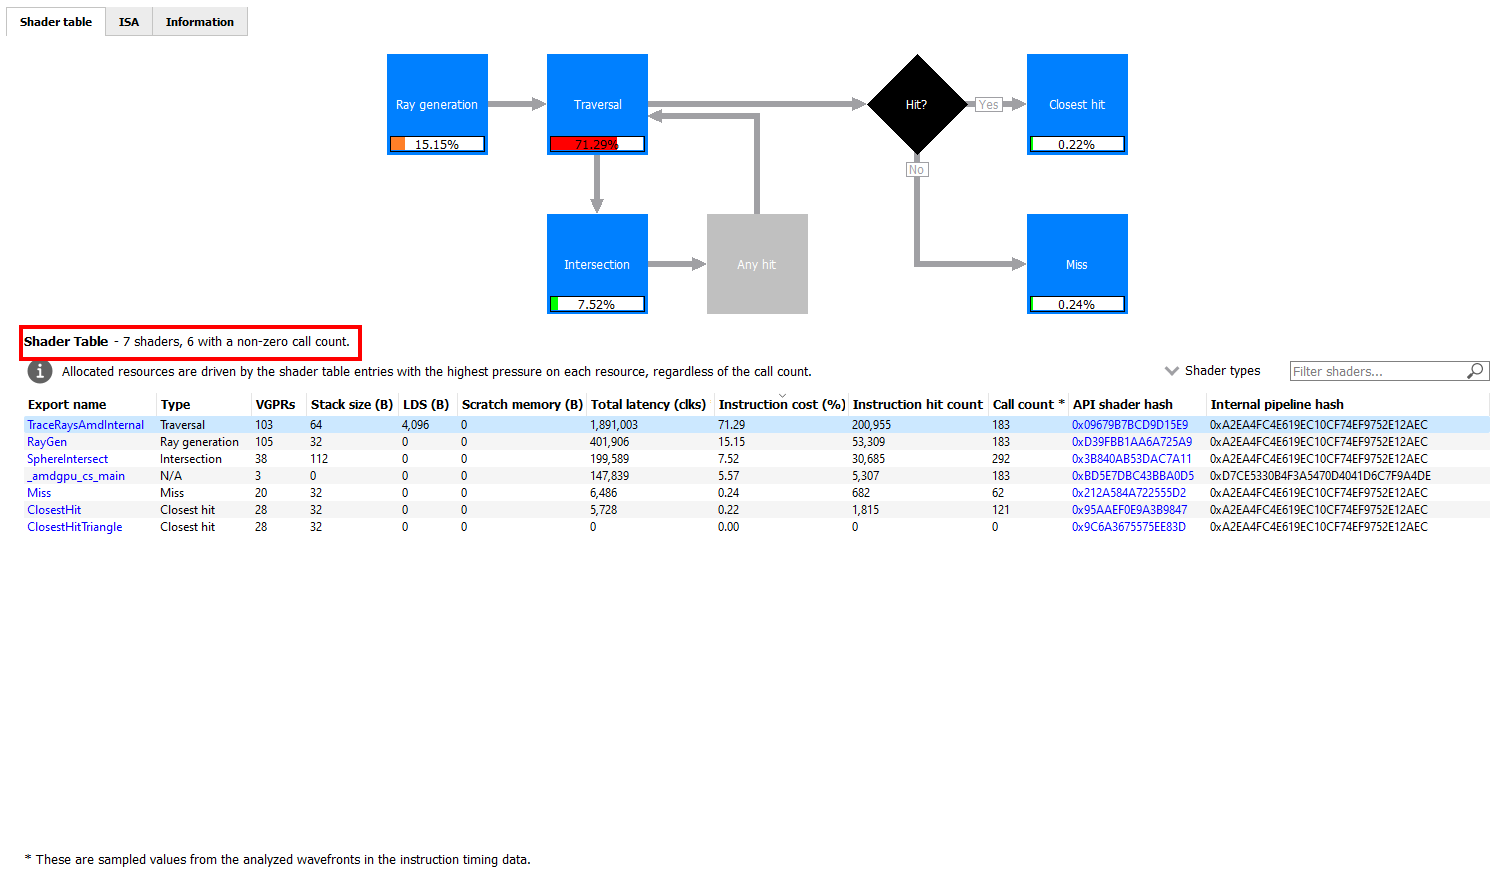
When viewing an indirect dispatch rays event, the Shader Table shown in the Pipeline state pane has been enhanced to show the number of shaders in the table, as well as the number of shaders with a non-zero hit count (when Instruction timing data is available). This can be useful when viewing a large shader table with many individual shaders. This can be seen in the screenshot below with a red outline for emphasis.
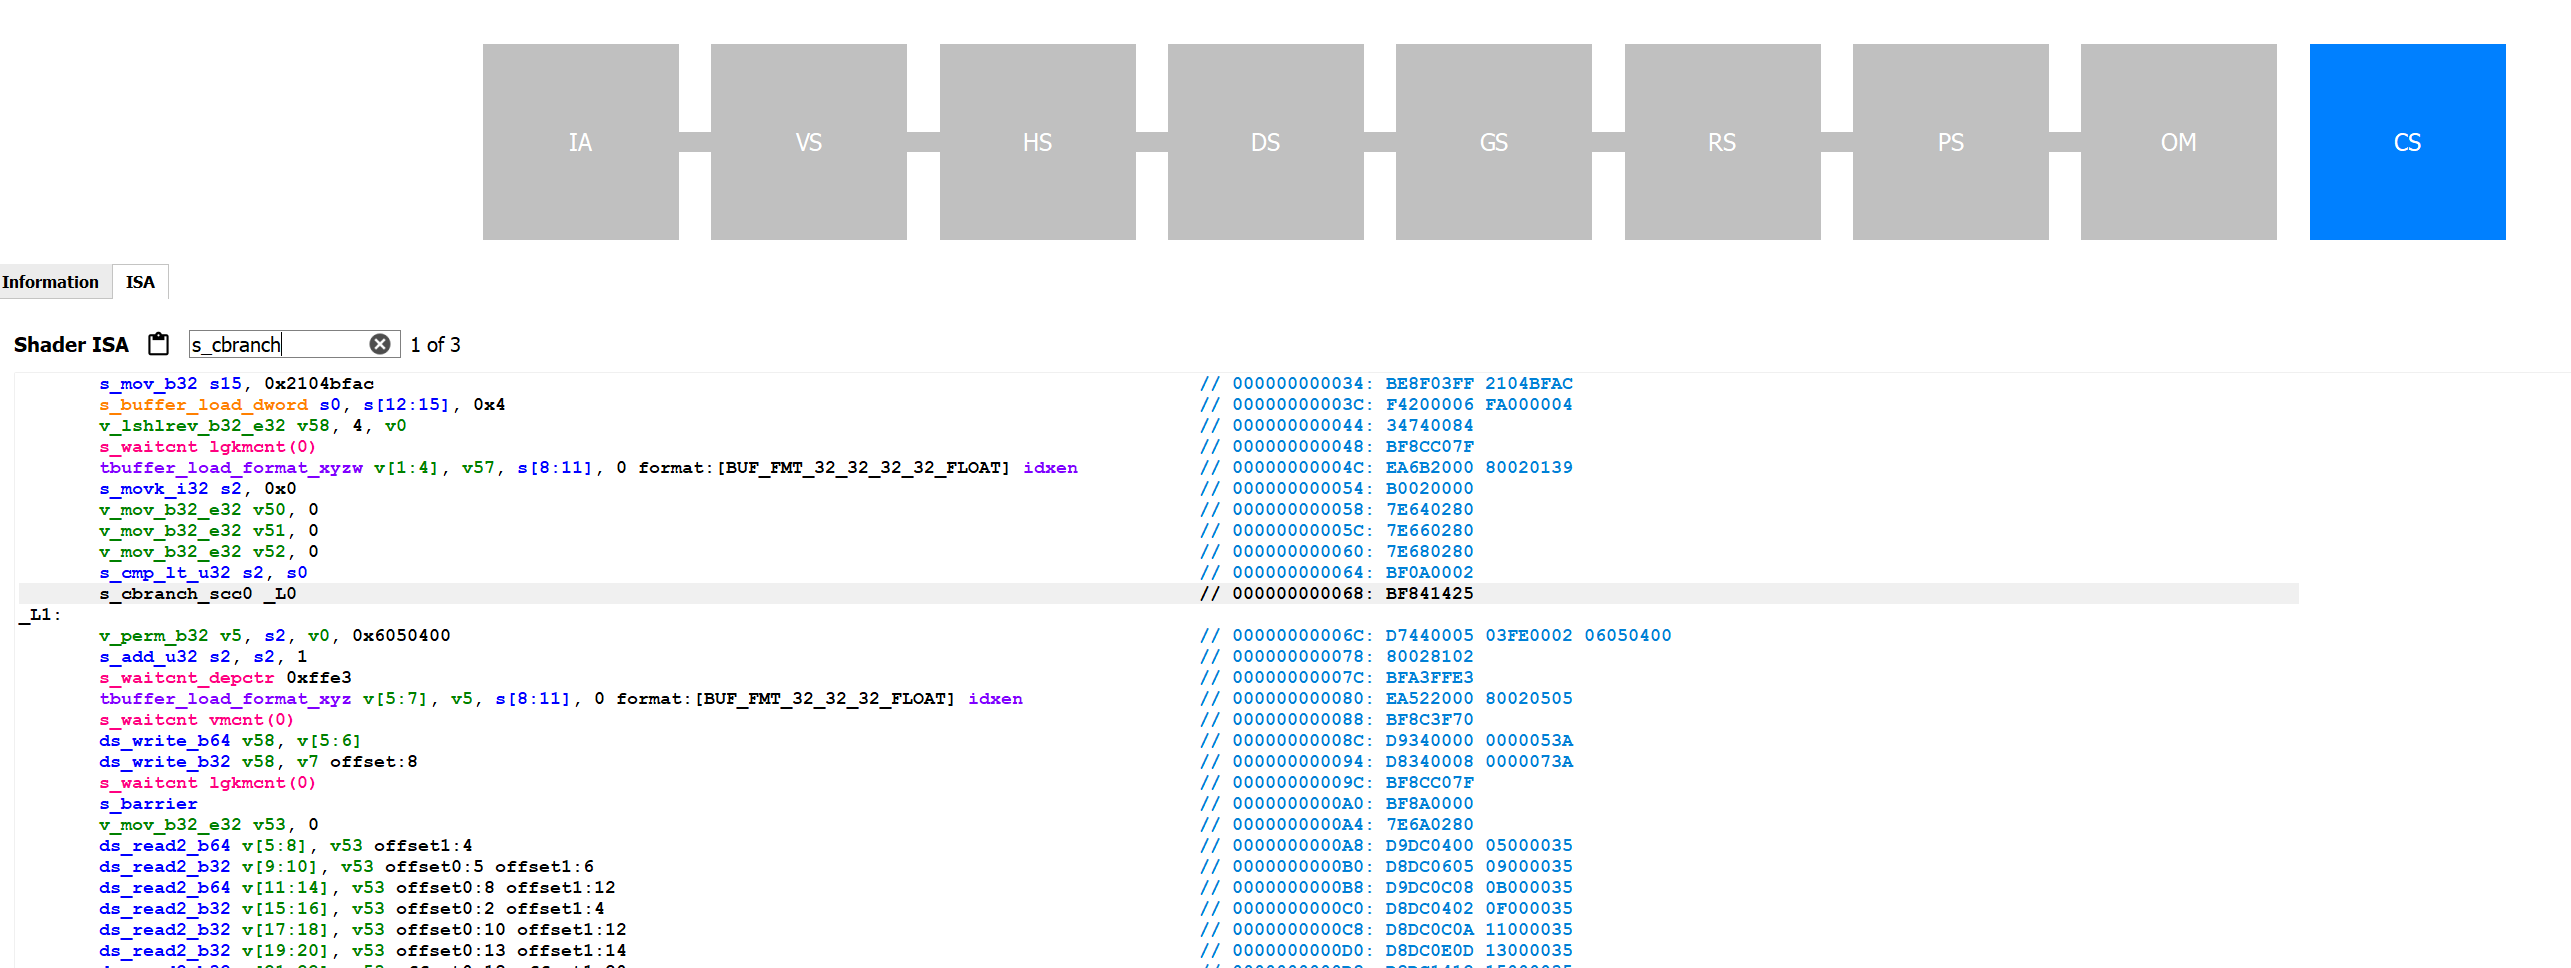
One other key enhancement added to this release is the ability to search in the ISA tab in the Pipeline state pane. In earlier releases, the only way to search within a shader’s ISA disassembly was to copy and paste the contents of the ISA tab into a separate text editor and then search the contents there. In RGP 1.13, searching is now supported directly in the ISA tab. As can be seen below, there is a new Search control. Simply type in the text that you want to search for and press Enter to cycle from one match to the next. In this example, the user has searched for “s_cbranch”.
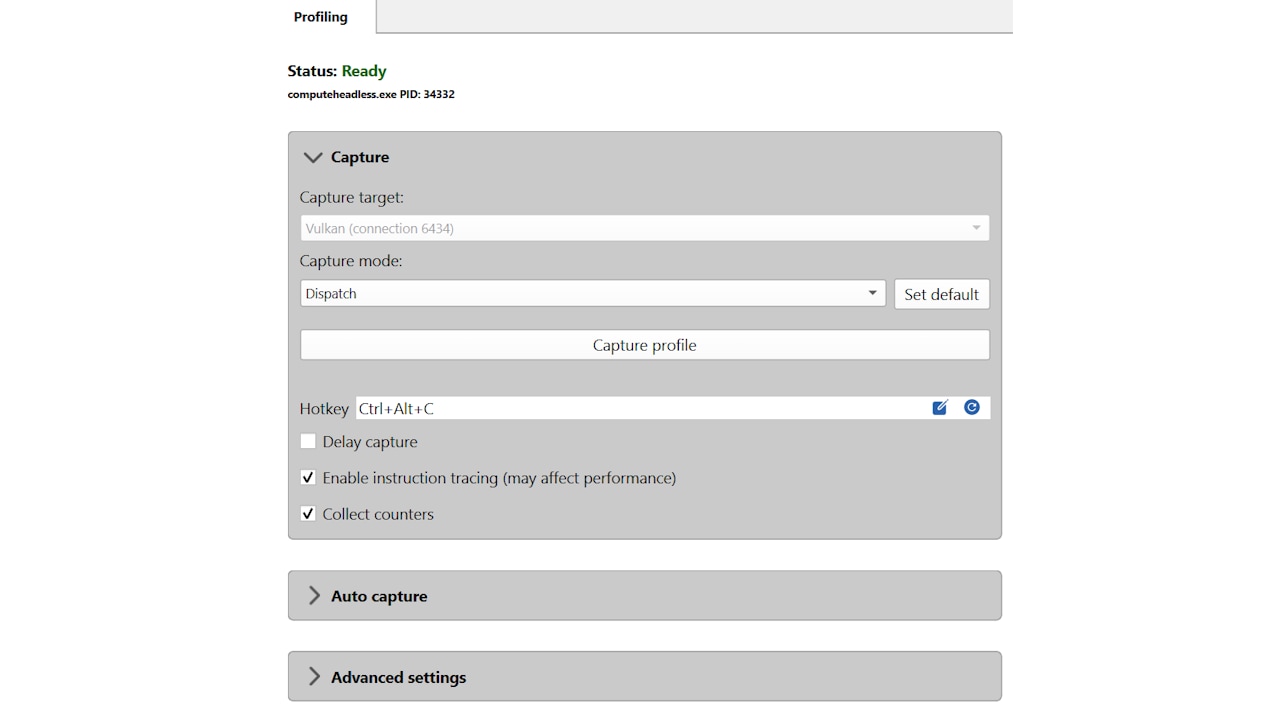
There have also been a few enhancements to the Radeon Developer Panel (RDP), related to capturing profiling data. As mentioned previously, RDP will now capture ray tracing counter data when the “Collect counters” option is checked on the Profiling page. This is in addition to the cache counter data that has been collected in previous releases. RDP also performs some processing of the performance counter data after a capture has completed. This enables RGP to process counter data more efficiently when the profile data is loaded.
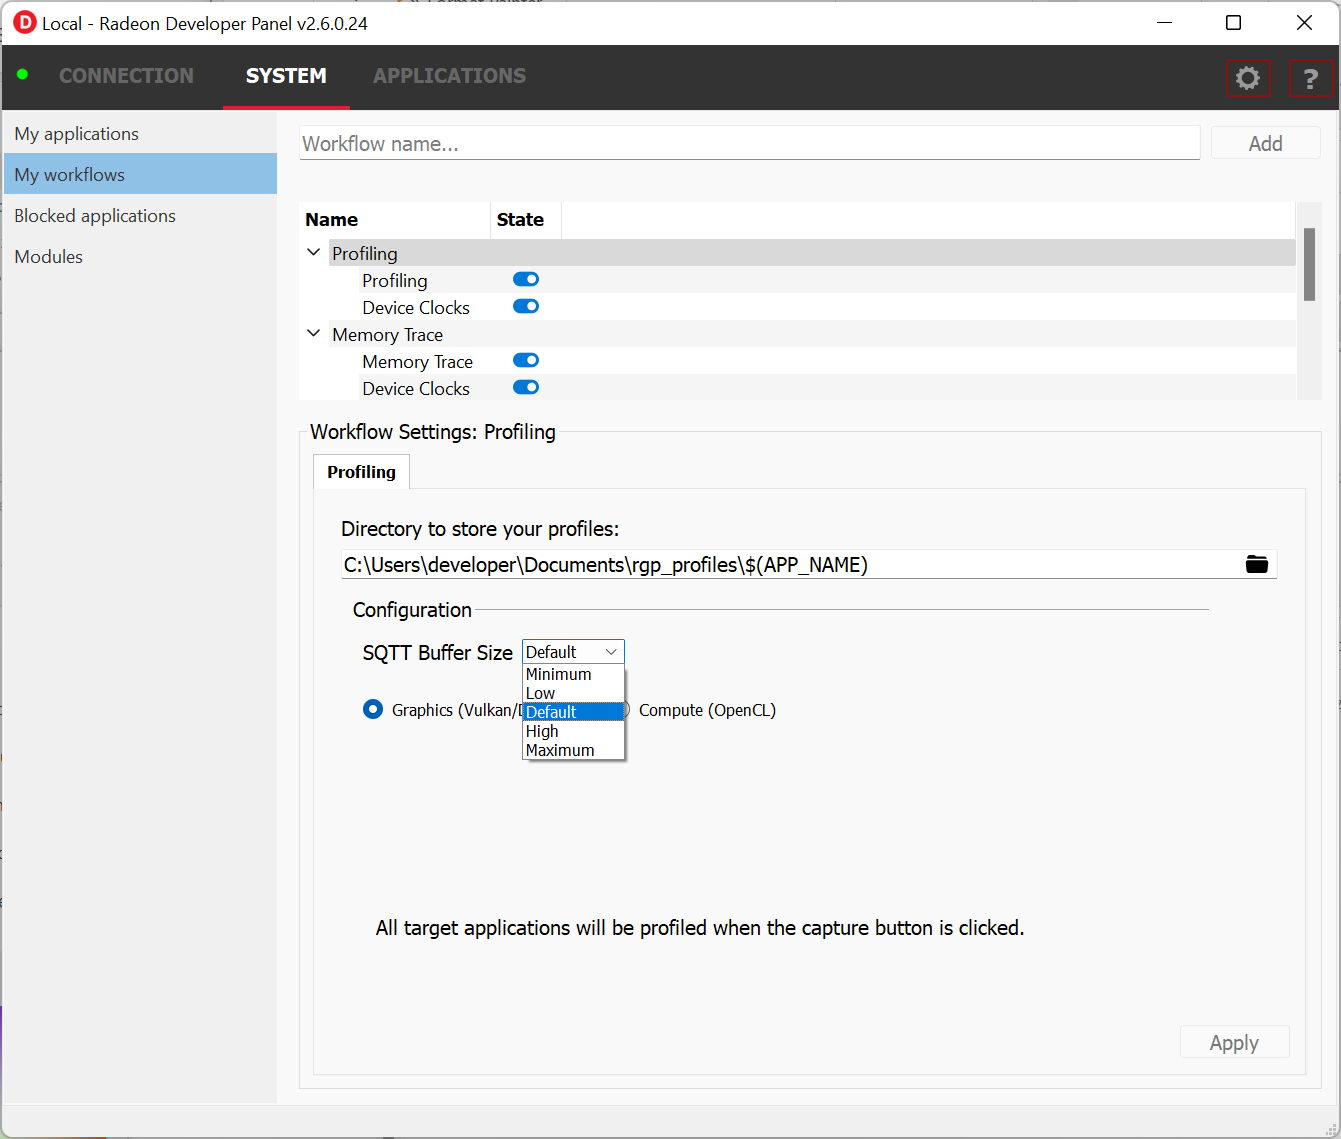
The Profiling page of the “My Workflows” view has a new setting, “SQTT Buffer Size”, which gives you some control over the size of the memory buffer created on the GPU to hold the SQTT profiling data. For most use cases, it is recommended that you use the Default setting. However, if you are trying to capture a long-running frame, you may need to use a larger buffer in order to successfully capture all profiling data from the frame. If you notice that you are not getting a full frame’s worth of profiling data, you may want to experiment with using a larger buffer. Similarly, if the default buffer size is causing memory pressure for your frame, you may want to experiment with using a smaller buffer. This can be something to try if you notice graphical corruption in a frame when you’re collecting profiling data.
There have also been some fixes in RDP to reduce overhead when using a Workflow that includes both Profiling and Memory tracing. Unless you have a specific reason to use a workflow with both modes enabled, it is recommended that you use a Workflow with only Profiling enabled. This will introduce the least amount of overhead while running your game. However, if you do want to include both Profiling and Memory tracing, this latest version of RDP will introduce less overhead than previous versions.
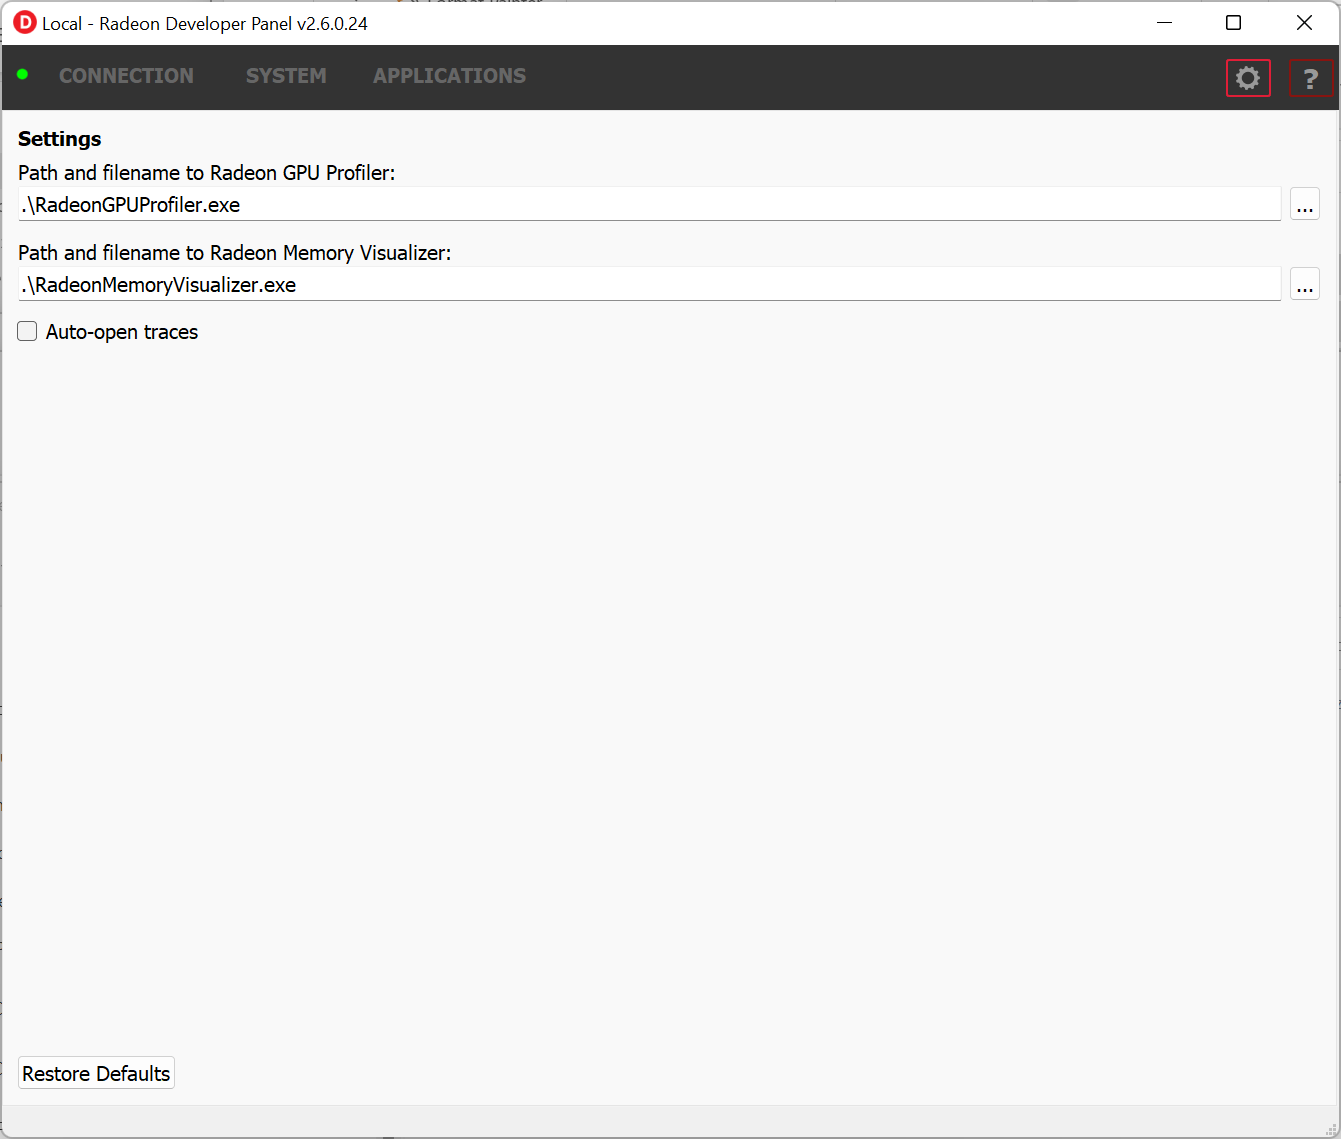
Finally, there has been a small change to the RDP user interface, related to where you can specify the locations of RGP or RMV if you’re collecting Memory trace data.
In the above screenshot, you can see a “Gear” icon on the main toolbar in RDP. Simply click on this icon to bring up the new Settings page where you can specify the location of either RGP or RMV. This page also has a new option, “Auto-open traces”, which will automatically open any captured profile in RGP and any captured memory trace in RMV. This new page can be seen below:
This new release also contains many bug fixes and smaller enhancements in both RGP and RDP. You can find out more about both tools on their GPUOpen product pages:
As always, feel free to reach out to us on GitHub with any feedback, whether it is a bug report or a feature request:
The latest version of RGP and RDP are available for download as part of the Radeon Developer Tool Suite, so why not take a look?