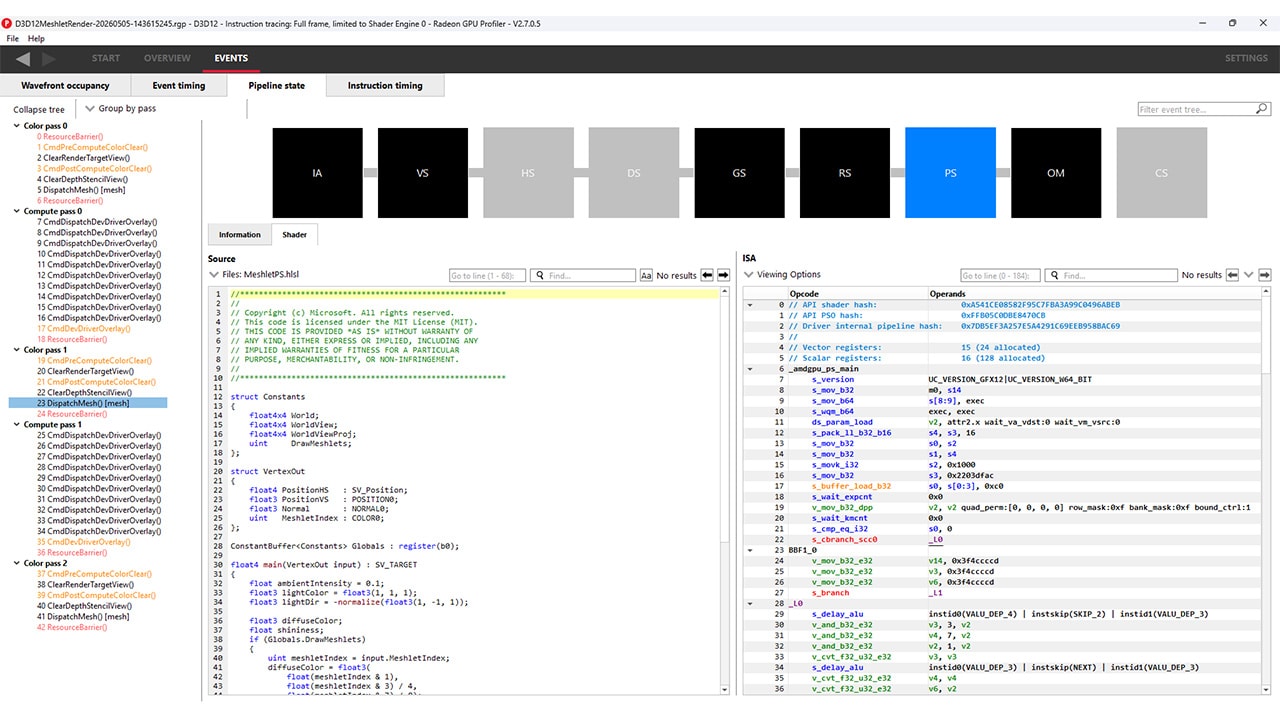
AMD Radeon™ GPU Profiler
AMD RGP gives you unprecedented, in-depth access to a GPU. Easily analyze graphics, async compute usage, event timing, pipeline stalls, barriers, bottlenecks, and other performance inefficiencies.
If you’ve ever heard the term “context roll” in the context of AMD GPUs — I’ll do that a lot in this post, sorry in advance — chances are you maybe have an intuitive instinct for what the term means. But I’d bet you’re probably missing some of the detail about the actual GPU- and driver-side mechanics, maybe aren’t sure what “roll” means, or maybe you’re even thinking about a context at the wrong conceptual level.
Regardless, let me clear it up so that you know definitively what a context roll on our GPUs is, how they apply to the pipeline and how they’re managed, and what you can do to analyse them and find out if they’re a limiting factor in the performance of your game or application. Note that everything I write here applies to modern AMD Radeon™ GPUs based on GCN.
First, let’s clear up what we mean by context. If you’ve done any GPU programming, it’s most common that context refers to a single instance of the API mechanism that lets you issue commands to a GPU device. In that context (I’m not sorry), it’s a top-level software construct and you generally only have one held in your game or app while using the GPU.
That’s not what a context is when we talk about AMD GPU context rolls, though. Context there means what the GPU hardware understands about the current state it needs to be in to correctly draw. You can adjust various bits of per-draw state on a GPU; things like which order the front-end should process vertices in a triangle, or the mode the blender should be in to correctly blend values. Those pieces of mutable GPU state apply to things across the whole GPU pipeline.
So, when we talk about context in terms of context rolls, we mean the required GPU pipeline state needed to correctly draw something.
Now that we know that context refers to the operating state of the GPU during a draw, let’s talk about some GPU hardware specifics. The hardware maintains 8 banks of context registers to store operating state, but the count of 8 is just an implementation detail. We reserve bank 0 for clear state, so there are 7 for normal use. Those 7 usable banks are just a logical construct though; the real implementation in hardware is a bit more complex.
The copies of the context registers are stored in banked RAMs, but they’re distributed across the GPU design and stored in the blocks that need them, rather than being stored all together in a single physical RAM. There’s a hardware block that manages setting new values that talks to the individual blocks that have context registers, broadcasting any updates chip-wide to the blocks that need to know.
Each individual block is then responsible for managing its copies. In terms of how that management block is driven, it’s all down to the command processor, or CP, which is driven by the driver. I’ll talk about that shortly.
Now that you know the GPU maintains multiple copies of context registers, a “roll” is when the CP asks the management block to start working on a new set of the registers because some pipeline state needs to be changed to draw correctly. It does that by asking each block to take a copy of the current registers into a free bank, so that everything is ready to apply any new state updates by programming fresh register values.
The CP doesn’t operate autonomously to manage that state. Instead, it just does what the driver tells it to do. One of the advantages about writing this post now, instead of 8 months ago when I first added it to my list, is that we’ve since open sourced our Vulkan driver, including the lower-level platform abstraction layer (PAL) that the Vulkan user-mode driver is built on!
The driver, via PAL, is responsible for instructing the CP to set the GPU up correctly to work on a draw, and it does so using a packetised command format we call PM4. And now, instead of PM4 being an opaque thing I can’t really talk about, the driver source that builds and issues PM4 packets to the CP is right there for you to read if you want to.
You don’t need to go read it in order to understand context rolls, but if you’re curious, head over to the PAL repository on GitHub. Check out the GFX9 PM4 opcodes for example, or search for EOP (end-of-pipe, which I’ll come to later) or CmdUtil::BuildLoadContextRegs() in the repository. That’s the function which builds the PM4 packet that uses the LOAD_CONTEXT_REG PM4 opcode to program the context registers.
So when you change any GPU pipeline states, the usermode part of the driver that accepts those calls issues its own calls into PAL. PAL then builds the right PM4 packets with the right register ranges, all in order to make the context state update happen at the right time. Say you issue 5 draws to the API from your game, 2 with one set of GPU pipeline state and 3 with another. You’ll ideally get a PM4 command stream with this kind of (pseudo) annotated packet order:
IT_SET_CONTEXT_REG; # program some stateIT_DRAW_INDEX_2; # draw 0IT_DRAW_INDEX_2; # draw 1IT_SET_CONTEXT_REG; # program some more stateIT_DRAW_INDEX_2; # draw 2IT_DRAW_INDEX_2; # draw 3IT_DRAW_INDEX_2; # draw 4Now we know how the GPU manages state per-block, and how the CP is instructed to set it and kick new draws afterwards, what about the performance impact?
There’s no performance impact as long as there’s a free logical context register bank to roll any new context into. But what if all 7 banks are full with needed states for in-flight draws? If your draws contain enough work in them then there still shouldn’t be any impact, since the GPU will likely still be busy as a draw drains out of the GPU pipeline, and the associated end-of-pipe work happens, freeing the logical context and therefore letting the CP roll a new one for a fresh draw.
However if your draws don’t contain much work, you could end up incurring overhead from stalls relating to the GPU not being terribly busy, and there being no free logical contexts to start a new draw and fill the GPU up with work again. In a well-written game or app that won’t happen, but you might find yourself in that position during development. How do you spot that and mitigate it by making changes to your renderer?
The best way to avoid being context starved is to be sensible about how you submit work to the GPU, usually via batching. Batch and submit draws with the same materials and/or rendering states as much as possible, so that back-to-back draws ideally don’t need to roll to a new context at all. Otherwise the multiple banks of context registers are there for a reason!
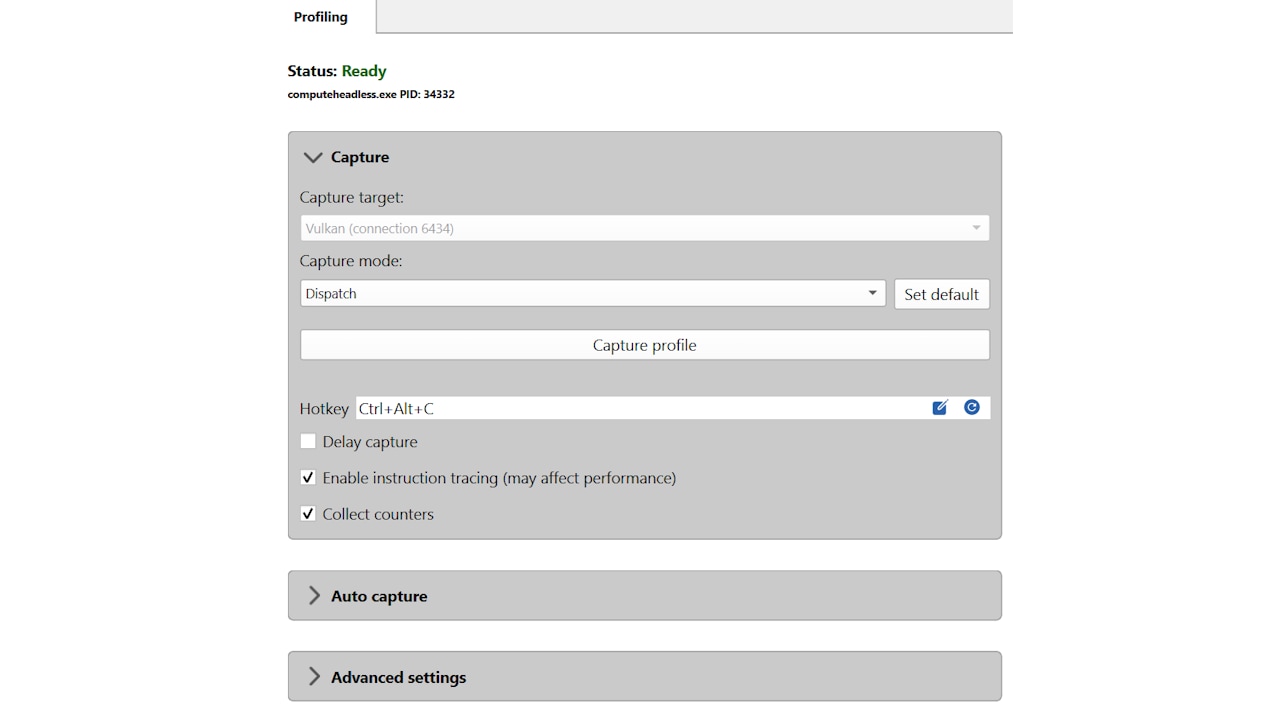
The CP knows when there are no freely available logical context register banks and stalls until one is free if needed. But how do you get notified as the developer? We have context roll analysis in our Radeon GPU Profiler!
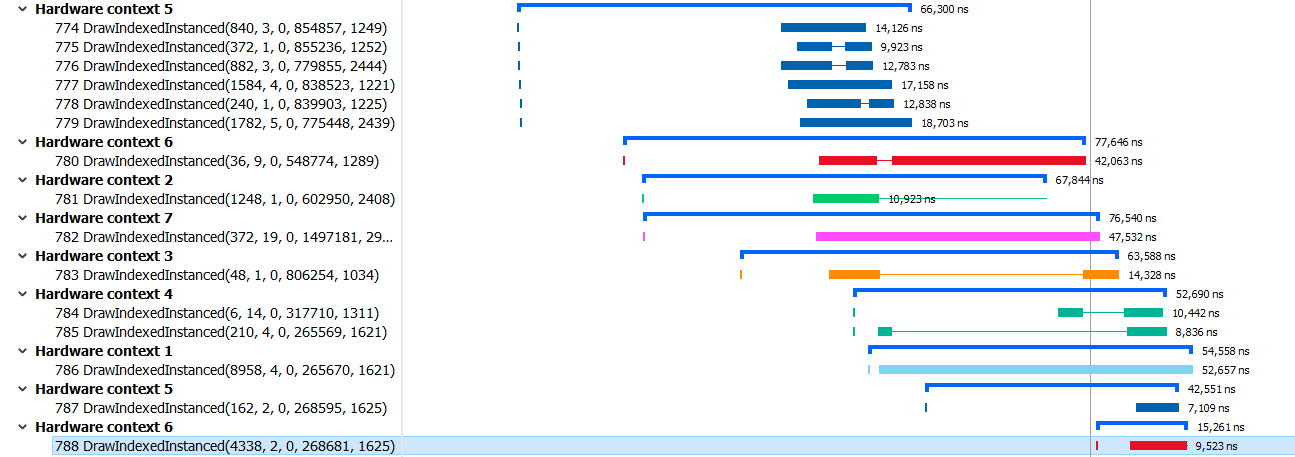
RGP will let you interrogate your frame and it’ll show you in a number of ways what’s happening with contexts. There’s explicit notification in the overview panel, plus you can also colour your draws so that there’s a different colour per device context being used. So, if the timeline looks like a unicorn came to visit, check the overview panel to find out if the CP couldn’t start new draws because you rolled too much 🌈.
Hopefully that’s a decent overview of how the GPU views context state in hardware, how the driver works to program it, and how you can analyse what’s happening in your app with RGP so you can avoid unnecessary rolls.
The driver will try its best to help, but you have the best view of what’s happening during rendering, plus we try very hard to keep the driver light in terms of CPU usage, so spending cycles on context management is best left to the place it can happen most efficiently: your game or app.
The AMD GPU Services (AGS) library provides software developers with the ability to query AMD GPU software and hardware state information that is not normally available through standard operating systems or graphics APIs.
Radeon GPU Analyzer is an offline compiler and performance analysis tool for DirectX®, Vulkan®, SPIR-V™, OpenGL® and OpenCL™.
RGP gives you unprecedented, in-depth access to a GPU. Easily analyze graphics, async compute usage, event timing, pipeline stalls, barriers, bottlenecks, and other performance inefficiencies.