When optimizing performance of a game or some other program, the most important thing is to get hard data first – to profile it using some tools, to see what is happening and where to focus attention. There are many profiling tools available. When talking about graphics, we realize that GPU is really a co-processor that can execute submitted work at its own pace, therefore GPU profiling tools offer a specific type of graph to visualize it. In this article, I will explain how to read this type of graph.
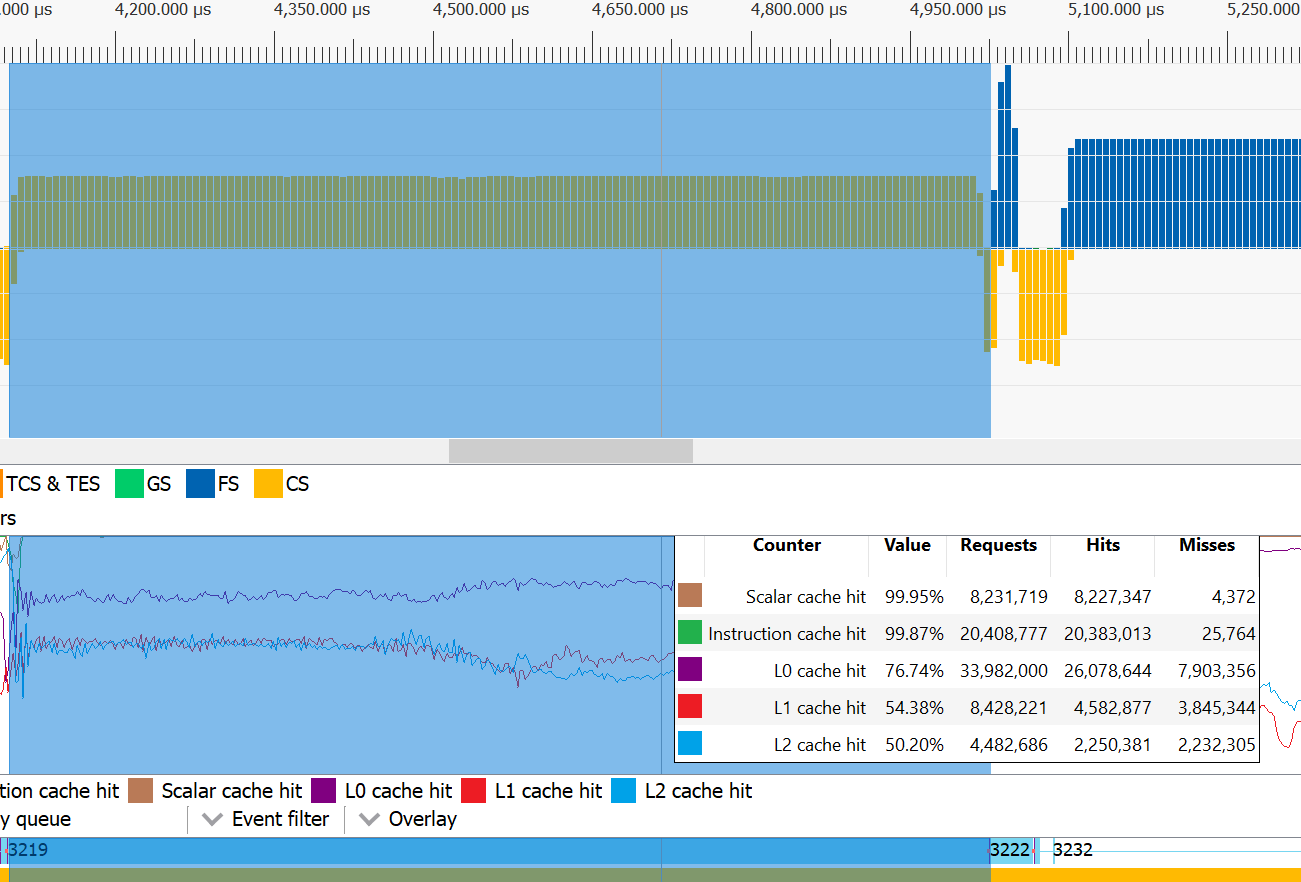
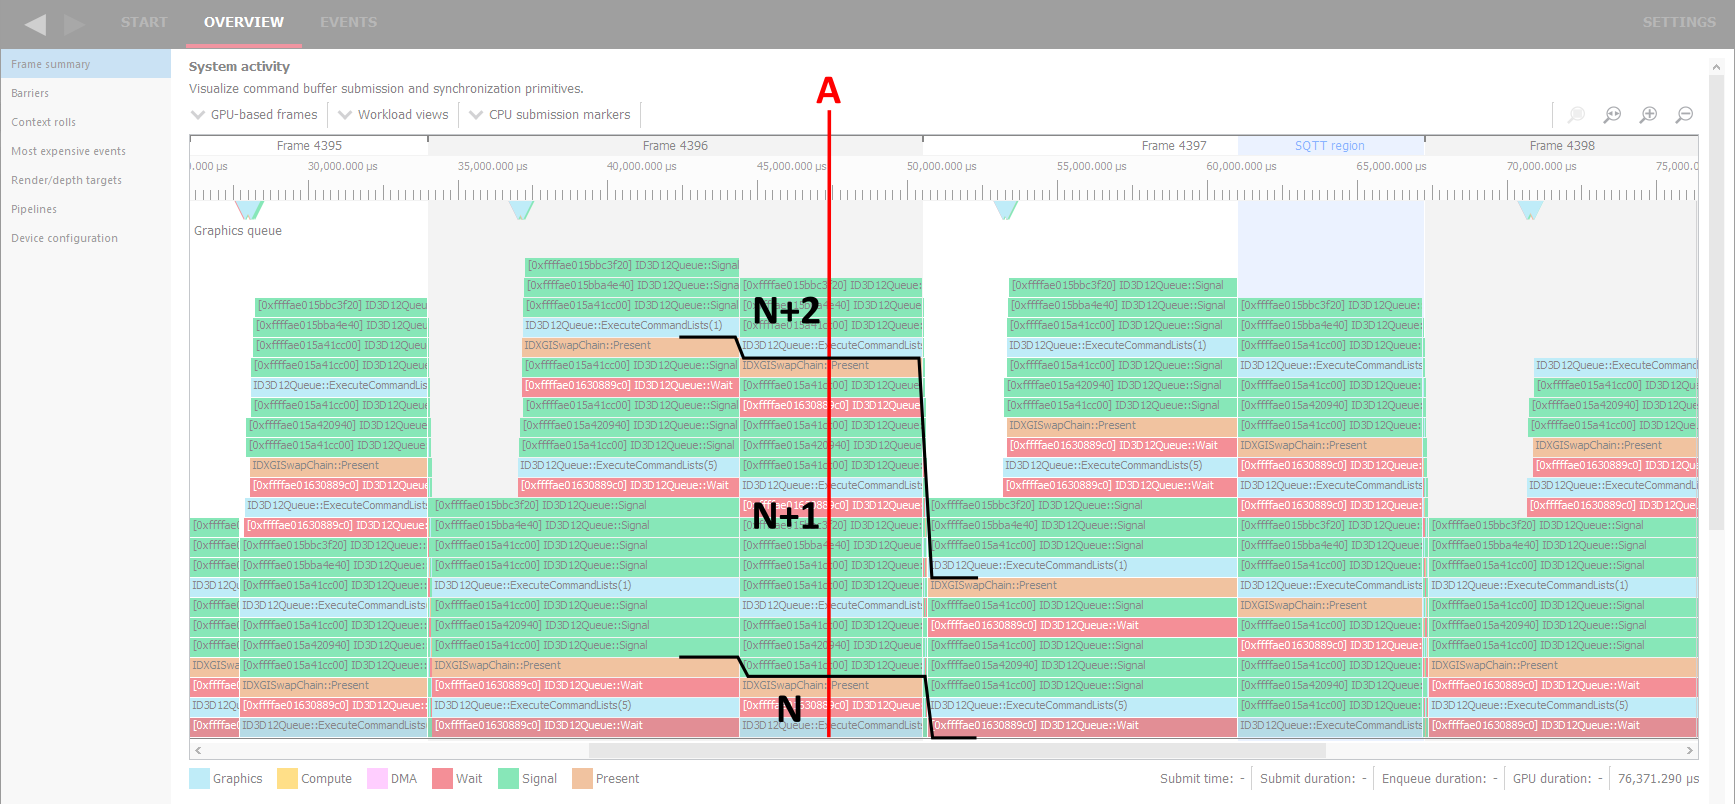
Let’s take Radeon™ GPU Profiler (RGP) as an example. This program is available for free and is compatible with AMD graphics cards. It can capture data from programs that use Direct3D® 12 or Vulkan®. When we open a capture file and go to Overview > Frame summary tab, we can see a graph like this one:
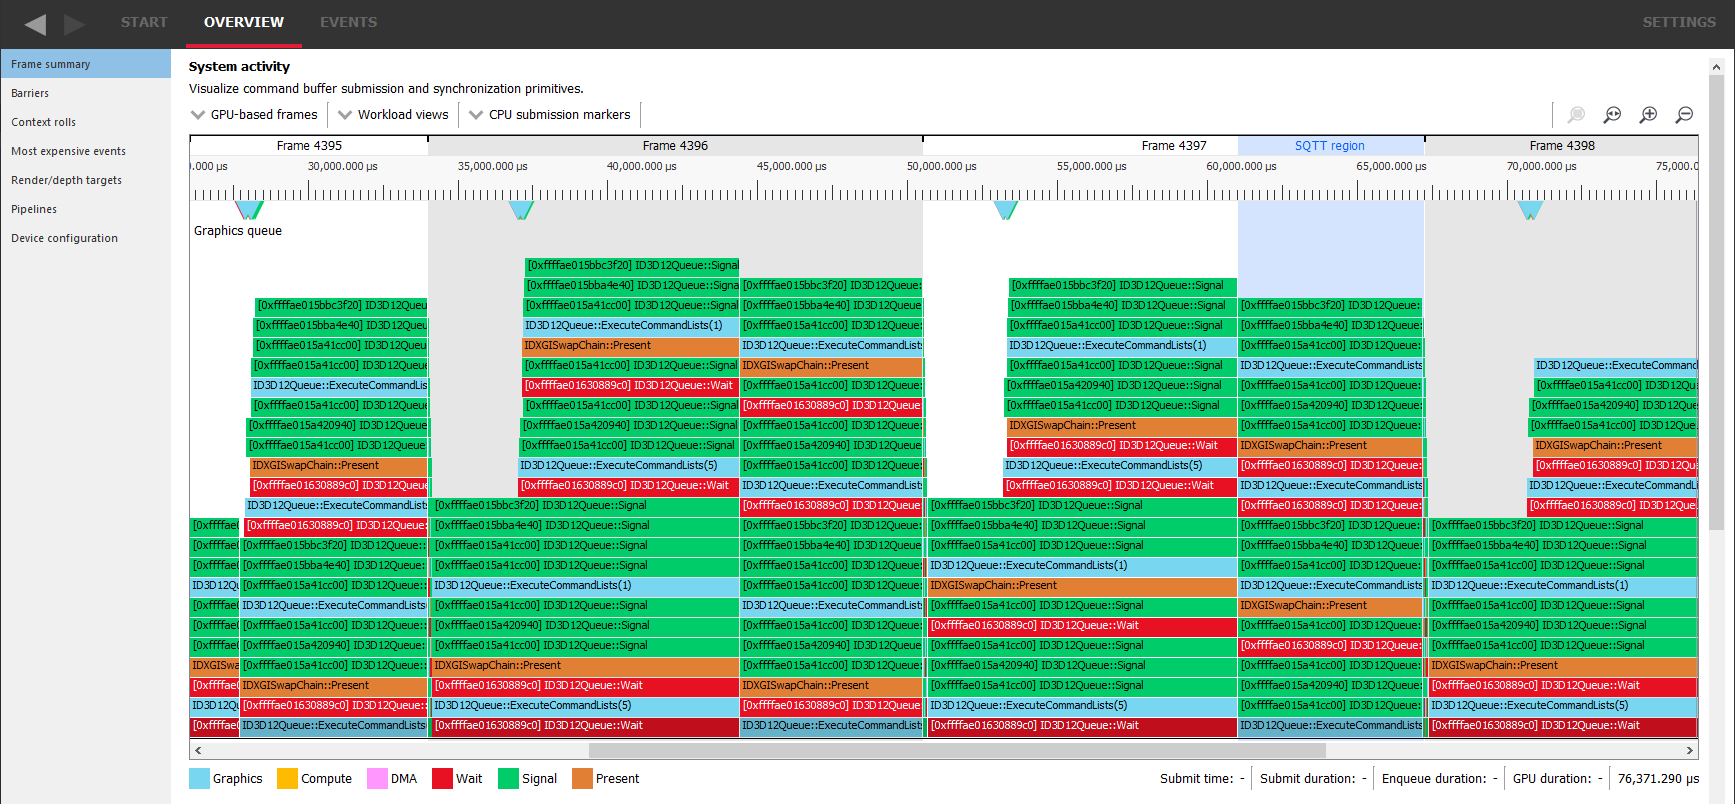
It may look scary at first glance, but don’t worry and stay with me. I will explain everything step-by-step. I don’t know if there is any name for this type of graph, so let’s call it a “queue graph” because it shows a queue of tasks submitted to the graphics card and executed by it.
The horizontal axis is time, passing in the right direction at a constant pace. The vertical axis is the queue, with the front of the queue on the bottom and items enqueued later stacked on top.
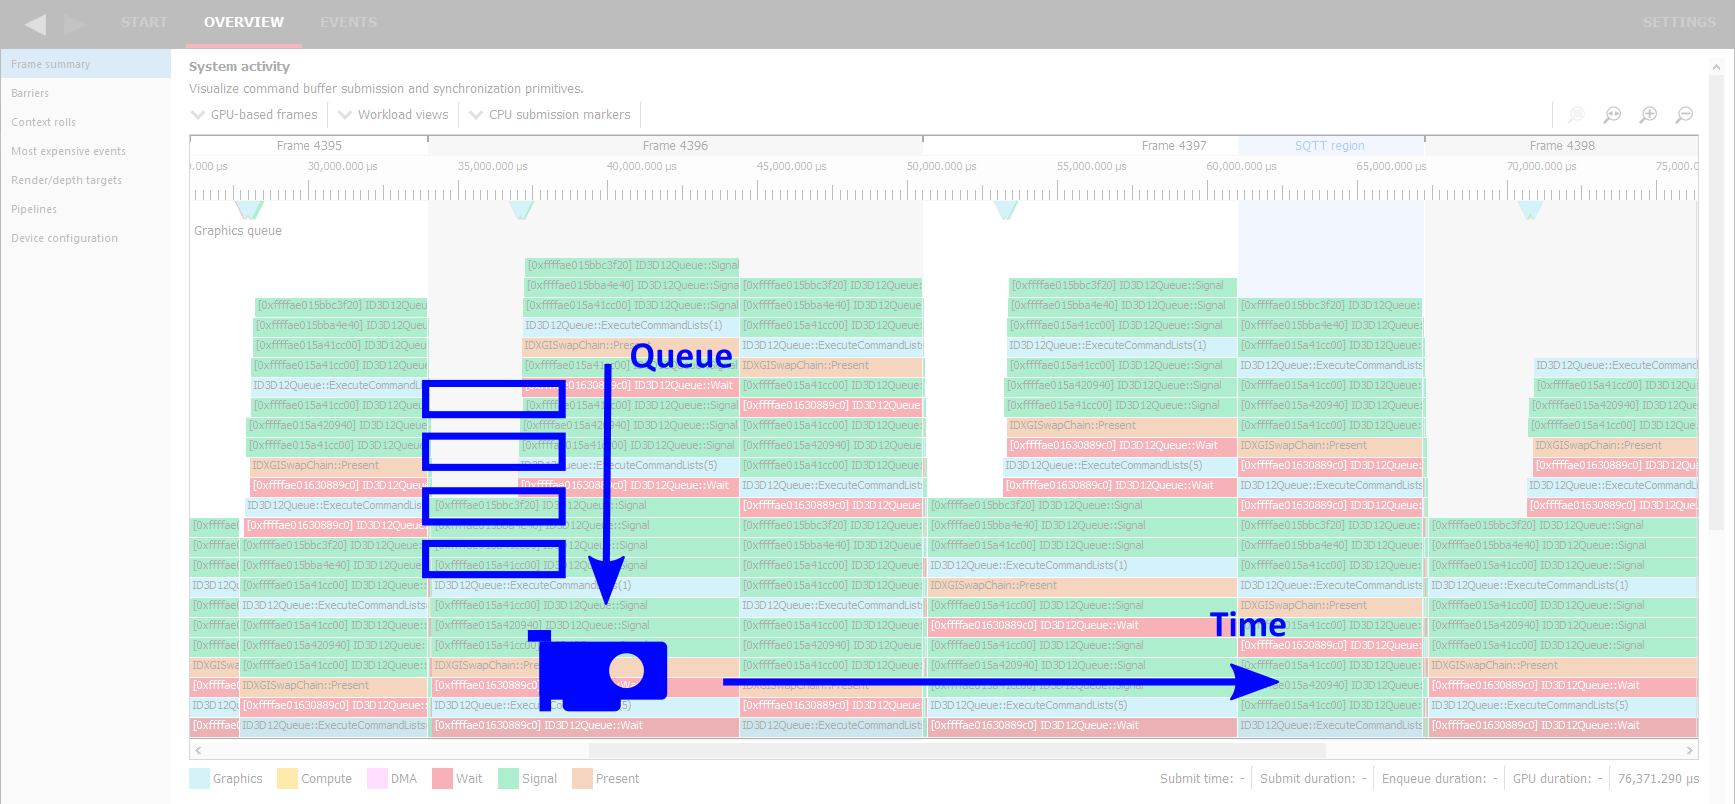
At each point in time, the item on the bottom row is the one currently executing on the GPU. Everything above this row is waiting for its turn. It means that from the graph we can see and measure when a certain piece of work (like D3D12 ExecuteCommandLists call in this example) was enqueued, when it started executing. and how long it took to execute it. The width of the bottom block represents the amount of time that was required to execute. Note that the work item going “down the stairs” has no meaning in itself. It just means something in front of it finished, so the queue ahead is shorter. Only when it ends up in the bottom row, it really starts executing.
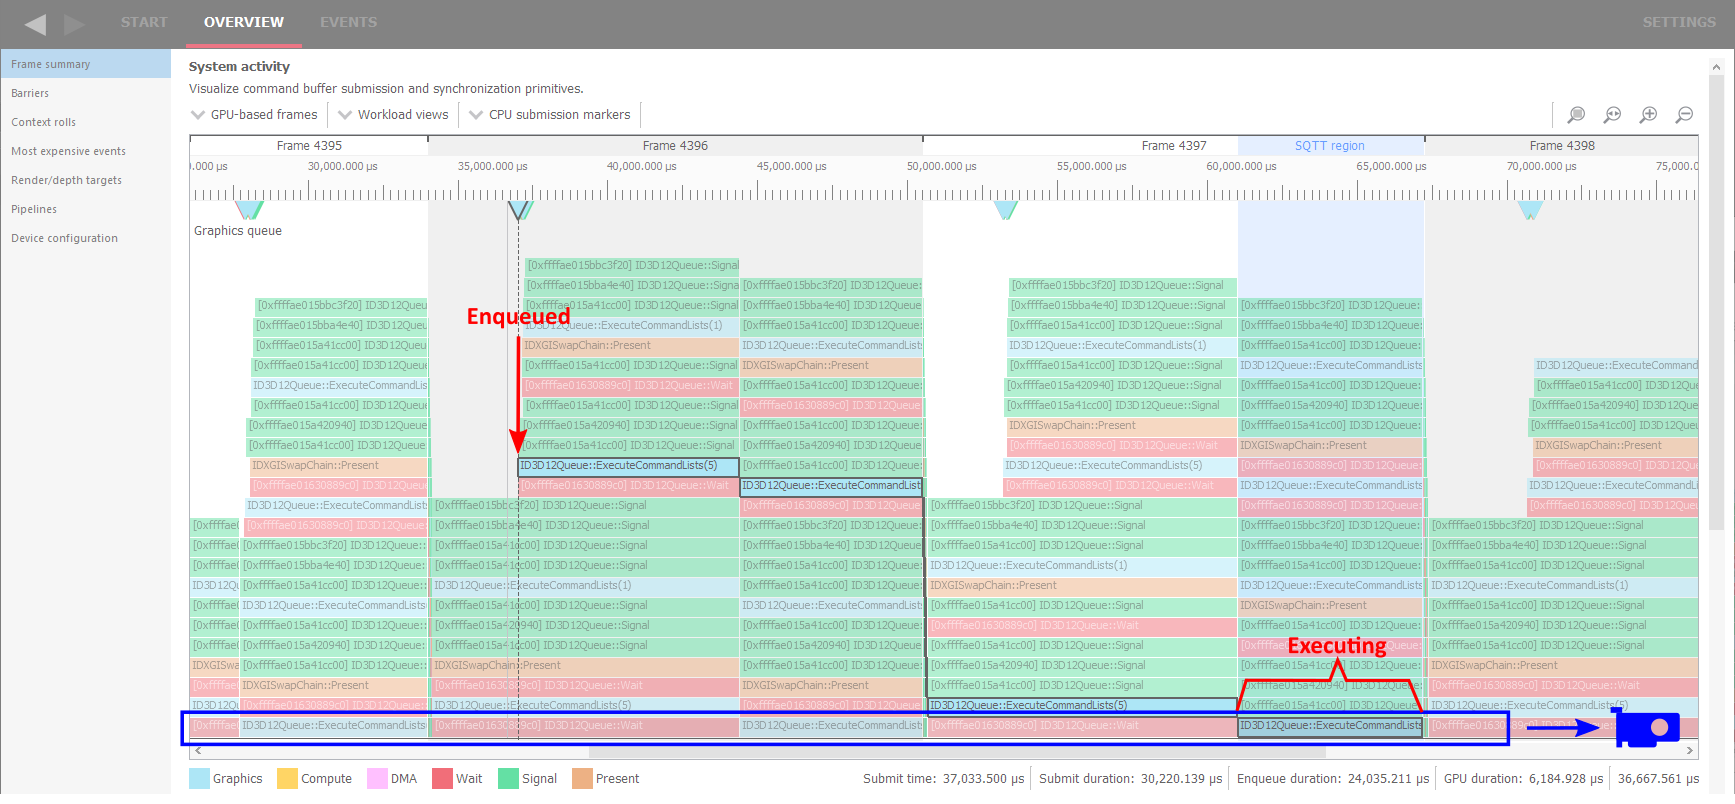
Another thing to note is that some items wait in the queue but don’t take any significant time to execute. These are simple and quick commands, like the green call to the Signal function marked here. When everything in front of it completes, it also completes in no time.
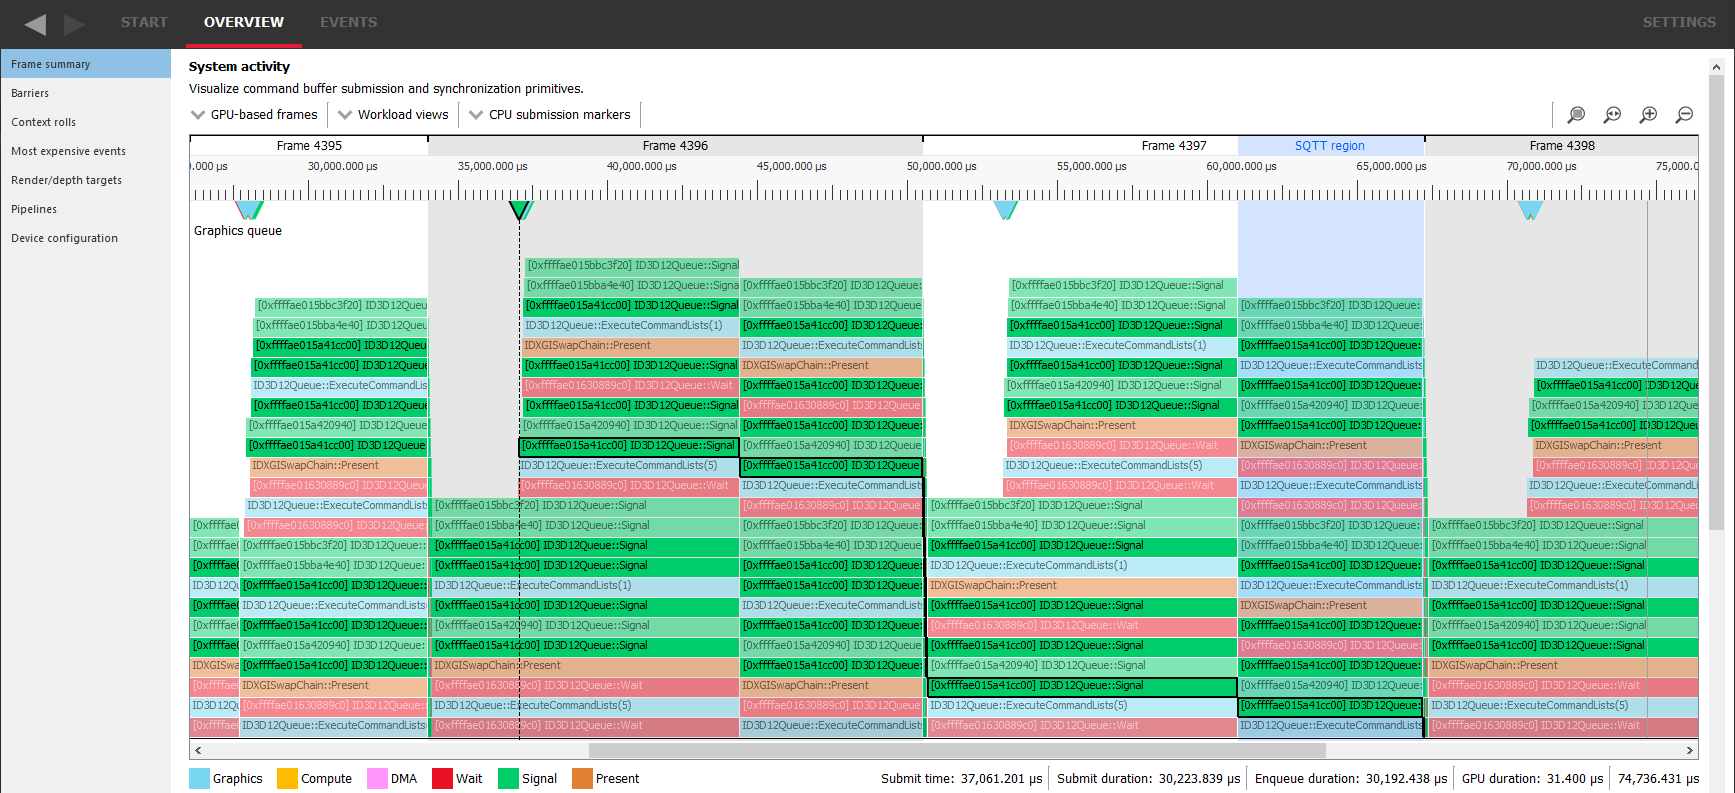
We can make more observations from this graph if we consider the fact that games work with frames, each frame executes commands to draw the whole image from clearing background through 3D objects to UI and finishes with a call to the Present function, marked here in brown color. By looking for this type of item, we can conclude when a new frame begins. For example, in the point “A” the GPU is still executing commands of frame N, while we have all commands for the next frame N+1 enqueued, including its next Present, and also the commands for frame N+2 are stacking up at the end of the queue. Thus, we can expect the game to have 2 frames of latency in displaying the image.
The same type of graph is used by GPUView – a free tool from Microsoft® that can record and display what is happening in the system on a very low level. (The linked article is very old – right now the way to install the tool is to grab Windows® Assessment and Deployment Kit (Windows ADK) and a convenient UI for it is UIforETW). As you can see here, both “3D Hardware Queue” of my graphics card and software “Device Context” of a running game show packets of work submitted for rendering.
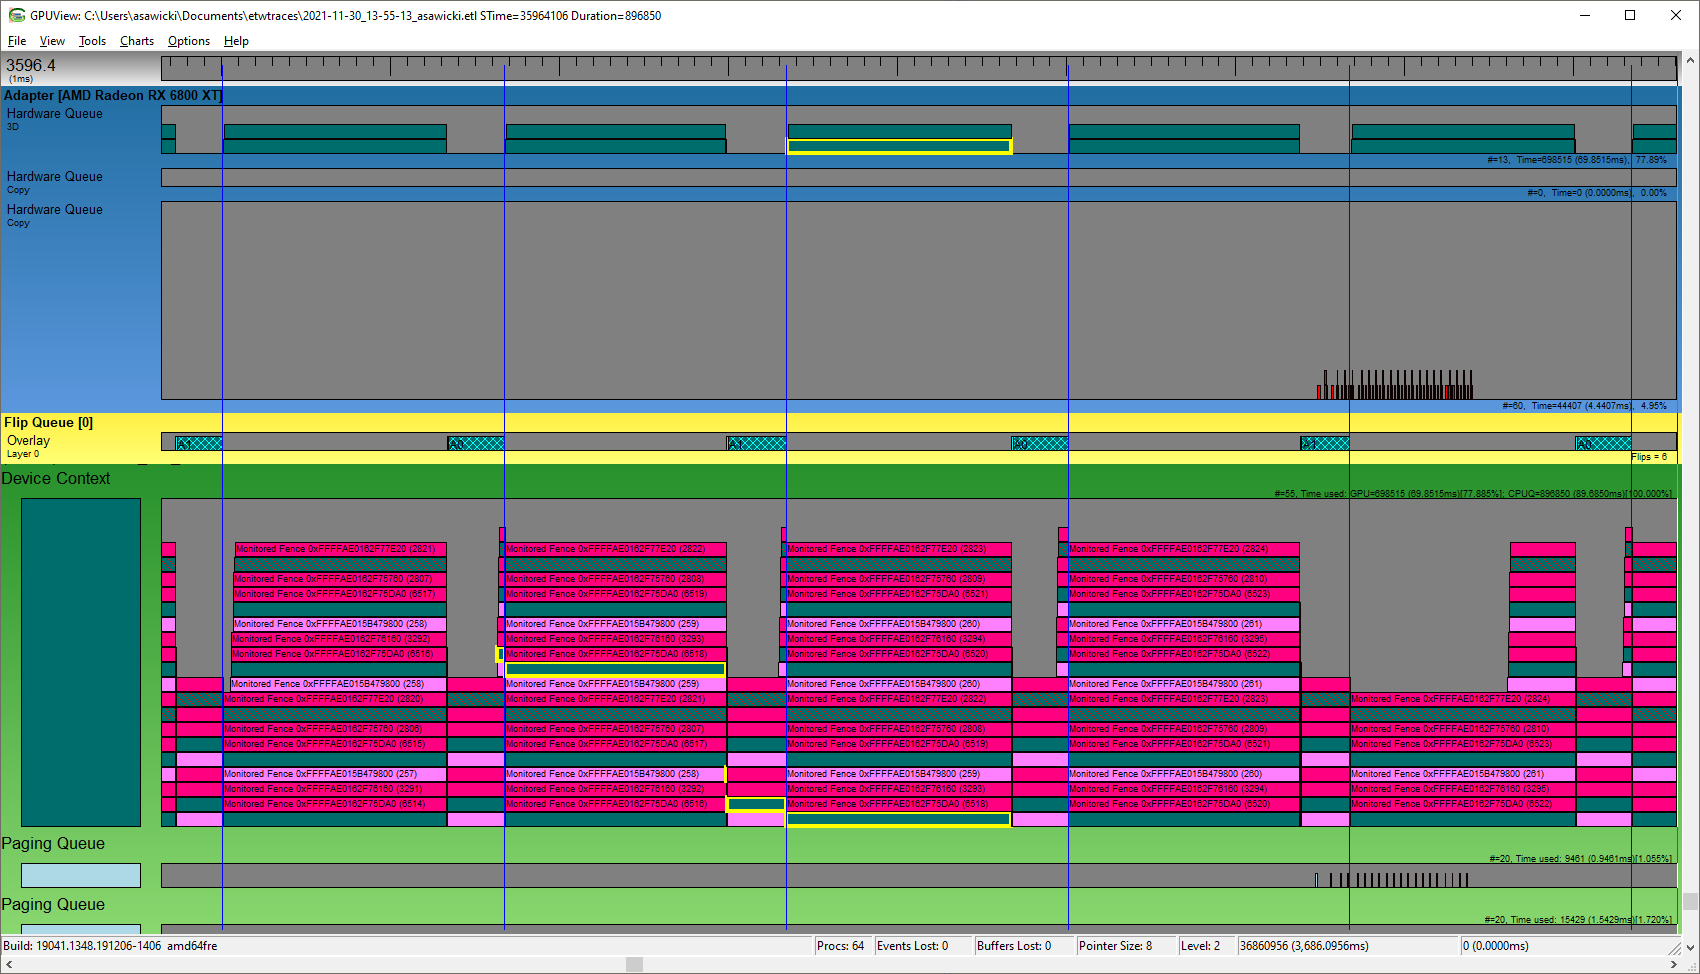
One important piece of information that we can extract from this graph is that GPU is not busy 100% of the time. GPUView actually shows the number on the right, which is 77.89% for the current view. It means the game is not GPU-bound. Reducing graphics quality settings would not increase framerate (FPS). This often happens when the game does some heavy computations on the CPU or when it reaches 60 FPS and we have V-sync enabled. Here we have the latter case, as we can see moments of vertical synchronization marked as blue lines, while rendering each frame seems to be blocked until that moment.
Note the graph described here is not the same as flame graphs or flame charts, which show a hierarchy of nested things, not a queue. For example, a call stack of function calls.
This blog was originally posted on asawicki.info, where you can find more blog posts on similar subjects.