Meet AMD FSR™ Technologies
Integrate our brand-new "Redstone" neural rendering technologies to take your game to new levels of fidelity and performance.


Integrate our brand-new "Redstone" neural rendering technologies to take your game to new levels of fidelity and performance.

The AMD FSR Redstone SDK enables developers to integrate neural rendering technologies, including ML-powered upscaling, frame generation, denoising, and radiance caching, for…
AMD FSR 'Redstone' SDK 2.1 enables developers to integrate FSR features into games with easy-to-use APIs and access to advanced neural rendering technologies.
Download the AMD FSR plugin for Unreal Engine, and learn how to install and use it.

AMD Schola v2 is a major update to the open-source reinforcement learning plugin for Unreal® Engine 5, offering significant improvements in capabilities, performance, and ease of…
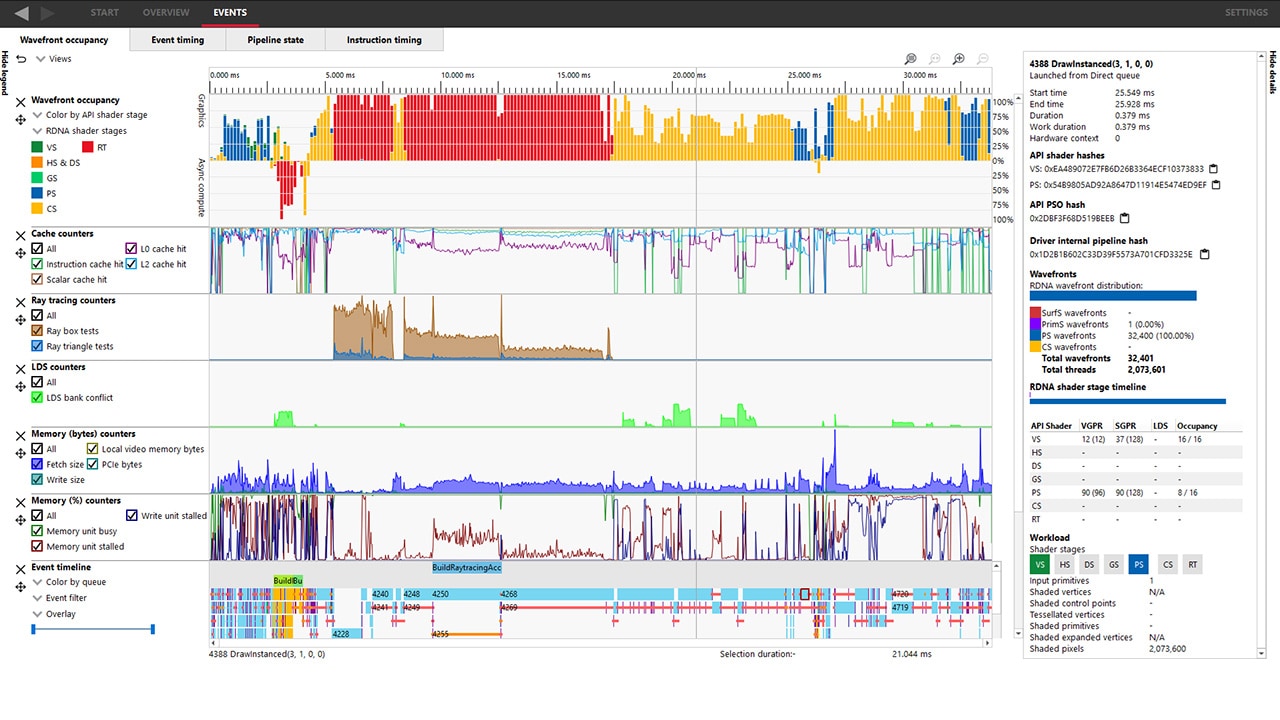
The latest version of the RDTS is designed to empower developers with enhanced capabilities for profiling, analyzing, and optimizing their GPU applications.
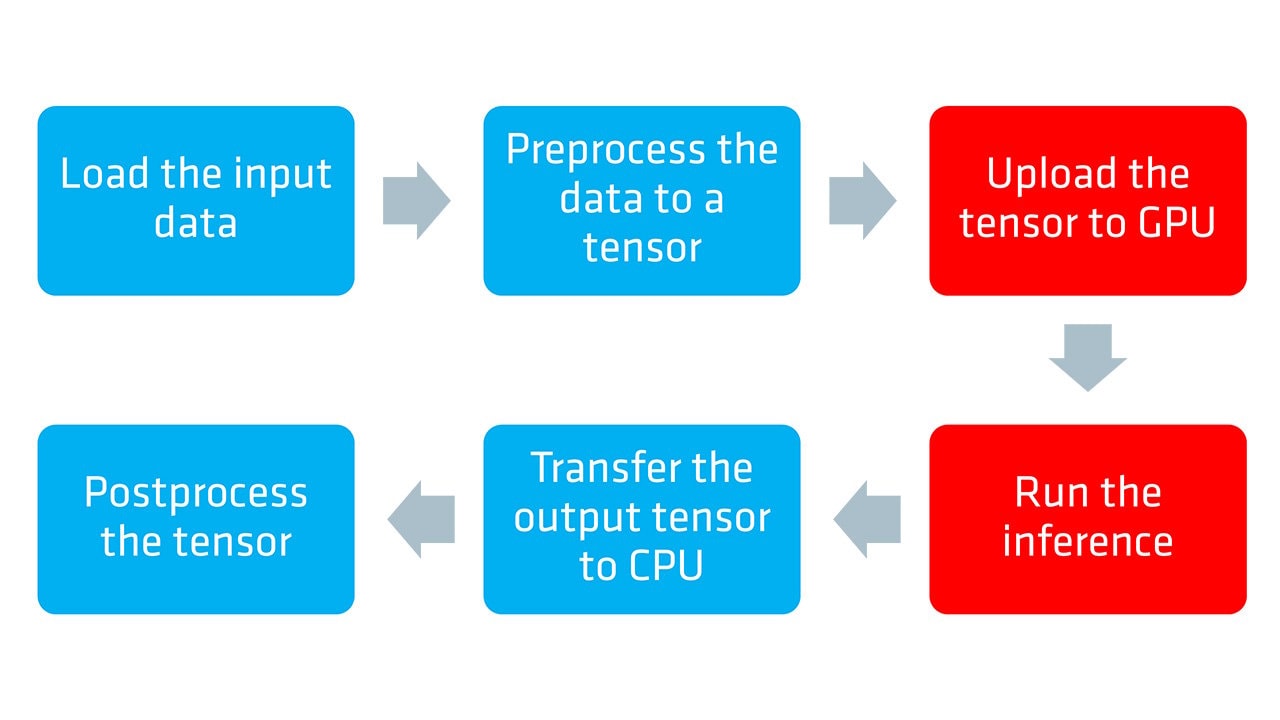
Learn how to optimize neural network inference on AMD hardware using the ONNX Runtime with the DirectML execution provider and DirectX 12 in the first part of our guide.

AMD GI-1.2, our real-time Global Illumination solution, is available now as part of the AMD Capsaicin Framework v1.3.
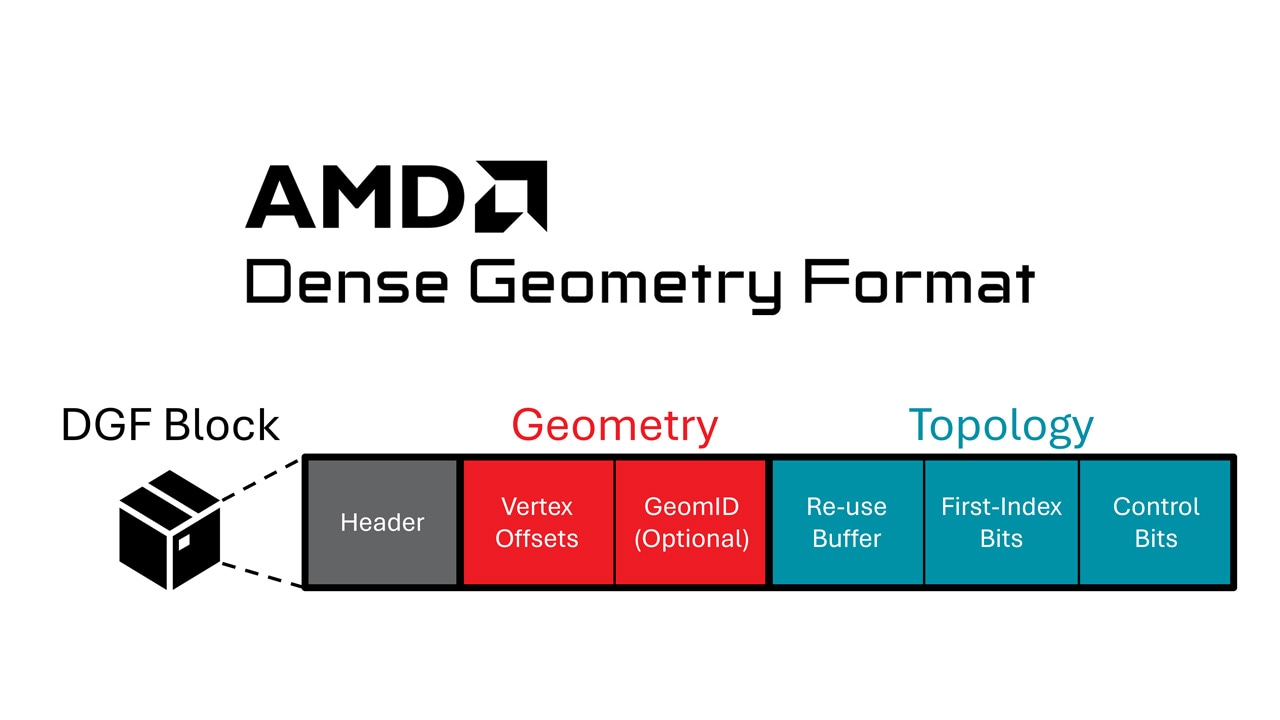
The AMD DGF SDK has been updated with improvements and new features, including the addition of an animation-aware encoding pipeline.

It is often difficult to know where to start when taking your first in the world of graphics. This guide is here to help with a discussion of first steps and a list of useful…
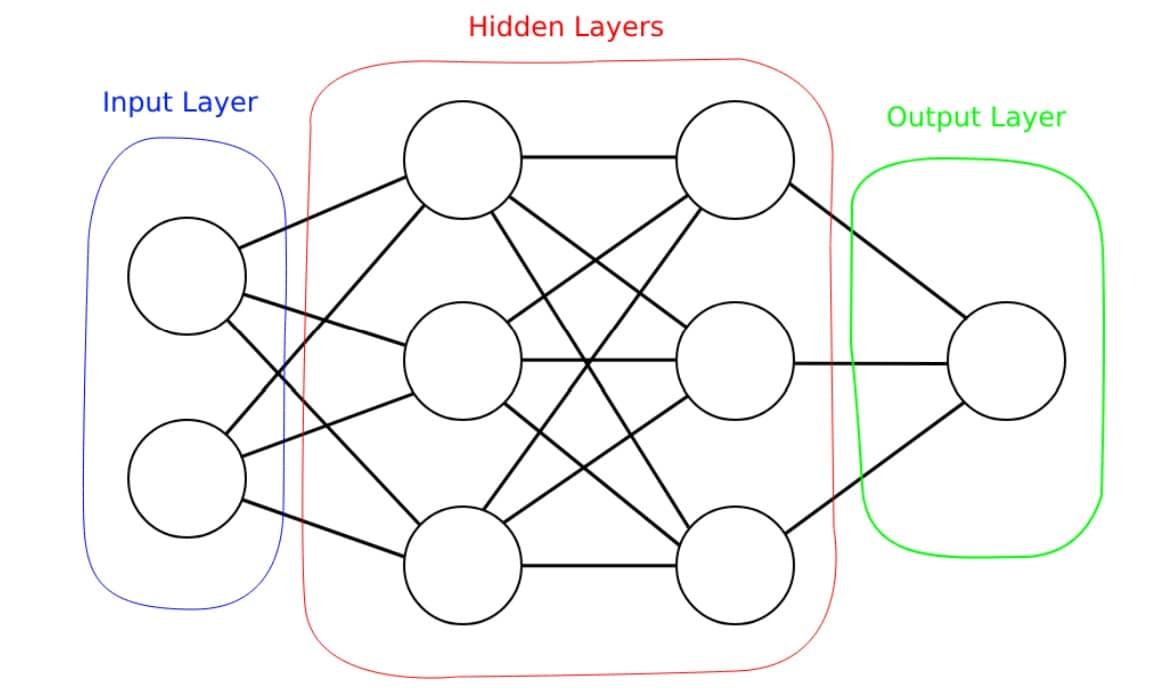
If you're a graphics dev looking to understand more about deep learning, this blog introduces the basic principles in a graphics dev context.
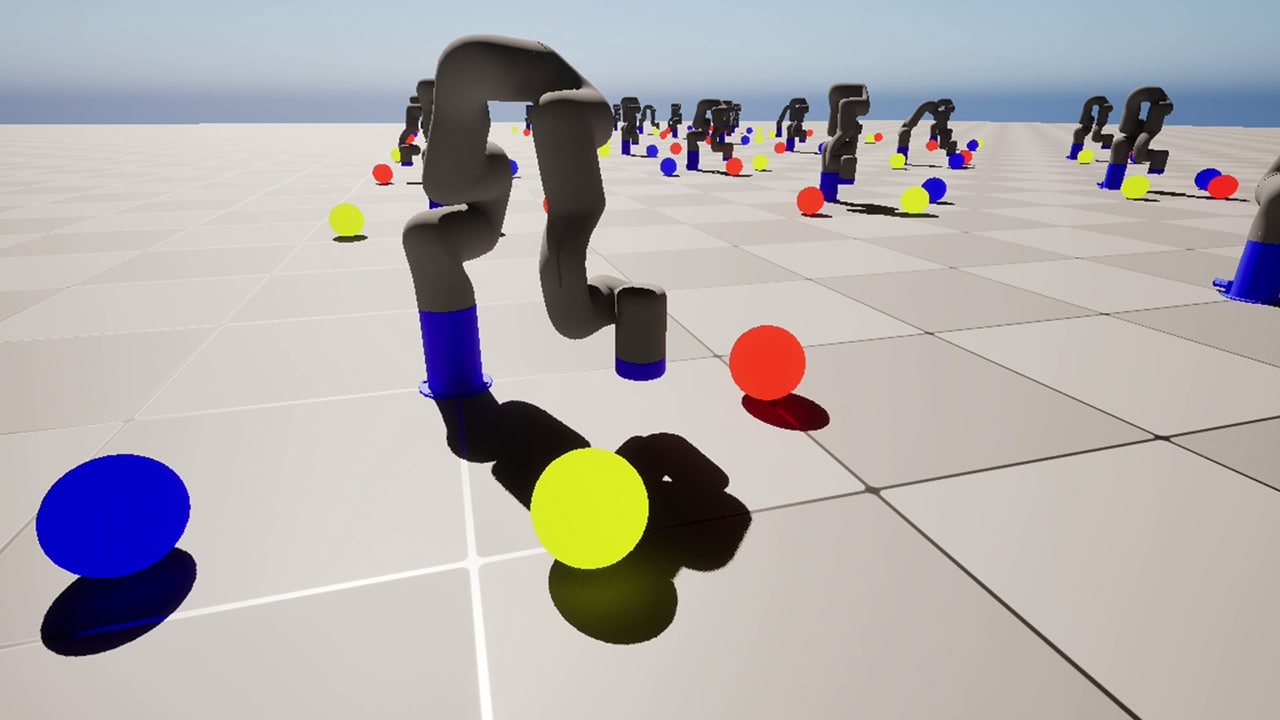 | Training an X-ARM 5 robotic arm with AMD Schola and Unreal EngineTrain a robot arm with reinforcement learning in AMD Schola using Unreal® Engine, progressively increasing task complexity to adapt to changing conditions. |
 | AMD FidelityFX Super Resolution 4 plugin updated for Unreal Engine 5.7Our AMD FSR 4 plugin has been updated to support Unreal® Engine 5.7, empowering you to build expansive, lifelike, and high-performance worlds. |
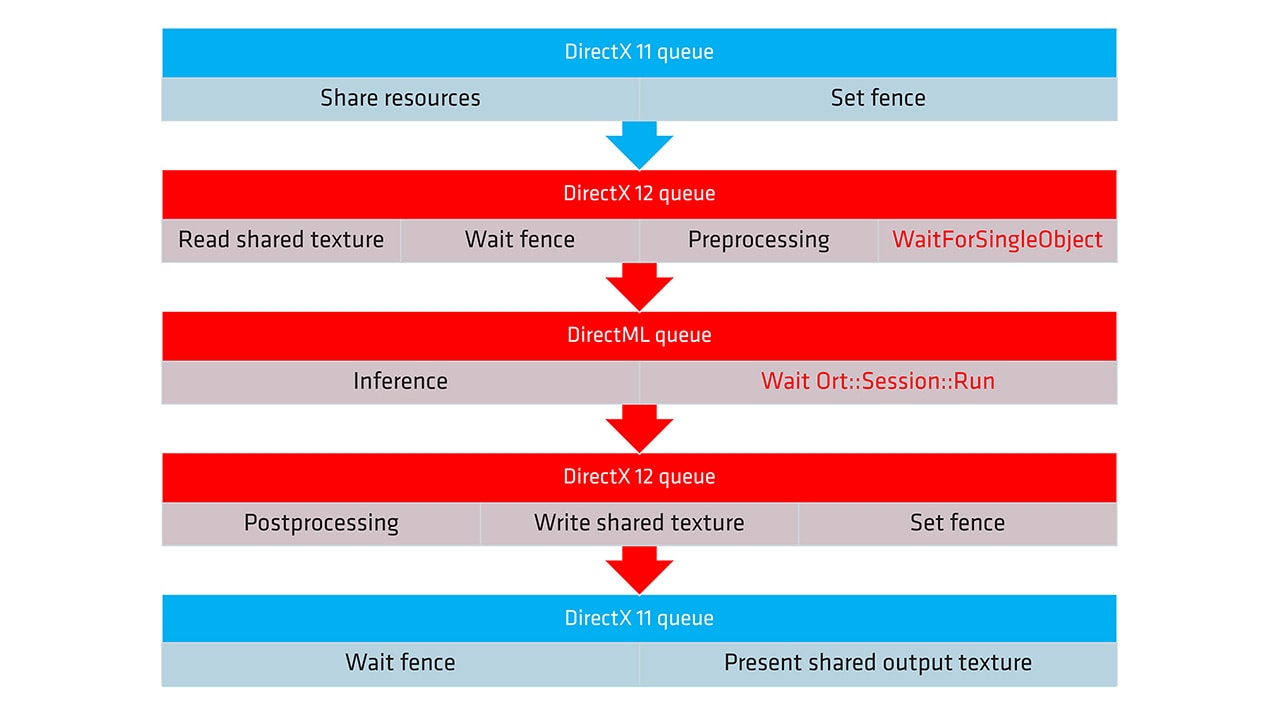 | ONNX and DirectML execution provider guide - part 2Learn how to optimize neural network inference on AMD hardware using the ONNX Runtime with the DirectML execution provider and DirectX 12 in the second part of our guide. |
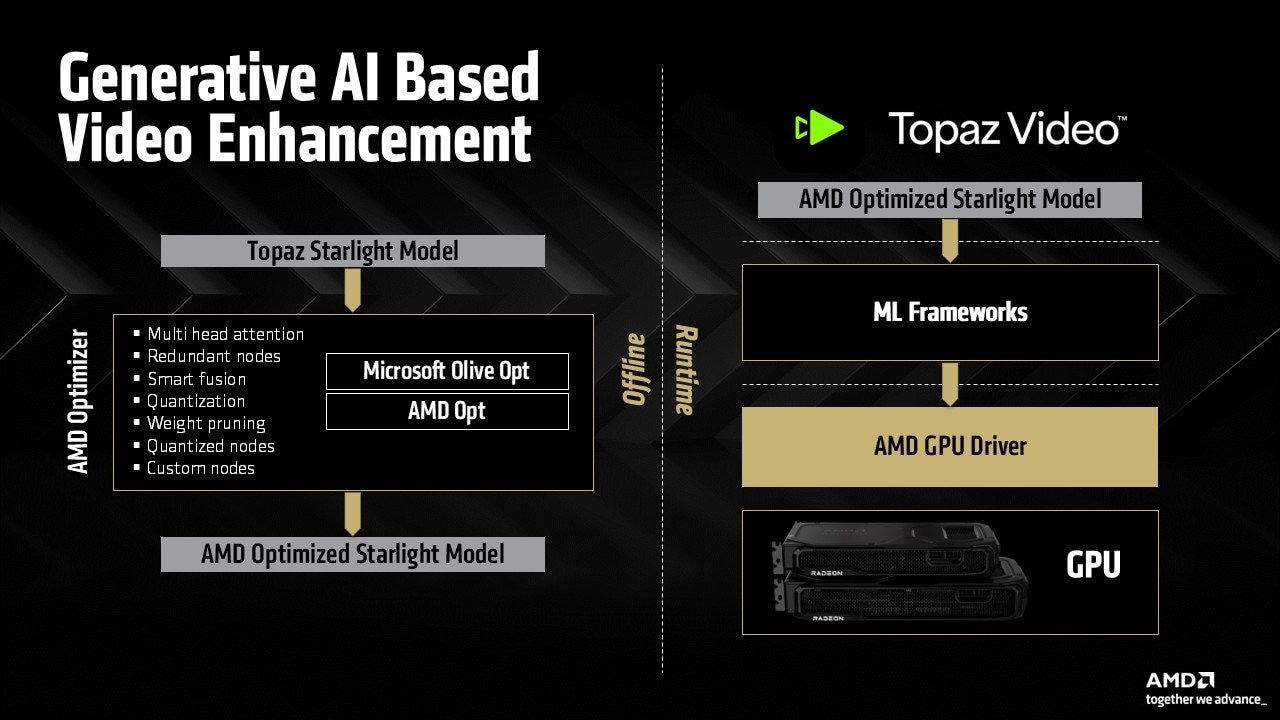 | Topaz Labs brings generative AI video enhancement to AMD Radeon GPUsTopaz Labs and AMD collaborate to bring generative AI video enhancement to client devices with AMD Radeon™ GPU technologies, enabling real-time performance and significant gains in video processing workflow. |
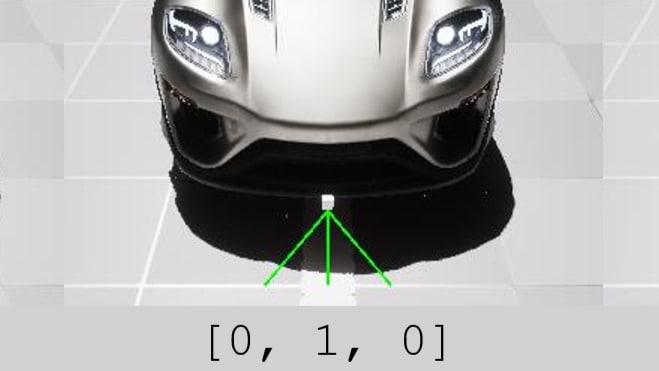 | Sim-to-real in AMD ScholaReplicating a physical line-following device in Unreal® Engine and training it with reinforcement learning using AMD Schola. |
 | A beginner's guide to deploying LLMs with AMD on Windows using PyTorchGet started running LLMs with PyTorch on Windows using AMD consumer graphics hardware. |
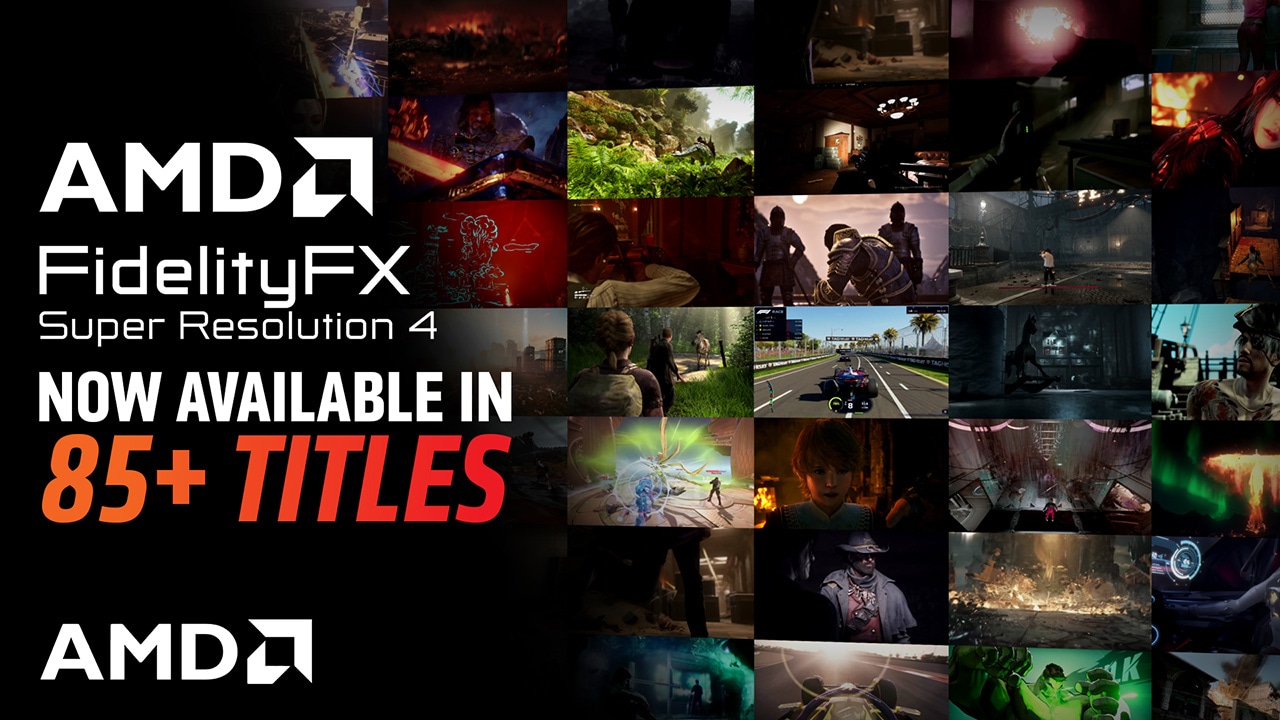 | AMD FSR 4 now available in over 85 gamesAMD FidelityFX™ Super Resolution 4 is our transformative neural rendering technology now available in over 85 games. |
 | AMD FidelityFX SDK 2.0 launches our neural rendering technologies for developersLearn about the launchpad for our ML-based rendering technologies, inc. AMD FSR 4 and upcoming FSR Redstone features. |
 | AMD FidelityFX Super Resolution 4 now available on GPUOpenDiscover AMD FSR 4, our cutting-edge ML-based upscaler (with UE5 plugin) which delivers significant image quality improvements over FSR 3.1. |
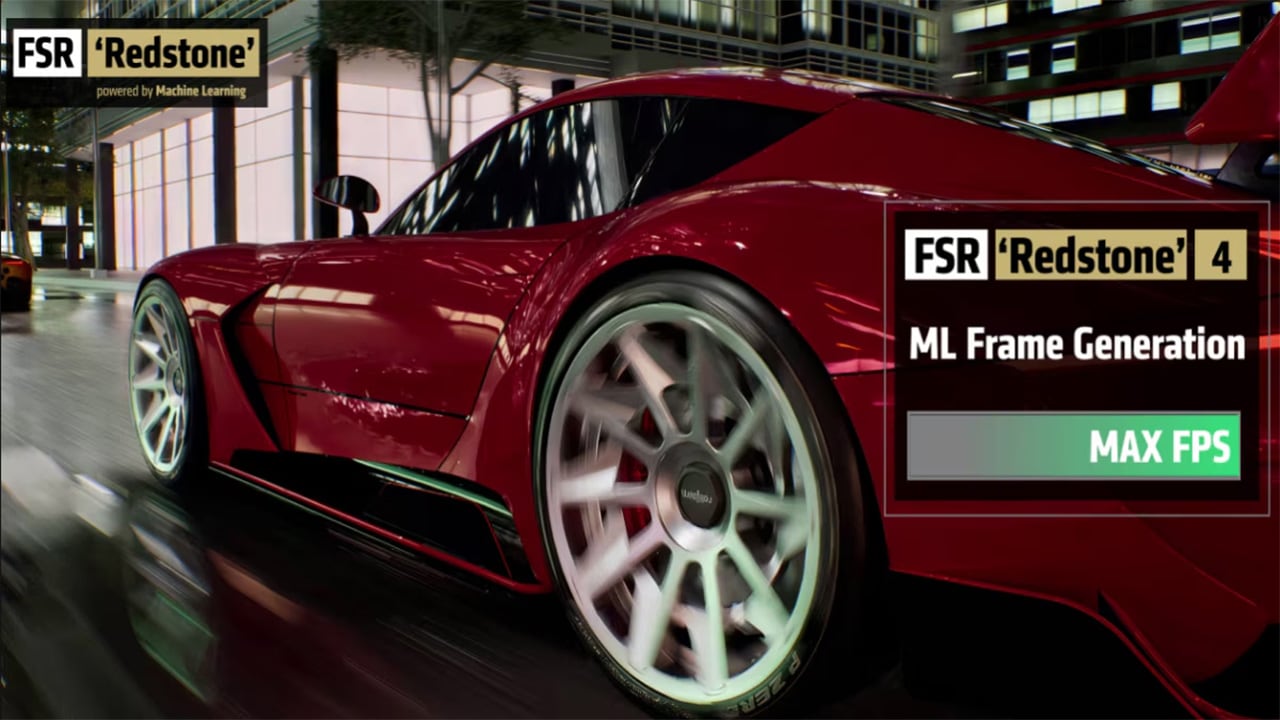 | Get ready for FSR Redstone with AMD FSR 3.1.4 and our new UE 5.6 pluginIntegrate AMD FSR 3.1.4 to get ready for FSR Redstone, updated Unreal Engine plugin now available. |
 | AMD releases Vulkan support for Dense Geometry FormatWe’ve released a provisional Vulkan® extension for AMD Dense Geometry Format (DGF), our block-based geometry compression technology. |
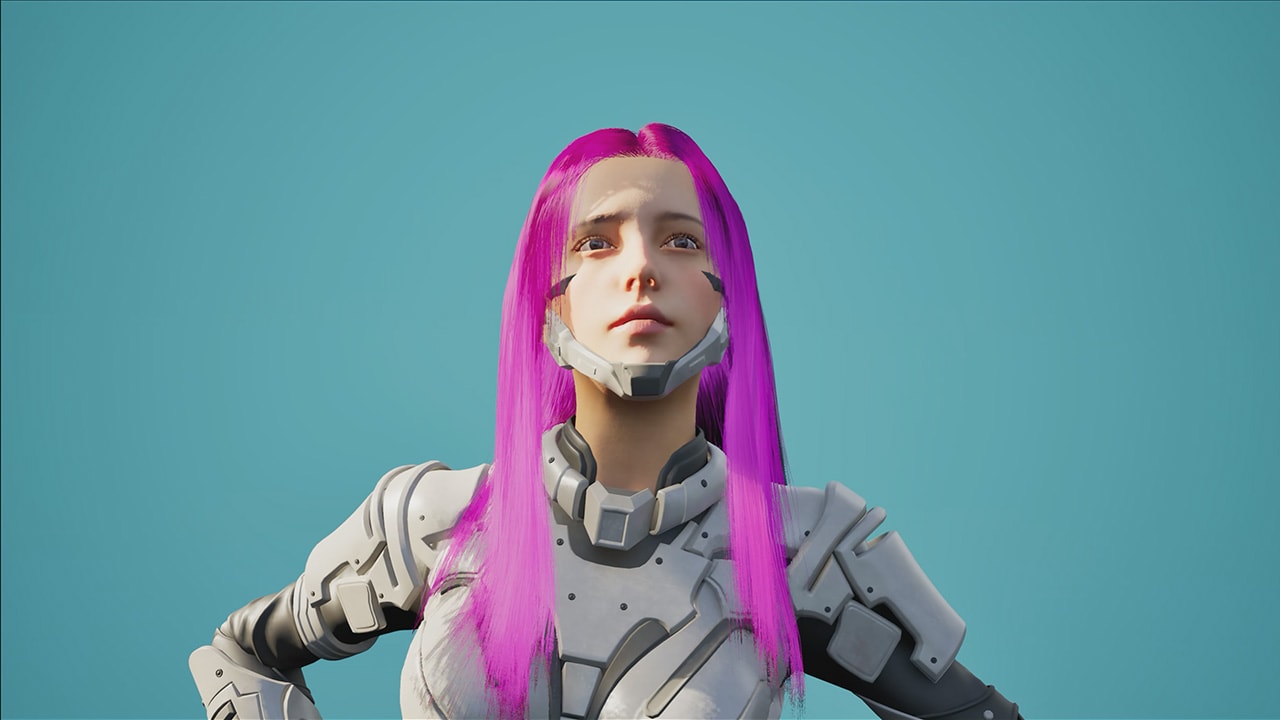 | AMD TressFX 5.0 for Unreal Engine 5 is now availableAMD TressFX 5.0 has been updated for high-quality simulation and rendering of realistic hair and fur in Unreal Engine 5. |
The AMD FSR SDK 2.1 is the launch vehicle for our ML-based neural rendering technologies. It includes AMD FSR Upscaling, our cutting-edge ML upscaler, plus AMD FSR Frame Generation for smoother gameplay, AMD FSR Ray Regeneration for noise-free ray tracing, and AMD FSR Radiance Caching for efficient real-time global illumination - all using hardware-accelerated features of AMD RDNA™ 4 architecture.
The original AMD FidelityFX SDK v1.1.4 contains our series of optimized, shader-based features aimed at improving rendering quality and performance.
Building something amazing on DirectX®12 or Vulkan®? How about Unreal® Engine?
Obviously you wouldn't dream of shipping without reading our performance and optimization guides for Radeon, Ryzen, or Unreal Engine first!

We aim to provide developer tools that solve your problems.
To achieve this, our tools are built around four key pillars: stability, performance, accuracy, and actionability.