Radeon™ Rays
The lightweight accelerated ray intersection library for DirectX®12 and Vulkan®.
This series of blogs will walk readers through the analysis of the problems encountered in actual projects, thus helping them to better understand the CPU performance optimization of programs. We hope this series will be helpful to your projects.
I have encountered a very simple task in a project I’ve been involved in: how can I get the maximum of three variables faster? Such simple numerical operations are common in both graphics and scientific computing. In C++, for example, there are three solutions for this task. Which is faster?
#define max(a,b) (((a) > (b)) ? (a) : (b))const T& std::max( const T& a, const T& b )T std::max( std::initializer_list<T> ilist )The answer is unknown and depends on the data and the CPU. Therefore, the test scenario should be constrained first.
The compiler generates different assembly instructions for different data types. The integer and floating point instructions, for example, are quite different. As the task arises from graphics programming, the data type is a 32-bit float type.
Compiler developers take great care when optimizing the code generated by compilation. The compiler generation varies from vendor to vendor, making it necessary to identify the compiler. Due to the popularity and ease of use of Windows 10, I chose Visual Studio 2022 as the development environment for this example, version number “17.8.6”. The compiler version number is “19.38.33135”. The compilation type is “x64 RelWithDebInfo”. The OS version number is “10.0.19045.3930”.
Last but not least, we need to identify the CPU, because architectures are constantly being updated, and different CPUs may behave differently when executing the same assembly instructions. And because of the strong dependence on hardware, the CPU determines the performance profilers that are usable. The CPU I use is an AMD 7900X3D, so the performance profiler I use is AMD μProf, version number “4.1.396”.
Once the constraints are complete, we can start building the benchmark, which needs to meet the following conditions:
The random number generation of C++ 11 can meet our demands. And the 10 million 32-bit floating-point numbers are enough to ensure that the accurate performance data can be obtained. Don’t forget to fix the random seed to ensure that the same data sequence is generated.
using T = float;
std::default_random_engine eng(200);std::uniform_real_distribution<T> distr;
std::vector<T> buf(10000000);for (auto& i : buf) { i = distr(eng);}The function test is relatively simple. What we need to do is to traverse the entire random array, and then use different methods to get the maximum value of 3 numbers at a time. Then we time the process. Adding noinline is a feasible option to prevent the compiler from unrolling functions and to facilitate debugging.
template <typename T, int P>__declspec(noinline) T test(const std::vector<T>& vec) {    T result = 0;
    auto start = std::chrono::steady_clock::now();    for (auto i = std::cbegin(vec) + 2, end = vec.cend();        i != end; i = std::next(i)) {        if (P == 1) {            result = max(*(i - 2), max(*(i - 1), *i));       } else if (P == 2) {            result = (std::max)(*(i - 2), (std::max)(*(i - 1), *i));       } else {            result = (std::max)({ *(i - 2), *(i - 1), *i });        }    }    const auto end = std::chrono::steady_clock::now();    std::cout        << "Slow calculations took "        << std::chrono::duration_cast<std::chrono::microseconds>(end - start).count()        << " microseconds" << std::endl;
return result;}Our next step is the performance test. Remember to run the test several times and then average the data. It’s obvious that std::max(a, b) is the fastest, while the max macro is the slowest, and std::max(ilist) is somewhere in between.
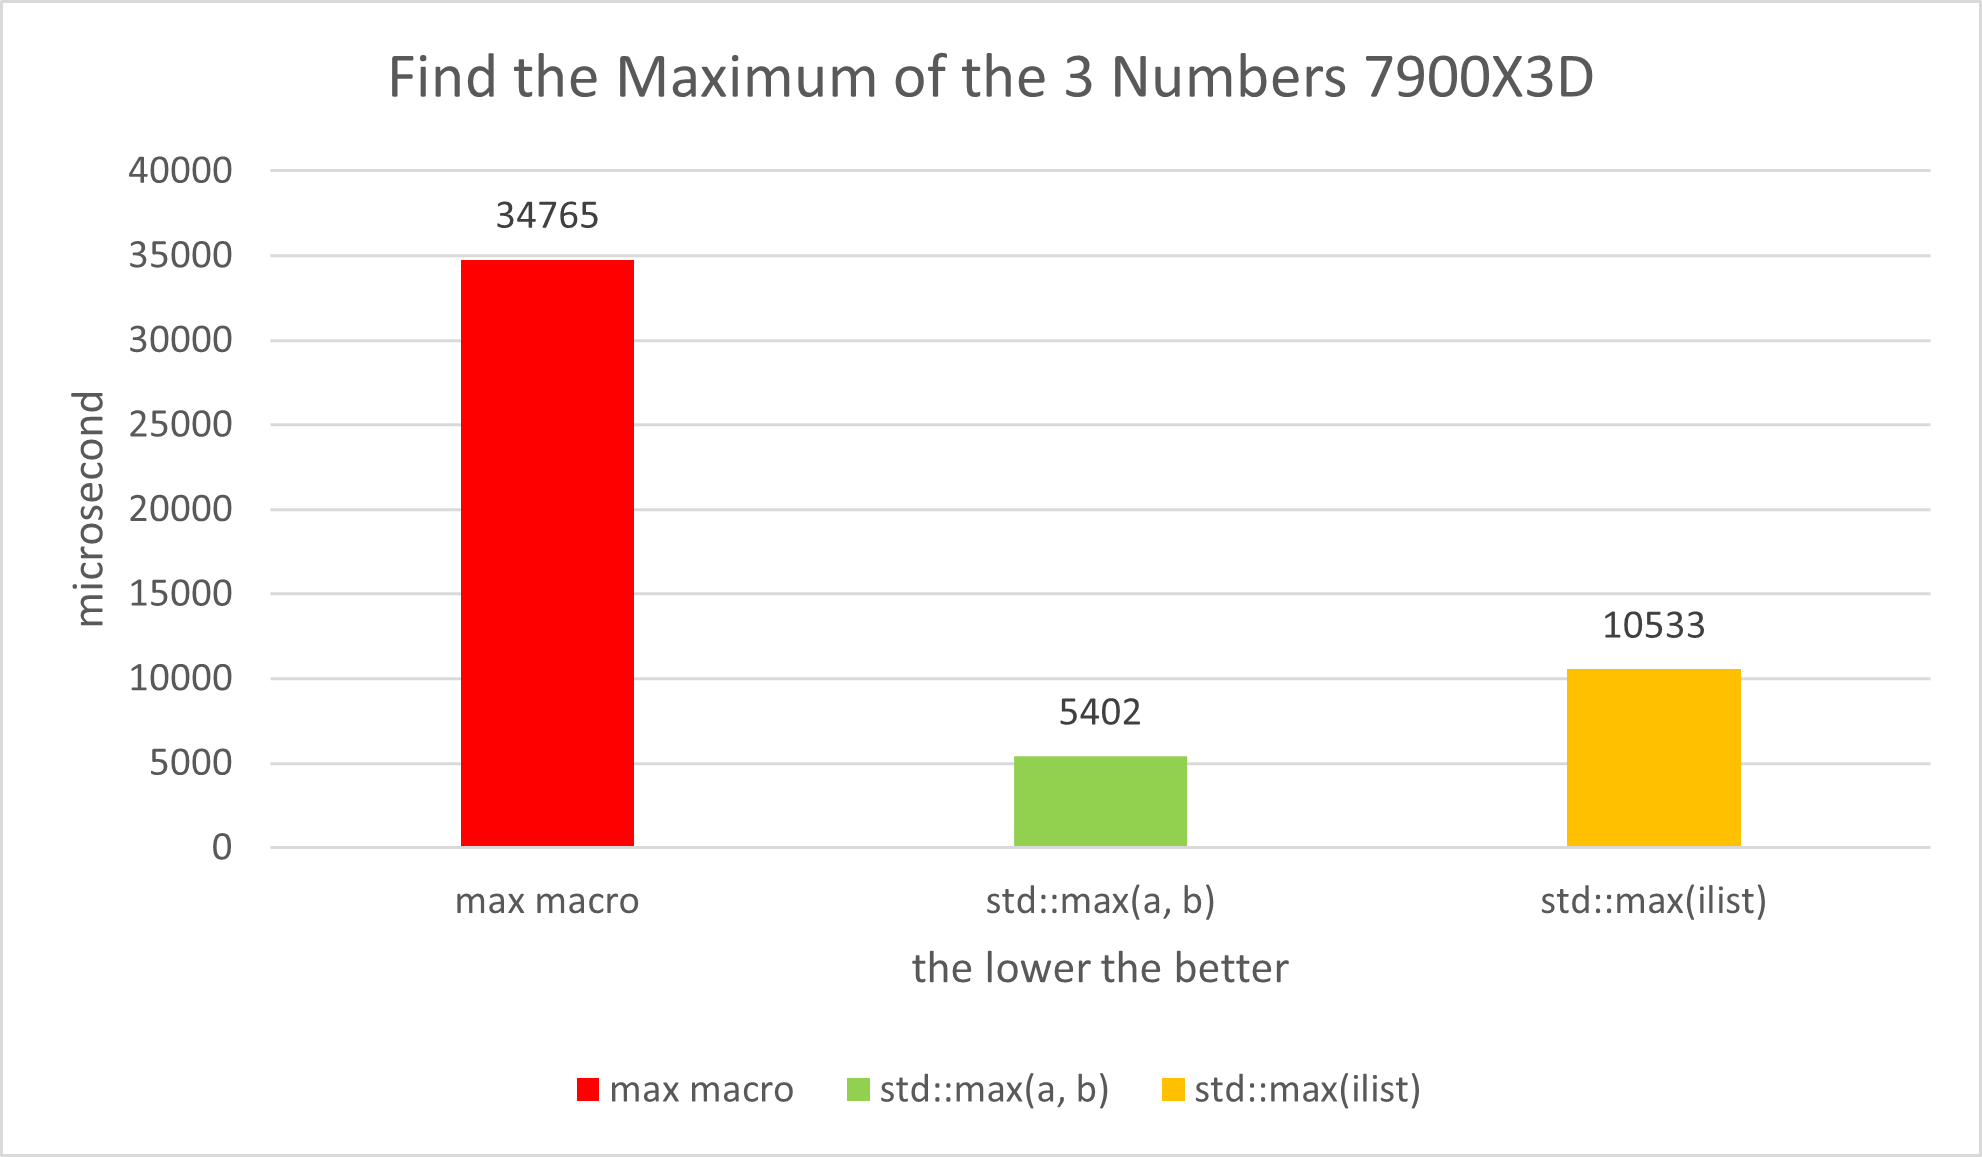
Next comes the phase of analyzing the problem, the key of which lies in the assembly code and the PMC counters in the performance profiler.
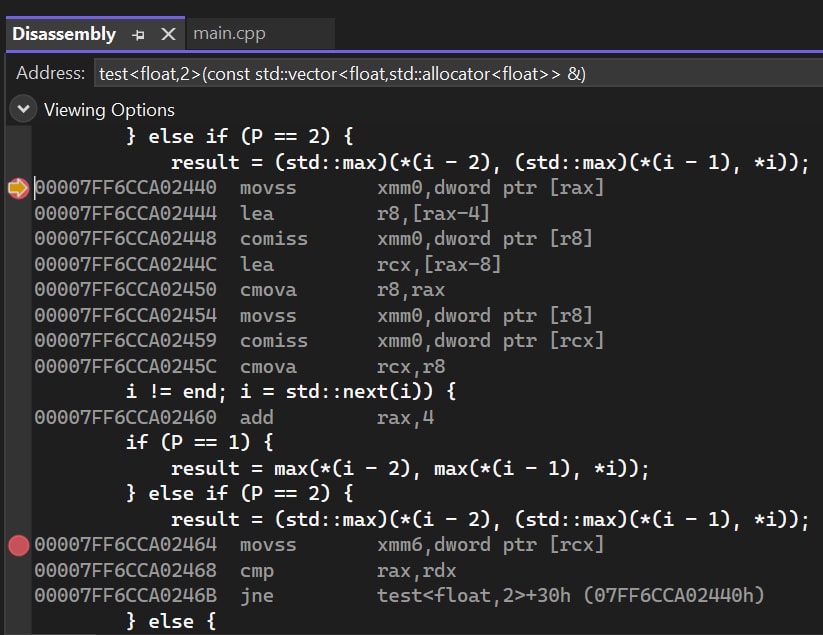
First, let’s take a look at the assembly code of std::max(a, b). It’s basically fine. All branch operations are completed by the “cmov” series of instructions, which can effectively avoid branch prediction failure.
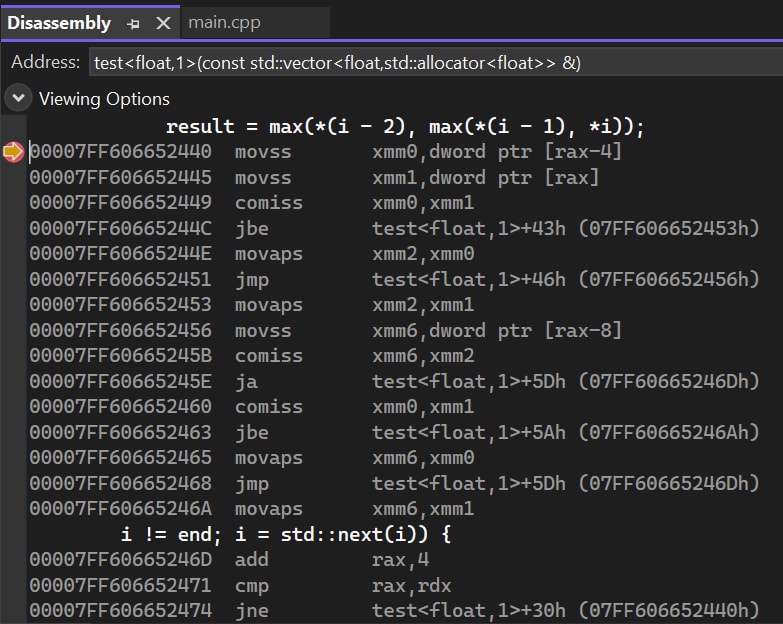
Next, let’s check the max macro assembly code. We can see that the compiler has generated several conditional jump instructions. Due to the randomness of the input data, the branch prediction module of the CPU may not be able to correctly predict the branch, resulting in a failure of branch prediction.
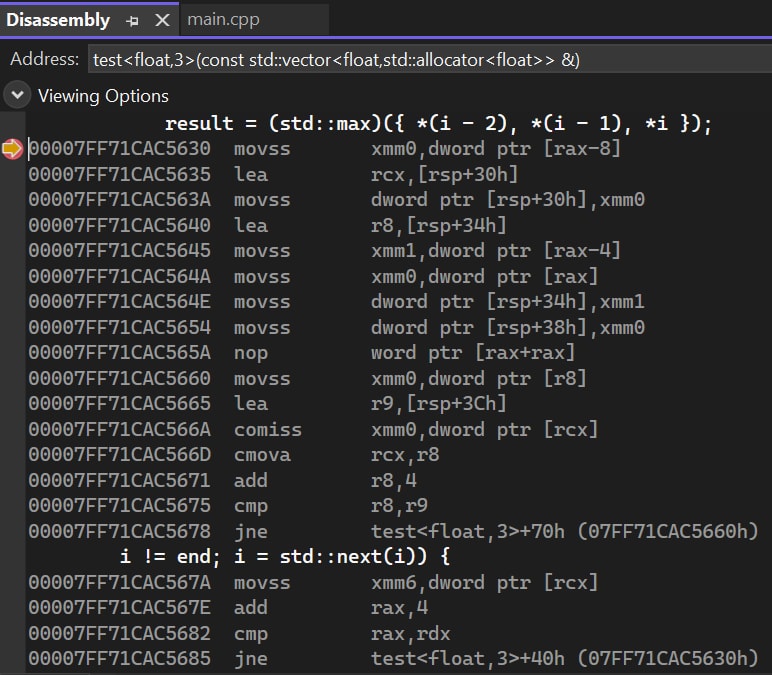
Finally, there is the std::max(ilist) assembly code. Some extra data copy operations and an inner loop can be spotted. More operation makes it less possible to be fast. However, the code is fine.
Things seem to be clear. The only problem that needs further analysis is the max macro. We need to figure out whether the slowdown is due to the branch prediction failure or other reasons.
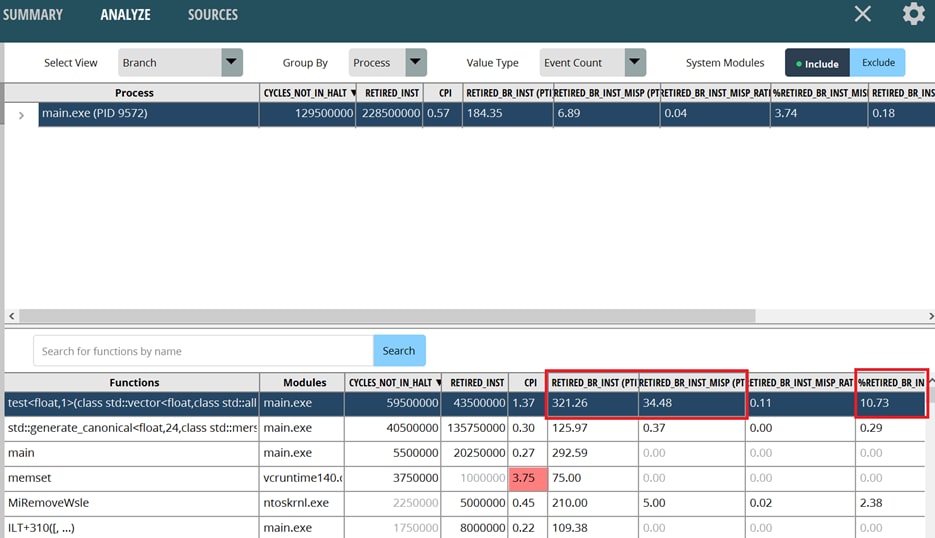
The next step is to analyze the PMC using the performance profiler, using Assess Performance (Extended) for the options set. After the run, switch to the ANALYZE page, and then switch to the Branch view to view the data related to the branch. the number of branch instructions is RETIRED_BR_INST, and the number of branch misprediction is RETIRED_BR_INST_MISP. The PTI suffix indicates that each unit of the data is measured per thousand instructions. These names may differ in different versions of the performance profiler. Everything is finalized on the basis of PMCs described in PPR.
It is clear that the “test” function has 321.26 branch instructions per thousand instructions and 34.48 branch mispredicted instructions, giving a branch misprediction rate of approximately 10.73%. This overall miss rate is already quite high, and the branch misprediction rate for a specific single instruction may be even higher.
Double-click on the “test” function to open the SOURCES page, you can find that branch prediction failures do occur mostly near jump instructions within max macros. Because the loop inside the function also uses branch instructions and has a lower probability of causing branch prediction failure, the overall branch misprediction rate (11.2%) of the macro will be higher. The highest misprediction rate of a single instruction is 33%, which will significantly reduce throughput. But the silver lining is that, with random input, the overall branch prediction hit rate can still reach nearly 90%. This is a testament to the effectiveness of modern CPU branch prediction modules.
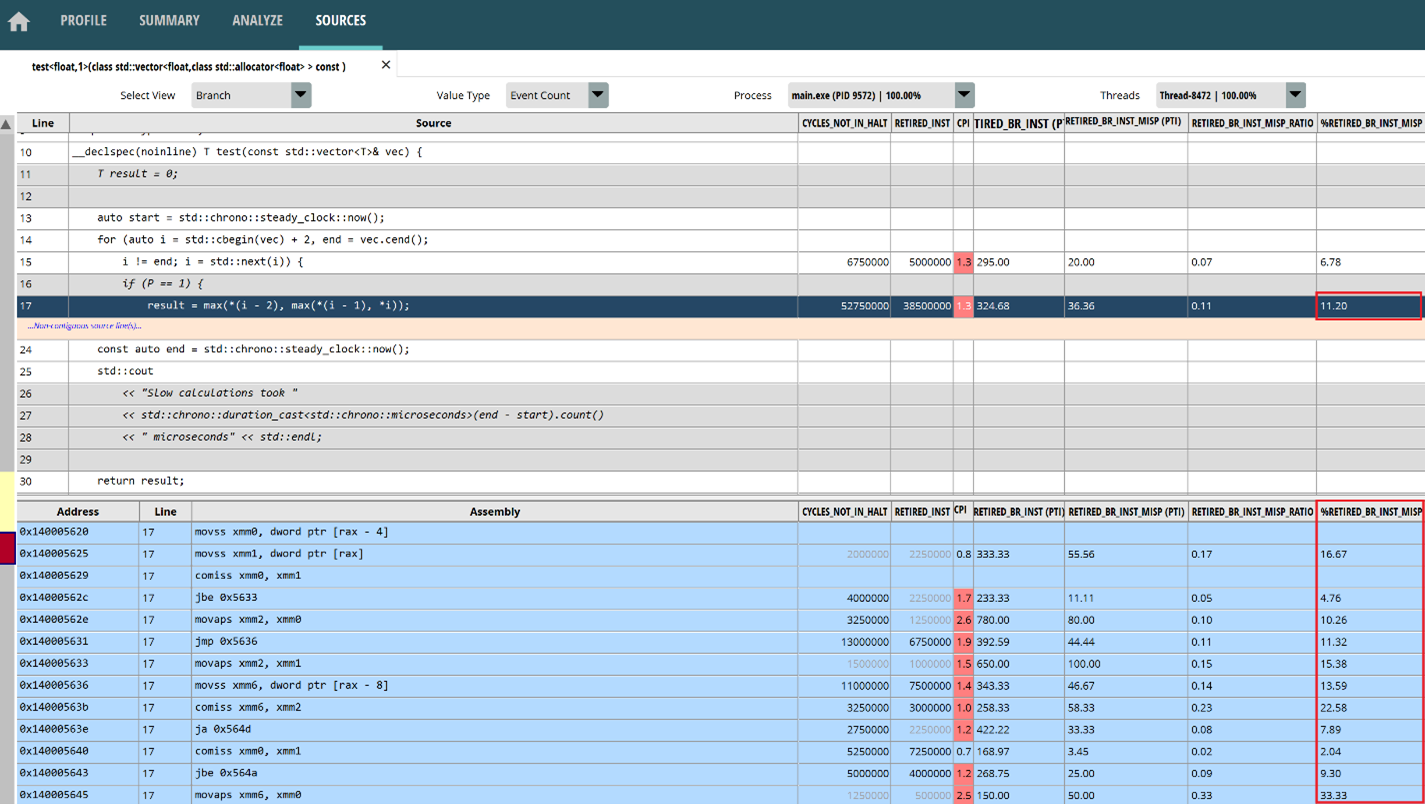
The problem is clearly not with the macro but with the ternary operator. If you replace the macro directly with the ternary operator, the result will still be similar. Visual Studio 2022 may generate a conditional jump instruction when compiling a multi-level ternary operator, increasing the likelihood of branch misprediction.
Due to the multi-stage pipeline design of CPUs, a branch prediction failure will cause the pipeline to be flushed and reloaded, resulting in a loss of hundreds of clock cycles and thus increasing the latency of the conditional instructions. Therefore, it’s necessary to avoid branch mispredictions as much as possible. For ordinary arithmetic programs, the compiler can generate “cmov” series instructions to avoid this problem.
Of course, this is not the end. Due to the different architectures of branch prediction modules in different CPUs, the branch prediction hit rate may vary greatly. The length of the pipeline may also vary, resulting in different clock losses for the CPU, which needs field tests.
Do different combinations of inputs lead to different results? For example: change the input type to int integer; take the maximum of only two numbers instead of three; use ordered input data; use the if else operator, and so on. You can analyze such permutations and combinations as after-school exercises.
Based on my testing, in the case of random input, the speed of the ternary operator is similar to that of std::max(a, b) only when we take the maximum value of two integers.
This blog takes branch prediction as a simple example to show how to analyze assembly and PMC, and eventually solve the task. But keep in mind, branch prediction is a very complex and difficult subject. A large part of the reason for using this example in this blog is that it is concise enough and comes from an actual project. We are likely to encounter more complex branch prediction problems in other projects, which require more in-depth profiling and more sophisticated solutions.
Now, a full performance profiling optimization process has been completed. You can see some subtle differences behind the compiler. Code with the same logic may generate completely different instructions, and the performance of these different instructions may vary greatly. The task for software optimization is to find the optimal solution.
Wish you all the best in your work!


