Radeon™ Rays
The lightweight accelerated ray intersection library for DirectX®12 and Vulkan®.
On this page
After reading the Preface to the CPU performance optimization guide and part 1, I believe you already have a general understanding of the basic concepts of CPU performance optimization. This part of the series will introduce a problem encountered in a real project to help readers understand more about CPU performance optimization and I hope this series will be of some help to your own project.
A very real issue we often encounter in project development is how to find and solve cache invalidation? Memory operations are widely distributed in the program. The read and write speeds of the cache and the memory are tens or hundreds of times different, so ensuring that the program obtains data from the cache rather than the memory as much as possible can greatly improve performance.
First of all, different data structures can cause completely different caching behavior, so we need to determine the data structure. Here, we choose the continuous array of structures and array of pointers to structure.
Then comes the compiler. Due to the popularity and ease of use of Windows 10, Visual Studio 2022 is selected as the development environment, version 17.8.6. The compiler version is 19.38.33135. The compiler type is x64 RelWithDebInfo. The operating system version is 10.0.19045.3930.
Finally, the CPU needs to be identified because the architecture is constantly being updated, and the cache capacity and policies are completely different for different CPUs. The strong dependence on hardware means that the CPU determines which performance analyzer can be used. The CPU used in this example is an AMD 7900X3D, so the performance analyzer I used is AMD μProf, version number 4.2.845.
Now we have set the stage, it’s time to build the benchmark. The benchmark needs to meet the following conditions:
This time, we are using a struct array. The only difference between the two arrays is what they store. One stores the struct instances and the other stores the pointers to struct.
50 million data points is large enough to ensure accurate performance data. Randomness is guaranteed by the memory allocator of std::unique_ptr. Each pointer has a unique and random memory address. Memory addresses are not necessarily consistent, but the read speed of the CPU after the cache prefetch failure is roughly the same, which can ensure partial consistency.
The test function is relatively simple. We traverse two std::vector and operate on its internal data. Finally, we count the elapsed time. Consider adding a noinline declaration to prevent the compiler from expanding the function to facilitate debugging.
__declspec(noinline) float test_array(unsigned long long size) {    float result = 0;    std::vector<Point> points(size);
    auto start = std::chrono::steady_clock::now();    for (const auto& i : points) {        result = i.x + i.y + i.z + i.w;    }    const auto end = std::chrono::steady_clock::now();    std::cout       << "Slow calculations took "       << std::chrono::duration_cast<std::chrono::microseconds>(end - start).count()       << " microseconds" << std::endl;
    return result;}
template <int prefetch>__declspec(noinline) float test_pointer(unsigned long long size) { float result = 0; std::vector<std::unique_ptr<Point>> points;
for (decltype(size) i = 0; i < size; ++i) { points.emplace_back(std::make_unique<Point>()); }
auto start = std::chrono::steady_clock::now(); for (auto i = points.cbegin(); i < points.cend(); ++i) { if (prefetch) { _mm_prefetch((char*)((*std::next(i, 32)).get()), _MM_HINT_NTA); _mm_prefetch((char*)((*std::next(i, 48)).get()), _MM_HINT_NTA); _mm_prefetch((char*)((*std::next(i, 64)).get()), _MM_HINT_NTA); } result = (*i)->x + (*i)->y + (*i)->z + (*i)->w; } const auto end = std::chrono::steady_clock::now(); std::cout << "Slow calculations took " << std::chrono::duration_cast<std::chrono::microseconds>(end - start).count() << " microseconds" << std::endl;
return result;}Next is the performance test. You need to run it a few more times and average the data to prevent hopping. As you can clearly see, an array of structs is faster, an array of pointers to struct is slower, and an array of pointers to struct with software cache prefetching is somewhere between the two.
The next phase is to analyze the problem, with a focus on the PMC counters within the performance analyzer.
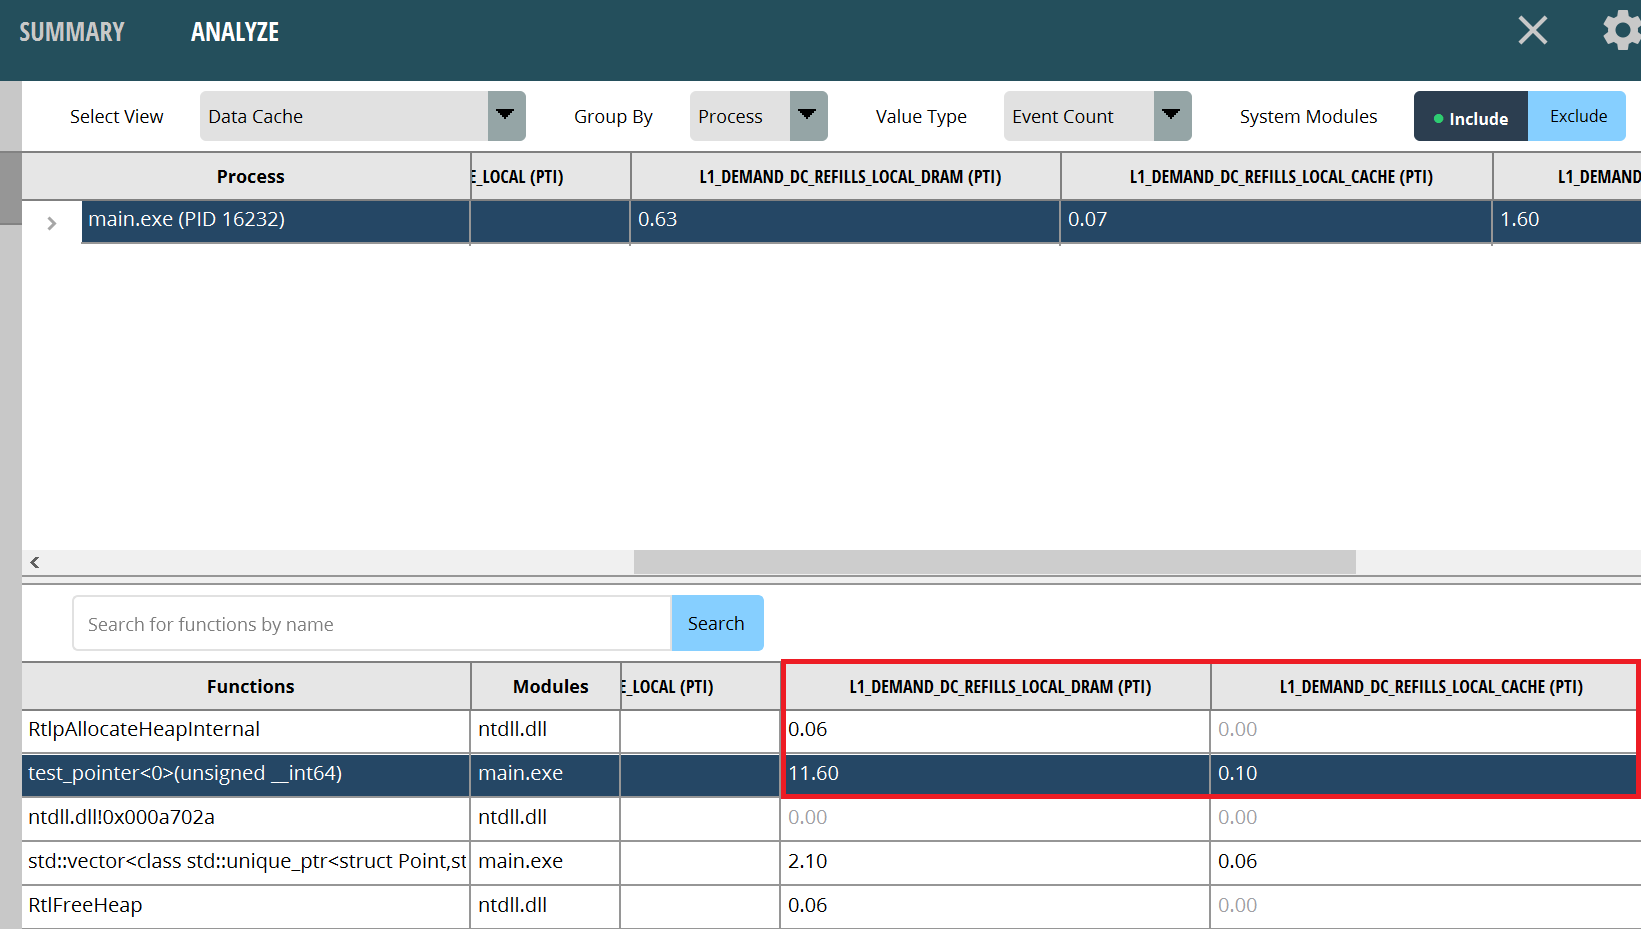
Use the performance analyzer to analyze PMC, using “Assess Performance (Extended)” for the option set. After the run, switch to the “ANALYZE” page, and then switch to the “Data Cache” view to see the PMC associated with the branch. The number of L1 cache misses are L1_DEMAND_DC_REFILLS_LOCAL_DRAM, L1_DEMAND_DC_REFILLS_LOCAL_CACHE, and L1_DEMAND_DC_REFILLS_LOCAL_L2. The PTI suffix indicates that the data is normalized per thousand instructions. These names, of course, may vary in different versions of the performance analyzer. It hinges on the corresponding hardware PMC in the PPR.
First, we analyze the test_pointer<0> function. It is obvious that there are 11.60 memory reads caused by L1 cache misses and 0.1 lower-level cache reads caused by L1 cache misses and 0.1 L3 cache reads caused by L1 cache misses per 1,000 instructions. The number of memory reads should be as low as possible.
 Figure1: Pointer array cache invalidation
Double-click the test_pointer<0> function to open the “SOURCES” page. You can see that cache prefetch failures do occur mostly near the pointer operations.
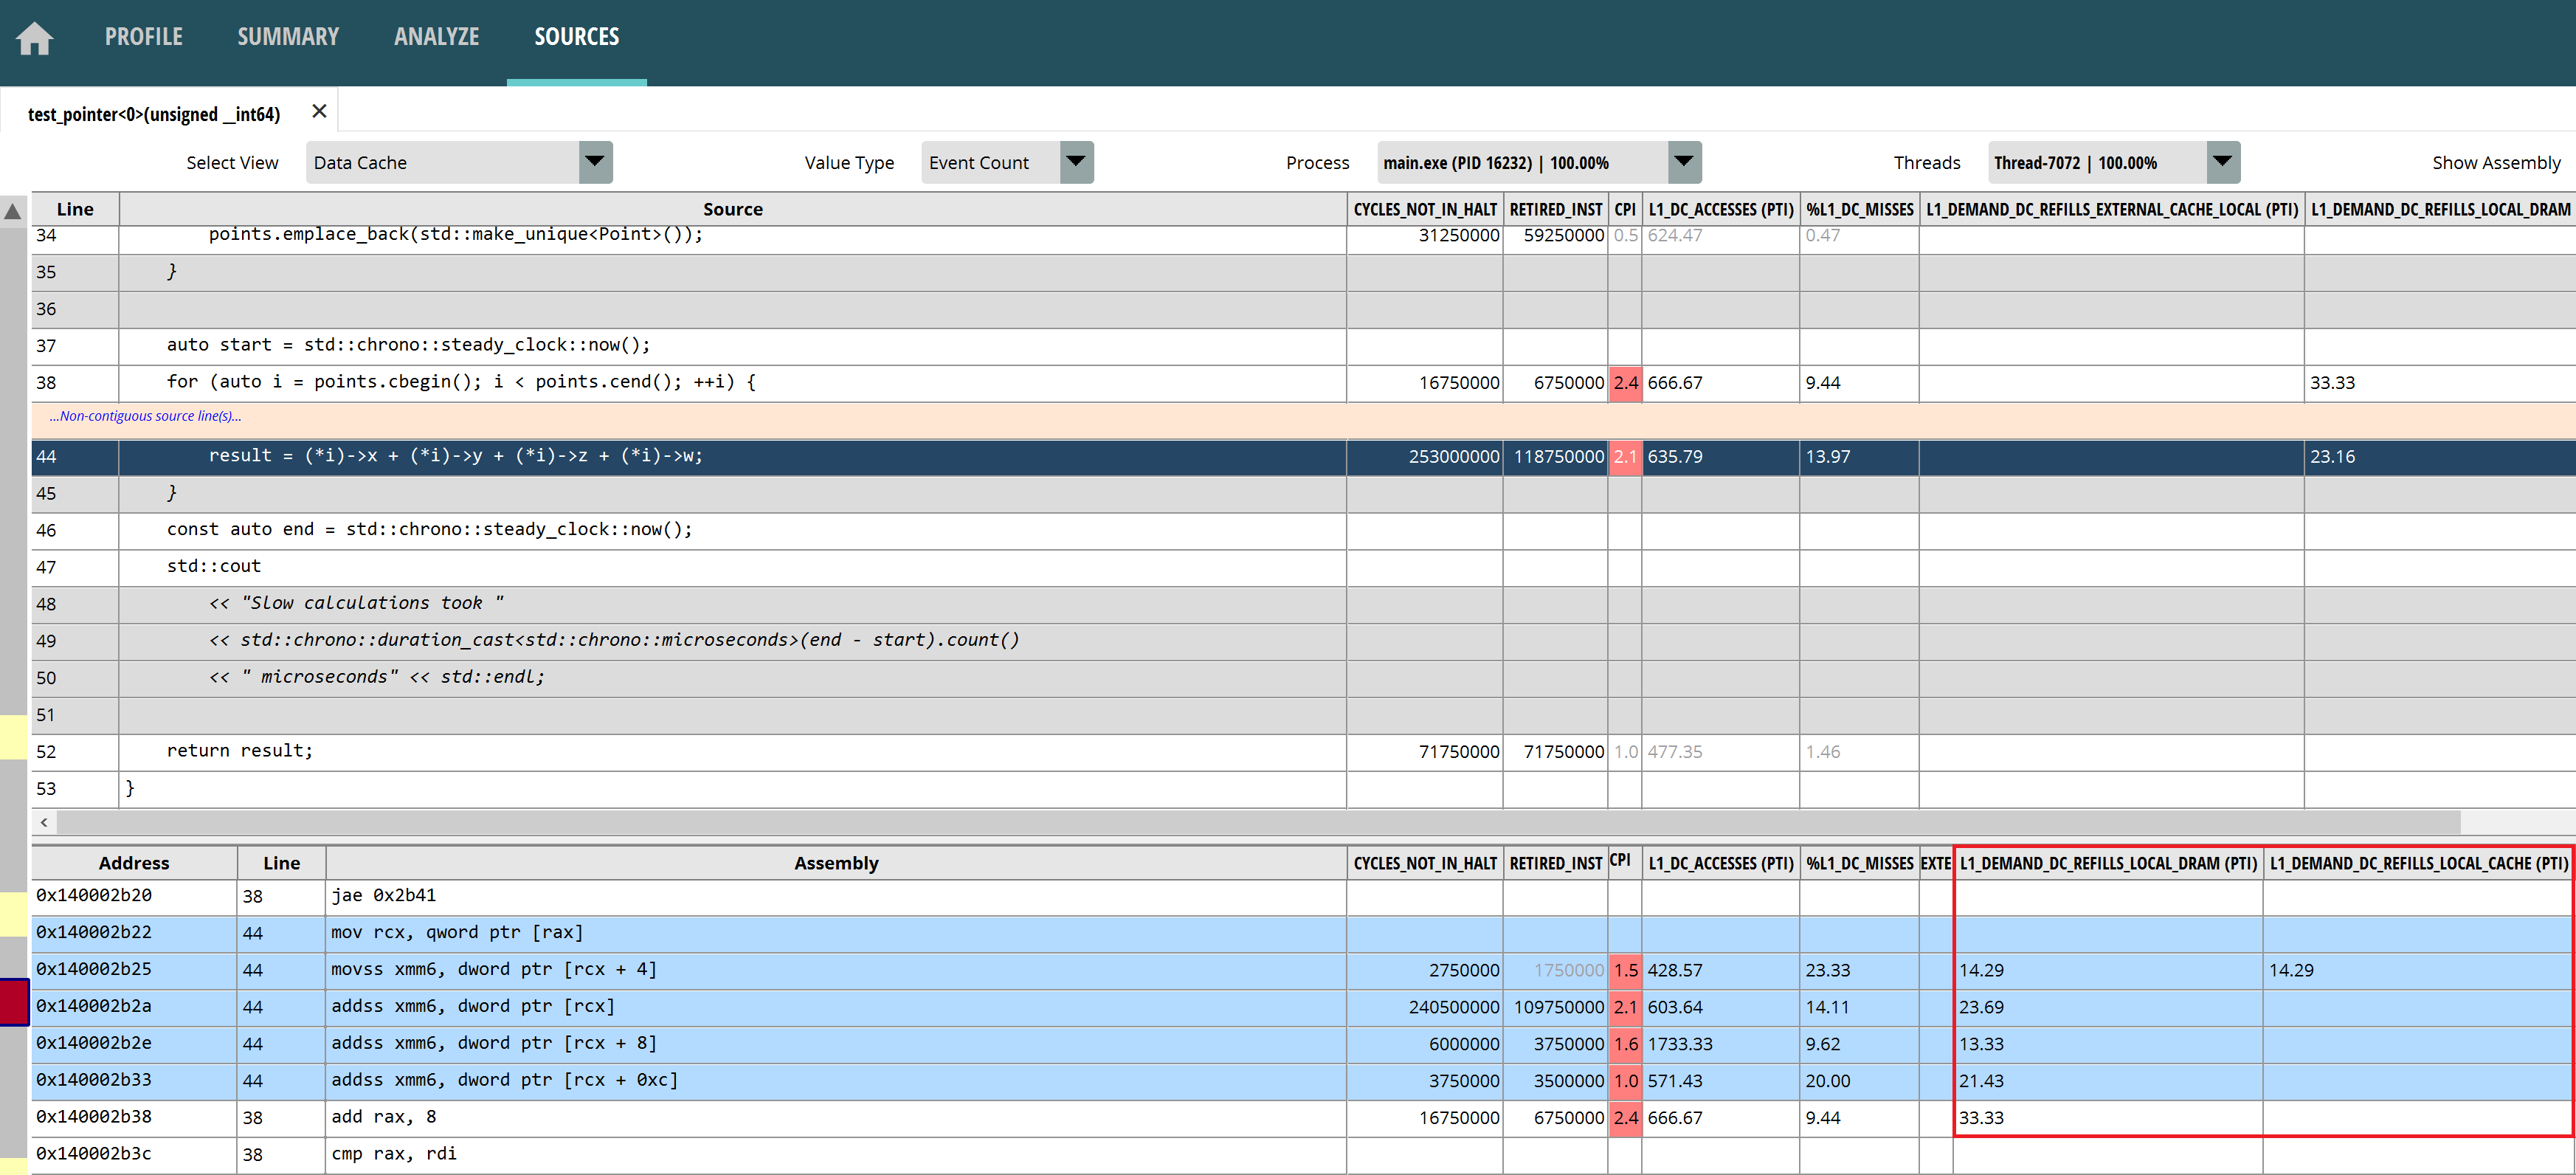 Figure2: Pointer Array Cache Invalidation Assembly
Next, let’s look at the test_array function. It’s clear that there are fewer cache misses, which guarantees lower latency to access instructions. It’s mainly because successive data reads will trigger the CPU’s hardware cache prefetch, thus ensuring a high cache hit rate. The type of data structure access mode which will trigger the hardware cache prefetch depends on the specific CPU model. Please refer to the CPU programming manuals for these details. In most cases, however, the CPU performs well when processing small ranges of contiguous data. “AMD Ryzen™ Processor software optimization GDC 2023”, pp. 23-26, can serve as a good reference.
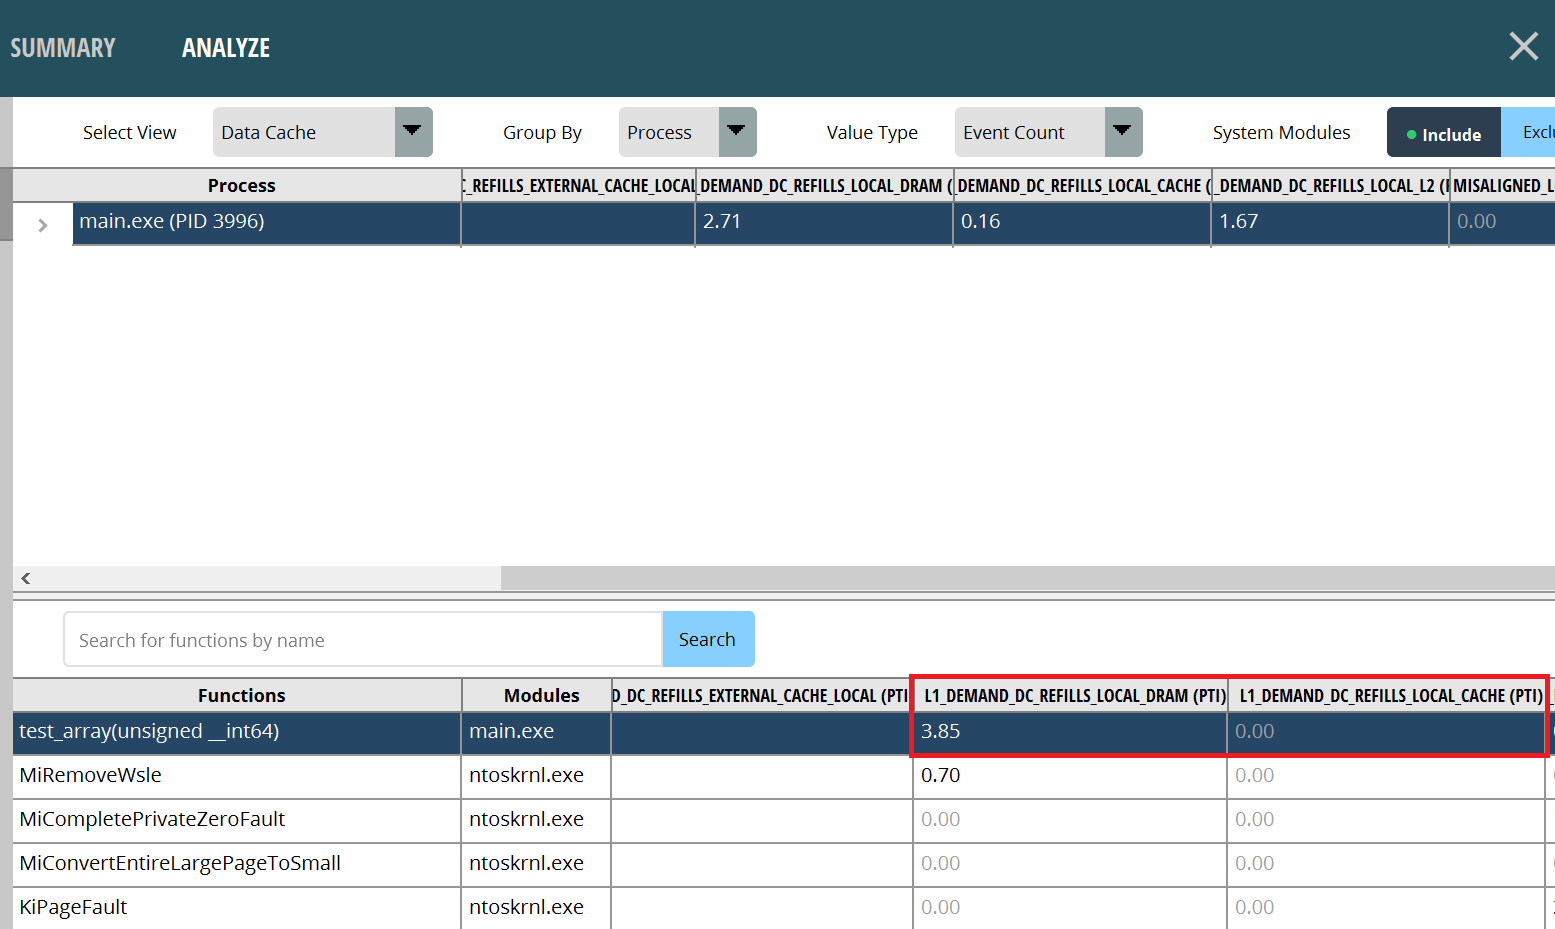 Figure3: Contiguous Array Cache Hits
Now let’s look at the test_pointer<1> function. We can see that using _mm_prefetch for software cache prefetching results in fewer cache misses, thus guaranteeing lower latency for accessing instructions. However, the latency is still not as good as hardware cache prefetching for a number of reasons:
_mm_prefetch itself also consumes CPU clock and cannot be called too much.INEFFECTIVE_SW_PF. It can be seen that there are 128.67 invalid software cache prefetches per thousand instructions in the example, which needs to be avoided in actual projects.To sum up, software prefetching is a trade-off when hardware prefetching is not possible. It can reduce some of the latency, but it’s hard to be optimal. Similar to hardware prefetching, software prefetching strategies vary by CPU model. “AMD Ryzen™ Processor software optimization GDC 2023”, p. 22, can be a useful reference.
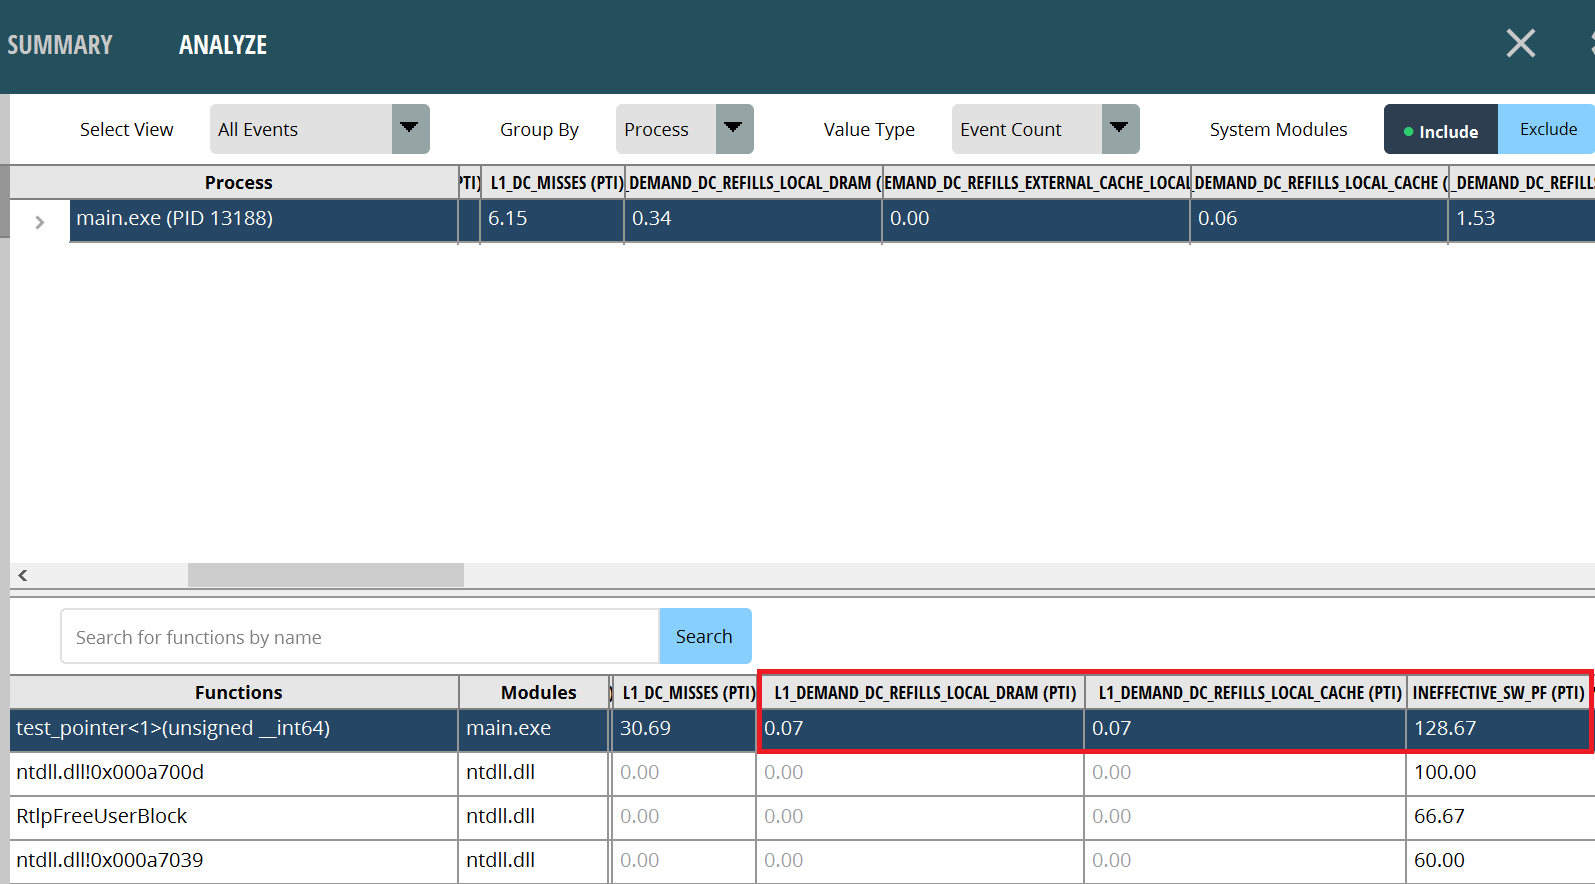 Figure4: Pointer Array Cache Prefetch
This blog uses cache invalidation as a simple example to show you how to analyze PMC and provides a workaround. It must be noted, however, that caching issues are extremely complex. The example presented in this blog is just one of the more common ones. We will probably cover issues like cache alignment and multi-core ping-pong cache in the future. Hitherto, a complete cache invalidation analysis process has been completed. You can see the huge performance gaps behind the different memory operations. Ensuring that the program can make the most of the CPU cache to reduce latency is also a task for software optimization.
Finally, I wish you all success in your work.

